SPATIAL STATISTICS OF TEXTONS
Gary Dahme and Eraldo Ribeiro
Department of Computer Sciences
Florida Institute of Technology
Melbourne, FL, USA
Mark Bush
Department of Biological Sciences
Florida Institute of Technology
Melbourne, FL, USA
Keywords:
Texture classification, co-occurrence statistics, pollen recognition, texton.
Abstract:
Texture classification is one of the most studied and challenging problems in computer vision. A key require-
ment of successful texture classification algorithms is their ability to quantify the complex nature and diversity
of real world textures. Recent developments in automatic texture classification have demonstrated the effec-
tiveness of representing texture elements as cluster centers of convolution responses of a filter bank. These
representation of texture elements are called textons. Such methods rely primarily on similarity measurements
of frequency histograms of vector quantized versions of the target texture. A main problem with these ap-
proaches is that pure frequency histograms fail to account for important spatial interaction between textons.
Spatial interaction is key to classification when analyzing textures with similar texture element frequency but
differ in the way the texture elements are distributed across the image. In this paper, we propose the use of
co-occurrence statistics to account for the spatial interaction among texture elements. This is accomplished
by calculating spatial co-occurrence statistics on the maps of textons generated by the vector quantization
procedure. We demo nstrate the effectiveness of our method on images from the Brodatz album as well as
natural textures from a tropical pollen database. We also present a comparison with a state-of-the-art method
for texture classification. Finally, our experiments show that the use of spatial statistics help improve the clas-
sification rates for certain textures that present sparse and statistically non-stationary texture elements such as
pollen grain textures.
1 INTRODUCTION
Recent developments in texture classification have
demonstrated the effectiveness of representing tex-
ture elements as cluster centers of convolution re-
sponses of a filter bank. The main idea in these ap-
proaches is to create statistically representative ap-
pearance models that describe the repetitive patterns
of a texture (Leung and Malik, 2001; Varma and Zis-
serman, 2004). These appearance models of texture
elements are called textons. The modeling procedure
consists of learning a dictionary of textons containing
all the representative texture elements in the training
dataset. This is followed the construction of a vec-
tor quantized map of the texture image based on the
texton dictionary. The vector quantized map is called
“texton map” and comparisons between two textures
is accomplished via a χ
2
test of frequency histograms
of their corresponding texton maps.
However, important spatial relationship between
textons is lost during the process of histogram genera-
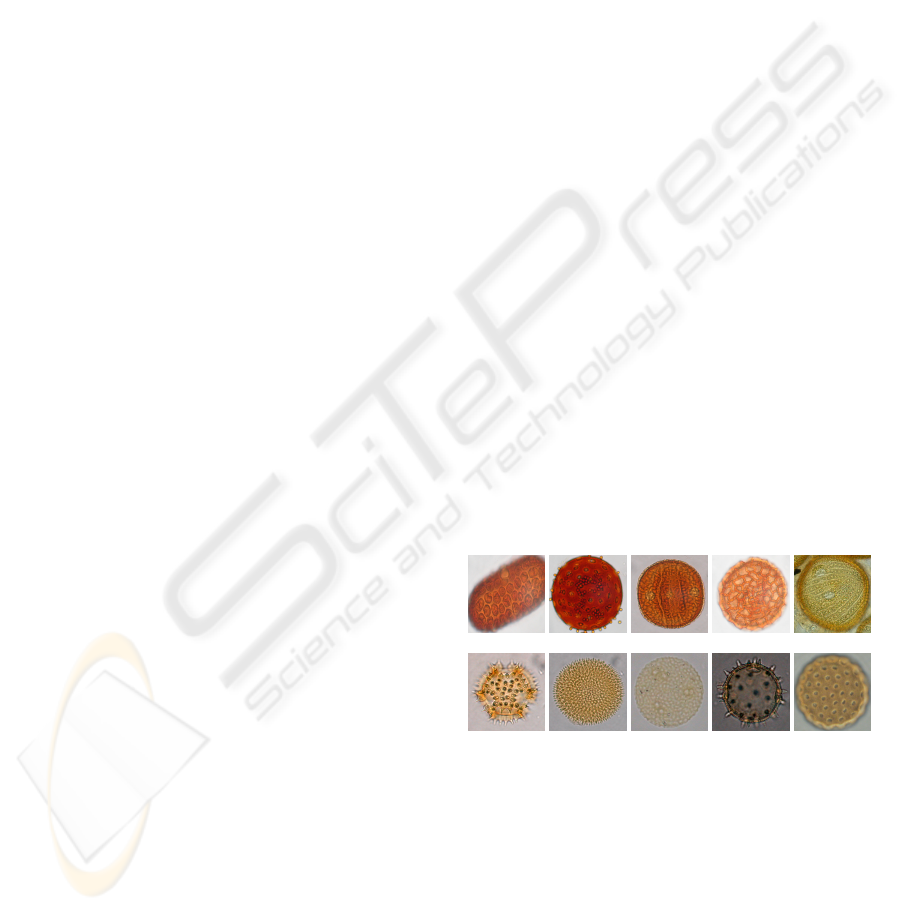
Figure 1: Optical microscopy images of pollen grains from
the Neotropical Pollen Database (Mark and Wengs, 2006).
Pollen grain textures usually present well defined and dis-
tinctive texture elements. The spatial distribution of texture
patterns tends to be sparse and quasi-regular.
tion. As a result, chi-square comparison of texton his-
tograms alone will not provide enough distinguishing
power to classify textures that differ mostly in their
spatial structure while having similar frequency statis-
tics. A simple and effective way to solve this problem
13
Dahme G., Ribeiro E. and Bush M. (2006).
SPATIAL STATISTICS OF TEXTONS.
In Proceedings of the First International Conference on Computer Vision Theory and Applications, pages 13-19
DOI: 10.5220/0001368900130019
Copyright
c
SciTePress

is to calculate spatial statistics on the texton maps and
use these statistics for classification.
In this paper, we propose the use of co-occurrence
spatial statistics calculated on the texton maps as a
means to improve classification of textures that dif-
fer mostly in their spatial structure. In the implemen-
tation proposed in this paper, we use the gray-level
co-occurrence matrix (GLCM) (Haralick et al., 1973)
to account for the spatial structure of textons. These
statistics help improve classification of textures, espe-
cially in those textures that otherwise cannot be cor-
rectly classified using histogram-based methods.
We are particularly interested in the classification
of textures that present similar texton frequency, but
differ in the way their textons are spatially distributed
in the image. Examples of such textures include man-
made ones such as buildings and cloth pattens, and
natural ones such as coral reefs and pollen grains.
In this paper, we show how the spatial structure of
textons can be used for the recognition of pollen in
optical microscope images (Bush, 2000; Mark and
Wengs, 2006). We are currently working on the de-
velopment of an automatic image-based algorithm
for pollen recognition. Figure 1 shows examples of
pollen grain images acquired using an optical micro-
scope.
The remainder of this paper is organized as follows.
In Section 2, we provide a concise review of the cur-
rent related literature. In Section 3, we summarize
the original texton-based classification framework. In
Section 4, we describe the details of our method. In
Section 5, we demonstrate the effectiveness of our al-
gorithm on two texture datasets. Finally, in Section 6,
we present our conclusions and plans for future work.
2 RELATED WORK
The literature on texture classification is extensive.
In general, approaches can be divided into two main
groups: 2D methods and 3D methods. The first group
of methods model texture in terms of the spatial varia-
tions of albedo on a planar surface. The second group
of methods attempts to model the reflectance varia-
tions due to 3D factors such as surface relief, cam-
era viewpoint, and illumination. Representative of
2D methods include works based on Markov Ran-
dom Fields, which model the spatial statistical rela-
tionships of pixels (Chellapa et al., 1985; Cross and
Jain, 1983), and descriptive models based on filter
banks (Leung and Malik, 1999). Recent work on tex-
ture classification has focused on the problem of mod-
eling 3D appearance of surface materials (Leung and
Malik, 2001; Varma and Zisserman, 2004; Dong and
Chantler, 2005).
Leung and Malik (Leung and Malik, 1999; Le-
ung and Malik, 2001) have introduced a descriptive
model capable of encoding essential local structures
and attributes of natural textures. Their method be-
gins by representing each pixel of a texture as the
convolution response of a bank of multi-scale and
multi-orientation filters. The filter responses at each
pixel location are concatenated into vectors. A K-
means clustering method (Duda et al., 2001) is ap-
plied to each filter response vector and the estimated
cluster centers are chosen to be statistical representa-
tions of the texture elements or “textons”. The idea
of textons as cluster centers of filter responses has in-
spired several extensions of Leung and Malik’s origi-
nal method (Varma and Zisserman, 2004; Dong and
Chantler, 2005; Cula and Dana, 2004; Zhu et al.,
2005).
The strength of Leung and Malik’s (LM) method
is the ability to learn a statistically descriptive model
of textures based on the responses of the filter bank.
However, the method in its original version relies
on similarity measurements between one-dimensional
frequency histograms of vector quantized texture im-
ages. As a result, important information is lost in the
process of histogram generation.
A possible solution to account for spatial struc-
ture is to represent the relationship among textons us-
ing spatial statistics measurements such as Markov
Random Fields (Chellapa et al., 1985; Cross and
Jain, 1983; Li, 1995) as well as descriptors of a co-
occurence matrix (Haralick et al., 1973). In this pa-
per, we propose the use of the well-known gray-level
co-occurrence matrix as a way to capture spatial in-
teraction among textons (Haralick et al., 1973). Next,
we will show how texton spatial interaction represen-
tation can help improve recognition rates for certain
types of textures.
3 TEXTONS AS CLUSTER
CENTERS
In this section, we briefly describe Leung and Ma-
lik’s (Leung and Malik, 1999) approach to texture
classification. The key idea is to model texture el-
ements as cluster centers of convolution filter re-
sponses. Let F be a bank of filters of several ori-
entations and scales. Figure 2 shows an example of
the filter bank used in (Leung and Malik, 1999; Le-
ung and Malik, 2001). The filter bank consisted of 4
types of filters including an oriented filter set and an
isotropic filter set. The oriented set is comprised of
two groups, where each group has 6 different orienta-
tions and 3 different scales. The isotropic set consists
of 12 filters each at different scales.
The process begins with the construction of a tex-
ton dictionary that will represent the information in
VISAPP 2006 - IMAGE UNDERSTANDING
14

Figure 2: Filter bank consisting of 48 filters with varying
orientations and scales (Leung and Malik, 2001). The ori-
ented filters consists of two sets, each having 6 different
orientations at 3 different scales. The remaining 12 are
isotropic filters at different scales.
each texture sample. Let I(x, y) be a texture image.
Image I(x, y) is convolved with the filter bank F to
produce a set of filter responses as follows:
R
i
(x, y) = F
i
∗ I(x, y), i = 1, . . . , K. (1)
Where K is the total number of filters in the filter
bank. In (Leung and Malik, 1999; Leung and Malik,
2001), K is choosen to be 48. By stacking the filter
responses R
i
, each pixel of I(x, y) can now be rep-
resented by a K-dimensional feature vector p whose
elements are the filter responses at each pixel location
(x, y). Each pixel in the texture image is represented
by:
p(x, y) = [R
1
(x, y), . . . , R
K
(x, y)]
T
(2)
The repetitive nature of textures implies that there will
be many similar values of p. To account for this re-
dundancy, the vectors p are grouped using a K-Means
clustering algorithm. The cluster centers produced by
the K-means procedure are assumed to be statistical
representations of the texture elements in the image
and are called “textons”. These textons are placed into
set that represents a dictionary used to “explain” each
texture in the training dataset. Describing a texture
in terms of the texton dictionary is accomplished via
a vector quantization procedure in which each pixel
location of an image is labeled with the index corre-
sponding to the closest texton in the dictionary. This
creates an intermediate representation of the image
that is called a texton map. Examples of texton maps
generated from two distinct pollen grain textures are
illustrated in the first column of Figure 3.
Finally, the classification stage is based on a chi-
square similarity measure between frequency his-
tograms of texton maps. The chi-square similarity is
given by:
χ
2
(p, q) =
X
i
(p
i
− q
i
)
2
p
i
+ q
i
(3)
where p
i
and q
i
are bins of two texton map histograms
p and q, respectively.
However, while the chi-square measure may be a
suitable means for classification of textures exhibit-
ing statistically stationary features (i.e., uniform level
of regularity in spatial distribution), the case may
arise where two textures that share similar frequency
statistics nevertheless differ greatly in terms of spa-
tial properties. In such an instance, a frequency
histogram-based method would identify the two tex-
tures as belonging to the same class. On the other
hand, an approach based on spatial statistics would be
able to correctly distinguish between them. In Fig-
ure 3, we show an example of this problem. As pre-
viously mentioned, the first column shows the tex-
ton maps of two very distinct pollen grain textures.
The texture in the top row is composed by elongated
texture patterns while the one in the bottom row has
large blobs as texture elements. Yet, both textures
produce almost identical texton frequency histograms
using the method proposed by Leung and Malik. The
second column (center) displays the Leung and Ma-
lik frequency histograms as generated from the corre-
sponding texton maps.
4 ADDING SPATIAL STATISTICS
In this section, we describe how spatial statistics can
help improve the classification of certain types of tex-
tures that cannot be correctly classified using texton
frequency histogram-based methods.
A simple and effective way to represent spatial in-
teraction among texture elements is by directly cal-
culating spatial statistics on the texton maps. In our
implementation, we propose the use of measurements
based on the well-known gray-level co-occurrence
matrix (Haralick et al., 1973). Co-occurrence matri-
ces effectively capture spatial texture structure of an
image. Given an image, the GLCM is a matrix in
which each entry (i, j) corresponds to the frequency
of occurrences of the pair of intensity values i and j
that are at a distance d apart in the original image.
A set of texture descriptors can be extracted from the
co-occurrence matrix. In the original work by Haral-
ick (Haralick et al., 1973), 16 texture descriptors were
proposed. In our current implementation, we adopt
the four most used descriptors. We calculate them at
four angular intervals of 45 degrees. The descriptors
we use are shown in Table 1.
In the equations listed in Table 1, P
d
represents a
gray-level co-occurrence matrix calculated at a dis-
tance interval d .
Figure 3 illustrates the importance of quantifying
the spatial relationship between textons. The right
column displays the values of our texture descrip-
tor based of the co-occurrence matrix calculations on
the corresponding texton maps in the first and sec-
SPATIAL STATISTICS OF TEXTONS
15
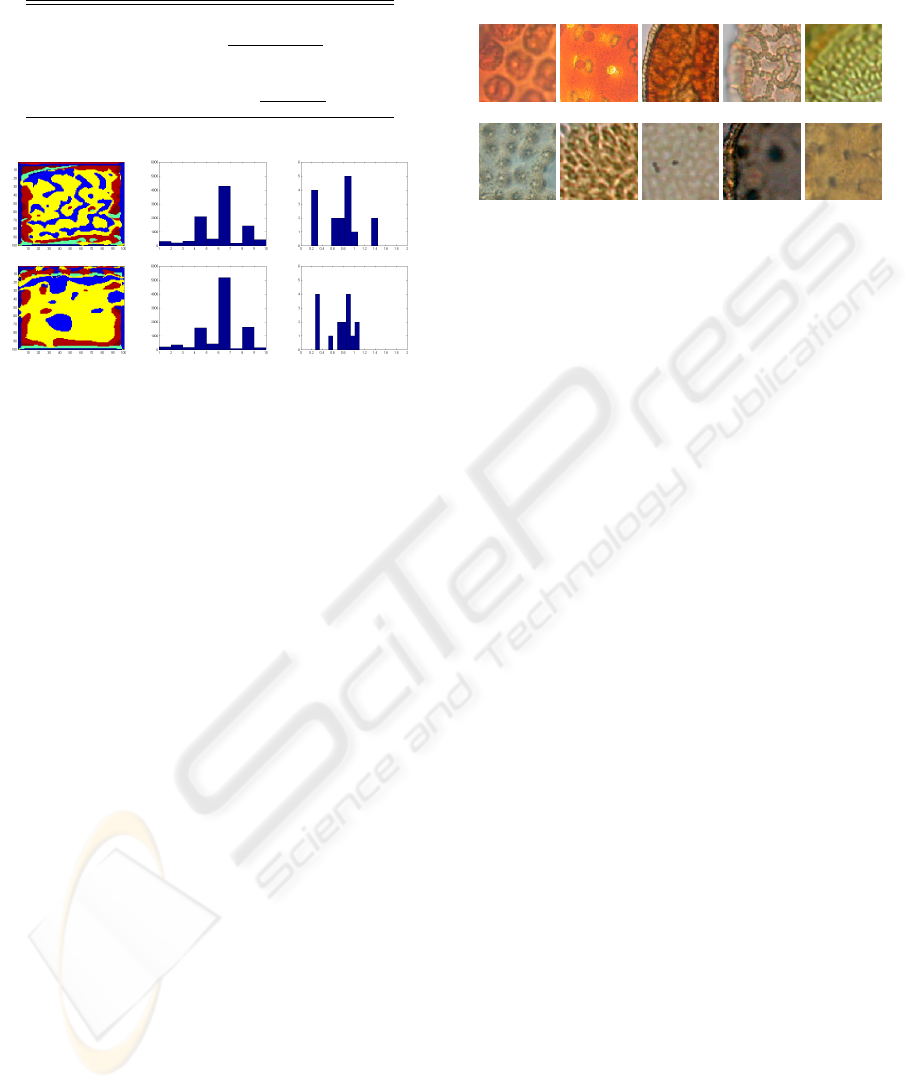
Table 1: Co-occurrence Matrix Descriptors.
Contrast
P
i
P
j
(i − j)
2
P
d
(i, j)
Correlation
P
i
(i−µ
i
)(j−µ
j
)
σ
i
σ
j
Energy
P
i
P
j
P
d
(i, j)
2
Homogeneity
P
i
P
j
P
d
(i,j)
1+(i−j)
2
(a) Texton maps (b) Leung and Ma-
lik
(c) Our Method
Figure 3: Two examples of similar histograms from differ-
ent textures. Left column: texton maps for two distinct
pollen grains. Center column: corresponding texton his-
tograms. Right column: Histogram displaying values of co-
occurrence features.
ond row of the first column, respectively. We dis-
play the values of our descriptor in histogram form for
the purpose of illustration. The descriptors generated
by our representation encodes the distinction between
the textures. This is an example when the frequency-
based method does not always provide enough infor-
mation for the discrimination of certain textures.
5 EXPERIMENTS
The aim of our experiments was to demonstrate that
the use of spatial statistics on the texton-based rep-
resentation originally proposed by Leung and Ma-
lik (Leung and Malik, 2001) can help improve when
textures differ mostly by the spatial structure of tex-
tons.
We begin by providing a comparison between our
method and the histogram-based framework proposed
by Leung and Malik. Our experiments consist of two
main comparisons. Firstly, we compare the classifica-
tion results of the LM method with our method using
20 textures from the Brodatz album (Brodatz, 1966).
The classification results are shown in Table 2 and Ta-
ble 3, respectively. In the second set of experiments,
we repeat the classification procedure using 10 im-
ages from our Neotropical Pollen Database (Mark and
Wengs, 2006). The classification results are shown in
Table 4 and Table 5, respectively.
Figure 4: Subregions of pollen images (Mark and Wengs,
2006). Subregions were extracted from images shown in
Figure 1.
In Tables 2 through 5, columns represent known
textures for which a database has been learned using
the K-means clustering as described in Section 3.
The rows represent unknown textures that we wish
to classify. Each cell in the tables represents the per-
centage of classification between a sample of novel
textures and each texture in the learned training set.
For illustration purposes, we display the texture im-
ages in each corresponding cell in the tables.
For classification results on the Brodatz textures,
the overall recognition rate of our method was 88%,
whereas the LM approach was 96%. Table 2 and Ta-
ble 3 summarize the results of this classification ex-
periment.
In the second part of the experiments, we apply our
method to the problem of pollen recognition based on
surface texture. The overall recognition rate of our
method on pollen grain textures was 81%, whereas
the LM method was 69%. Examples of the pollen
grain subregions used are shown in Figure 4. The
source images from which the subregions were taken
are shown in Figure 1 at the beginning of this paper.
The results are presented in Table 4 and Table 5.
Pollen grain textures present two key differences
when compared to textures in the Brodatz album and
other available texture databases. Firstly, pollen tex-
ture do not present strong statistical regularity in the
spatial arrangement of texture elements. Secondly,
spatial arrangement of texture elements is the most
distinctive feature for most pollen grains. The spatial
arrangement is naturally captured by our descriptor
and this allows it to achieve better recognition rates
than the ML method for pollen grain textures.
Finally, in it current form, our method did not out-
perform the ML method for most textures in the Bro-
datz album. We believe that the main reason for this
is the fact that Brodatz textures, in general, exhibit
more statistically stationary behavior than our pollen
textures.
VISAPP 2006 - IMAGE UNDERSTANDING
16

Table 2: Classification Percentage Matrix for Brodatz Textures (Texton Co-occurrence).
D1 .7 0 0 0 0 0 0 0 0 0 0 .1 0 .1 0 .1 0 0 0 0
D3 0 .9 0 0 0 0 0 0 0 0 0 0 0 0 .1 0 0 0 0 0
D6 0 0 1 0 0 0 0 0 0 0 0 0 0 0 0 0 0 0 0 0
D16 0 0 0 1 0 0 0 0 0 0 0 0 0 0 0 0 0 0 0 0
D21 0 0 0 0 1 0 0 0 0 0 0 0 0 0 0 0 0 0 0 0
D24 0 0 0 0 0 1 0 0 0 0 0 0 0 0 0 0 0 0 0 0
D33 0 0 0 .2 0 0 .8 0 0 0 0 0 0 0 0 0 0 0 0 0
D34 0 0 0 0 0 0 .1 .3 .6 0 0 0 0 0 0 0 0 0 0 0
D52 0 0 0 0 0 0 .1 0 .8 0 0 0 0 0 0 .1 0 0 0 0
D53 0 0 0 0 0 0 0 0 0 1 0 0 0 0 0 0 0 0 0 0
D63 0 0 0 .4 0 0 0 0 0 0 .6 0 0 .0 0 0 0 0 0 0
D64 .1 0 0 .1 0 0 0 0 0 0 .1 .7 0 0 0 0 0 0 0 0
D77 0 0 0 0 0 0 0 0 0 0 0 0 1 0 0 0 0 0 0 0
D86 0 0 0 0 0 0 0 0 0 0 0 0 0 1 0 0 0 0 0 0
D87 0 .1 0 0 0 0 0 0 0 0 0 0 0 0 .9 0 0 0 0 0
D95 0 0 0 0 0 0 0 0 0 0 0 0 0 0 0 1 0 0 0 0
D102 0 0 0 0 0 0 0 0 0 0 0 0 0 0 0 0 1 0 0 0
D103 0 .1 0 0 0 0 0 0 0 0 0 0 0 0 0 0 0 .9 0 0
D110 0 0 0 0 0 0 0 0 0 0 0 0 0 0 0 0 0 0 1 0
D111 0 0 0 0 0 0 0 0 0 0 0 0 0 0 0 0 0 0 0 1
D1 D3 D6 D16 D21 D24 D33 D34 D52 D53 D63 D64 D77 D86 D87 D95 D102 D103 D110 D111
Table 3: Classification Percentage Matrix for Brodatz Textures (Texton Frequency Histogram).
D1 .9 0 0 0 0 0 0 0 0 0 0 0 0 0 0 0 0 0 .1 0
D3 0 .9 0 0 0 0 0 0 0 0 0 0 0 0 .1 0 0 0 0 0
D6 0 0 1 0 0 0 0 0 0 0 0 0 0 0 0 0 0 0 0 0
D16 0 0 0 1 0 0 0 0 0 0 0 0 0 0 0 0 0 0 0 0
D21 0 0 0 0 1 0 0 0 0 0 0 0 0 0 0 0 0 0 0 0
D24 0 0 0 0 0 1 0 0 0 0 0 0 0 0 0 0 0 0 0 0
D33 0 0 0 0 0 0 1 0 0 0 0 0 0 0 0 0 0 0 0 0
D34 0 0 0 0 0 0 .1 .9 0 0 0 0 0 0 0 0 0 0 0 0
D52 0 0 0 0 0 0 0 0 1 0 0 0 0 0 0 0 0 0 0 0
D53 0 0 0 0 0 0 0 0 0 1 0 0 0 0 0 0 0 0 0 0
D63 0 0 0 0 0 0 0 0 0 0 1 0 0 .0 0 0 0 0 0 0
D64 0 0 0 .1 0 0 0 0 0 0 0 .9 0 0 0 0 0 0 0 0
D77 0 0 0 0 0 0 0 0 0 0 0 0 1 0 0 0 0 0 0 0
D86 0 0 0 0 0 0 0 0 0 0 0 .2 0 .8 0 0 0 0 0 0
D87 0 .1 0 0 0 0 0 0 0 0 0 0 0 0 .9 0 0 0 0 0
D95 0 0 0 0 0 0 0 0 0 0 0 0 0 0 0 1 0 0 0 0
D102 0 0 0 0 0 0 0 0 0 0 0 0 0 0 0 0 1 0 0 0
D103 0 0 0 0 0 0 0 0 0 0 0 0 0 0 0 0 0 1 0 0
D110 0 0 0 0 0 0 0 0 0 0 0 0 0 0 0 0 0 0 1 0
D111 0 0 0 0 0 0 0 0 0 0 0 0 0 0 0 0 0 0 0 .9
D1 D3 D6 D16 D21 D24 D33 D34 D52 D53 D63 D64 D77 D86 D87 D95 D102 D103 D110 D111
6 CONCLUSIONS
In this paper, we proposed the use of co-occurrence
spatial statistics calculated on the texton maps as a
means to improve classification of textures that differ
mostly in their spatial structure.
We experimented with our algorithm on a set of
texture images from the Brodatz album. We also
applied the algorithm to the problem of recognizing
pollen grain in a tropical pollen grain database. We
SPATIAL STATISTICS OF TEXTONS
17

are currently working on the development of an au-
tomated image-base pollen recognition system. Our
method achieved classification rates as high as 81%
in the case of pollen grain textures. However, it
did not significantly outperform current frequency
histogram-based methods for most textures in the
Brodatz album.
Frequency-based histograms are likely to produce
high rates of classification for statistically stationary
textures such as the ones in the Brodatz album and
some of the available texture databases. However,
methods relying on spatial statistics of texture ele-
ments are effective when applied to non-regularly and
sparsely distributed textures.
Our future work will include the further develop-
ment of method presented in this paper by experi-
menting with larger number of co-occurrence descrip-
tors. We also aim at investigating the use of Markov
Random Fields representations to model texture el-
ement interaction. For the pollen grain recognition
system, we will investigate the inclusion of contour
information to aid the recognition process.
REFERENCES
Brodatz, P. (1966). Textures: A Photographic Album for
Artists and Designers. Dover, New York.
Bush, M. (2000). Deriving response matrices from central
american modern pollen rain. Quaternary Research,
54:132–143.
Chellapa, R., Chatterjee, S., and Bagdazian, R. (1985).
Texture synthesis and compression using gaussian-
markov random fieldmodels. IEEE Trans. Systems,
Man, and Cybernetics, 15:298–303.
Cross, G. and Jain, A. (1983). Markov random field texture
models. IEEE Trans. Pattern Analysis and Machine
Intelligence, 5:25–39.
Cula, O. and Dana, K. J. (2004). 3d texture recognition
using bidirectional feature histograms. International
Journal of Computer Vision, 59:33–60.
Dong, J. and Chantler, M. J. (2005). Capture and synthesis
of 3d surface texture. International Journal of Com-
puter Vision, 62:177–194.
Duda, R., P.E., H., and D.G., S. (2001). Pattern Classifica-
tion. John Wiley and Sons, Inc.
Haralick, R. M., Shanmugam, K., and Dinstein, I. (1973).
Textural features for image classification. IEEE Trans.
on Systems, Man, and Cyberneticcs, SMC-3:610–621.
Leung, T. and Malik, J. (1999). Recognising surfaces using
three-dimensional textons. In ICCV99, pages 1010–
1017.
Leung, T. and Malik, J. (2001). Representing and recog-
nizing the visual appearance of materials using three-
dimensional textons. International Journal of Com-
puter Vision, 43:29–44.
Li, S. Z. (1995). Markov random field modeling in computer
vision. Springer-Verlag, London, UK.
Mark, M. and Wengs, M. (2006). Introducing a new (free-
ware) tool for Palynology. Journal of Biogeography.
(In Press).
Varma, M. and Zisserman, A. (2004). A statistical approach
to texture classification from single images. Interna-
tional Journal of Computer Vision, 62:61–81.
Zhu, S. C., en Guo, C., Wang, Y., and Xu, Z. (2005). What
are textons? International Journal of Computer Vi-
sion, 62(1-2):121–143.
VISAPP 2006 - IMAGE UNDERSTANDING
18
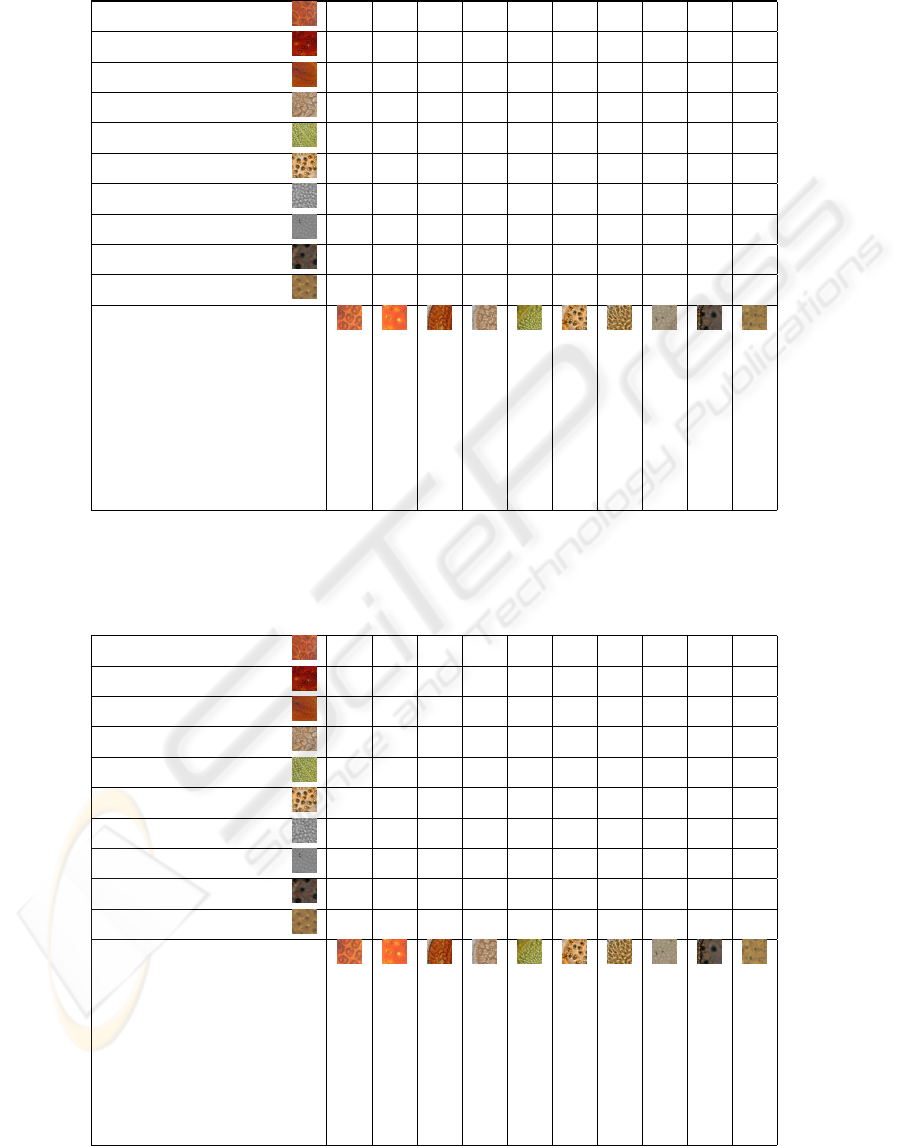
Table 4: Classification Percentage Matrix for Pollen Texture (Texton Co-occurrence).
Jacobina macedoana .9 0 .1 0 0 0 0 0 0 0
Louteridium donnelsmithii 0 .6 0 0 0 0 0 0 .4 0
Pachystachys lutea .1 .1 .8 0 0 0 0 0 0 0
Ruellia graecizans 0 0 0 .4 .3 0 .3 0 0 0
Tricanthera gigantea 0 0 0 .2 .8 0 0 0 0 0
Prenanthes alba .3 0 0 0 0 .7 0 0 0 0
Aleurites moluccana 0 0 0 0 0 0 1 0 0 0
Bocconia frutesens 0 0 0 0 0 0 0 1 0 0
Robinsonella mirandae 0 0 .1 0 0 0 0 0 .9 0
Kochia scoparia 0 0 0 0 0 0 0 0 0 1
Jacobina macedoana
Louteridium donnelsmithii
Pachystachys lutea
Ruellia graecizans
Tricanthera gigantea
Prenanthes alba
Aleurites moluccana
Bocconia frutesens
Robinsonella mirandae
Kochia scoparia
Table 5: Classification Percentage Matrix for Pollen Textures (Texton Frequency Histogram).
Jacobina macedoana .8 0 .0 .2 0 0 0 0 0 0
Louteridium donnelsmithii 0 .5 0 0 0 0 0 0 .4 .1
Pachystachys lutea 0 0 .7 .2 0 0 0 0 .1 0
Ruellia graecizans 0 0 0 .6 0 0 .4 0 0 0
Tricanthera gigantea 0 0 0 .5 .5 0 0 0 0 0
Prenanthes alba .1 0 0 .2 0 .7 0 0 0 0
Aleurites moluccana 0 0 0 0 .2 0 .8 0 0 0
Bocconia frutesens 0 0 0 0 0 0 0 .9 0 .1
Robinsonella mirandae 0 0 .4 0 0 0 0 0 .6 0
Kochia scoparia 0 .2 0 0 0 0 0 0 0 .8
Jacobina macedoana
Louteridium donnelsmithii
Pachystachys lutea
Ruellia graecizans
Tricanthera gigantea
Prenanthes alba
Aleurites moluccana
Bocconia frutesens
Robinsonella mirandae
Kochia scoparia
SPATIAL STATISTICS OF TEXTONS
19
