
INTERACTIVE MEDIA AND DESIGN EDITING FOR
LIVE VISUALS APPLICATIONS
Pascal M
¨
uller
Computer Vision Lab, ETH Z
¨
urich
Simon Schubiger-Banz
Swisscom Innovations
Stefan M
¨
uller Arisona
Computer Systems Institute, ETH Z
¨
urich
Matthias Specht
Anthropological Institute, University of Z
¨
urich
Keywords:
Interactive Content Creation, Authoring Systems, Design Computation, Interaction Techniques, Live Visuals.
Abstract:
This paper describes novel concepts for the interactive composition of artistic real-time graphics, so-called
live visuals. By establishing two fundamental techniques dealing with the structured media integration and the
intrinsic design process, we significantly increase the efficiency of in teractive editing in live visuals applica-
tions. First, we present a media manager that supports the user in both retrieval and utilization of automatically
annotated digital media. The computer-assisted application of individual media items permits the interactive
control of non-linear editing (NLE) of video in real-time. Second, we optimize the design process by introduc-
ing the design tree, which collects and organizes the artist’s work in an intuitive way. Design tree operations
provide interactive high-level editing methods which allow for exploration, combination, reuse, and evolution
of designs before and particularly during the performance. We examined the effectiveness of our techniques
on numerous long-lasting live performances from which representative examples are demonstrated.
1 INTRODUCTION
From the very beginning, interactive graphics sys-
tems have been used for creating art (Sutherland,
1963). They have fascinated and deeply influenced
visual performance artists who would eventually re-
place analog video mixing and effect consoles in fa-
vor of computer systems. Among other movements,
“VJing”, referring to Video Jockeys (VJs) who com-
pose live visuals at electronic dance music events, is
recently becoming increasingly popular. An excerpt
from a typical live visuals performance is illustrated
in Figure 1. Performing such artistic real-time graph-
ics live results in a tremendous need for state-of-the-
art hardware and software systems. Today’s systems
virtually satisfy these needs in terms of performance
and real-time processing. However, existing software
tools mostly ignore the artistic design process be-
fore, and particularly during the performance. Fur-
thermore, they don’t support the user in dealing with
large media libraries or in applying individual media
items in an “intelligent” manner. Hence, this work
presents novel approaches to the issues of media uti-
lization and interactive designing in live visuals appli-
cations.
First, we present a media manager, which supports
the live visuals artist in retrieval and utilization of
digital media based on annotated metadata. Using
well-known computer vision methods, we automati-
cally augment video clips with metadata by reverse-
engineering their original shot list. Besides enabling
efficient media retrieval, the metadata permits the me-
dia manager to assist interactive non-linear editing
(NLE) of video in real-time. A video clip’s individ-
ual shots are restructured in a “non-linear” style by
the live visuals system. For example, shots are re-
arranged in order to fit musical features extracted in
real-time. Hence, Eisenstein’s vertical montage the-
ory on the articulation of film and soundtrack (Eisen-
stein, 1994) can be approached in a live context using
annotated media files and real-time audio analysis.
The second contribution addresses the problem of
232
Müller P., Schubiger-Banz S., Müller Arisona S. and Specht M. (2006).
INTERACTIVE MEDIA AND DESIGN EDITING FOR LIVE VISUALS APPLICATIONS.
In Proceedings of the First International Conference on Computer Graphics Theory and Applications, pages 232-242
DOI: 10.5220/0001358502320242
Copyright
c
SciTePress

Figure 1: Real-time graphics composed live by a performing artist. The snapshot sequence represents a 5 minute excerpt from
a typical live performance consisting of abstract imagery, video loops, font layouts and a live video stream.
how artwork is dealt with during live performance.
Rather than forcing the artist to fit into a fixed “prepa-
ration vs. performance” scheme, we provide mecha-
nisms that give the artist freedom on which level in-
dividual design goals are placed. We introduce the
high level concept of the design tree, which stores
and organizes the artist’s designs. The tree’s nodes,
representing individual designs, emerge by interactive
composition or reuse during preparation, or as results
of live composition during performance. Designs are
“activated” (i.e., rendered) by selecting one or mul-
tiple design nodes. The series of activated designs
results in a design path (Simon, 1996), representing a
temporal plot of the actual performance. In order to
allow for smooth transition between different designs,
we provide a number of design tree operations, such
as merging or mixing design nodes.
The paper starts by briefly discussing relevant re-
lated work. Section 3 provides an overview of a typ-
ical live visuals system and how the media manager
and the design tree have been integrated. In Section
4 and Section 5 the main contributions listed above
are presented in detail. Section 6 will show how the
actual implementations of the media manager and the
design tree are used to create effective live visuals.
The paper concludes with final remarks in Section 7.
2 RELATED WORK
There is a wide range of existing software tools for
creating live visuals. With the growing popularity
of VJing, a large number of custom tools evolved (a
comprehensive listing is found at (VJCentral, 2005)).
Many of them resemble a digital counterpart of ana-
log video mixers, where multiple video sources can be
mixed and overlaid with visual effects. Others pick up
the video mixing concept, but add features for digital
compositing or rendering of arbitrary geometry, go-
ing far beyond the possibilities of analog video mix-
ing (GarageCube, 2005). While most of these tools do
a great job and are typically easy to use, their lack of
generality imposes a major problem for visual artists
that wish to go beyond predefined designs and with-
out carrying a “footprint” of the software they were
created with. Therefore, at the other end of the spec-
trum, applications with a general approach to creating
live visuals (and often music as well) exist. They give
a lot more freedom to the artist, but at the same time
typically require at least some programming and sig-
nal processing knowledge. Two examples are Max,
which has its origins in music and audio processing,
and Touch, which roots in computer graphics model-
ing and animation.
Max (Pukette, 2002), and in particular Max/MSP
and Jitter, represents a family of graphical program-
ming environments. Max has become the de facto
standard for many sound and visual artists. By ap-
plying the graphical programming paradigm objects
of different types are interconnected to build patches.
The patches represent a running program, and they as
well serve as the user interface for interactive control.
Therefore a programmer can create a “performing in-
strument”, which can be used without programming
skills. However, Max lacks means of organizing mul-
tiple patches beyond file system browsing or copy and
paste. Thus, it is very hard creating several hours of
visuals performance where a large number of differ-
ing designs is seamlessly arranged and mixed.
Derivative’s Touch (its ancestor, Houdini was used
to realize an interactive dance floor at the SIGGRAPH
98 Interactive Dance Club event (Ulyate and Biancia-
rdi, 2002)) approaches the above problem by provid-
ing different environments for different levels of inter-
action: Visual synthesizers can be designed in Touch
Designer, they can be mixed in Touch Mixer, or just
played in Touch Player. At every level, the visual
artist can interact (i.e., perform) in real-time.
In our work, the design tree navigation and ma-
nipulation methods act as the central means of de-
sign creation and modification. There is no distinc-
tion between preparation and performance, and our
work emphasizes the actual “live design process” of a
visual performance. This scheme not only addresses
the mixing issues of long performances, it goes a step
further and allows for true interpolation of different
designs.
Another important task when compositing live vi-
suals is the application of prepared media files. Al-
though interactive retrieval and annotation systems
have been available for some time (e.g., (Tseng et al.,
2002)), to our knowledge there exists no live visuals
tool with an integrated media manager that incorpo-
rates metadata such as MPEG-7 annotations (Manju-
nath et al., 2002), making our solution a novelty in
this area.
INTERACTIVE MEDIA AND DESIGN EDITING FOR LIVE VISUALS APPLICATIONS
233
Audio analysis has been used for controlling and
aligning visual parameters in a scene graph (Wagner
and Carroll, 2001), as well as together with video seg-
mentation methods (Lienhard, 1999; Rui et al., 1999)
for automatic or semi-automatic alignment of music
and video in interactive offline systems (Foote et al.,
2002) and in non-interactive real-time systems (Jehan
et al., 2003).
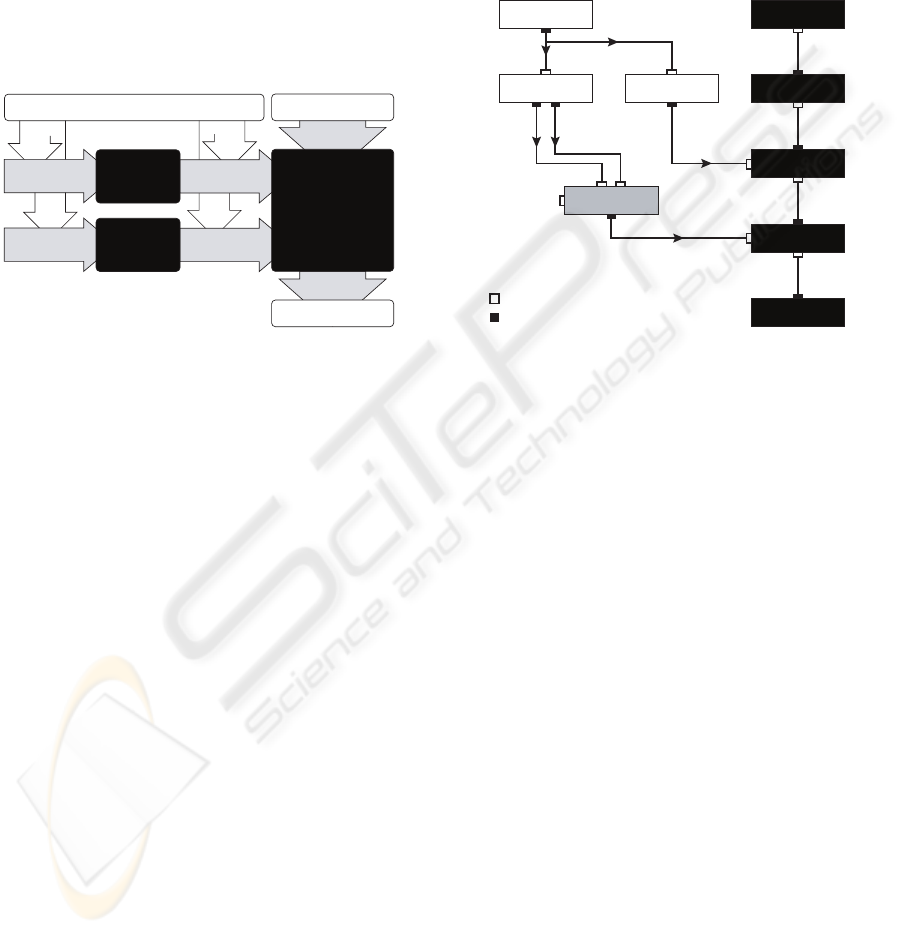
3 SYSTEM OVERVIEW
Capture
Artist (via Graphical Management Console)
Design
Tree
Media
Manager
Output Images
Media Item
Assignment
State
Manipulation
Render
Processing Graph
Audio Input
Annotation &
Retrieval
High-Level
Editing
Real-time
Rendering
Engine
Figure 2: Overview of the SOUNDIUM system. Our
two contributions, the design tree and the media manager
(left), increase the efficiency of existing live visuals systems
(right).
From a system architecture viewpoint, the common
denominator of existing tools for live visuals is real-
time rendering engine, which is controlled by a user
interface. More specifically, the user interface can
manipulate a processing graph, which is processed
by the rendering engine. The produced output im-
ages are typically directed to a preview monitor and
one or multiple video projections. In our work, this
set-up is enhanced by a media manager and the de-
sign tree. The system illustrated in Figure 2 has
been implemented in a proprietary live visuals sys-
tem called SOUNDIUM. Implementation details haven
been given in (Schubiger and M
¨
uller, 2003). For the
remainder of this section we shall focus on concepts
that are essential for understanding the functionality
of the media manager and the design tree.
The processing graph is a directed graph of inter-
connected processing nodes, whereof each of them
fulfills a certain purpose such as performing a 3D
transformation, drawing a polygon, or calculating an
audio signal level. Each processing node consists
of a number of input and output ports, which are
used for communication. The edges of the graph, in-
terconnecting inputs and outputs, are called connec-
tions. With the processing graph, audio signal flow
processing can be modeled as well as the hierarchical
structures describing visual objects and their relations
within a 3D world (similar to the well-known scene
graph concept (Strauss and Carey, 1992)). Internally,
the processing graph is stored as a sequence of SL2
statements. SL2 is an assembler-like scripting lan-
guage designed for graph manipulation. Because of
its simplicity, this textual representation is well suited
for refactoring methods carried out by high-level de-
sign operations in Section 5.
AudioIn
Beat Level
Viewport
Camera
Transform1
Transform2
Sphere
Curve
Child
Parent
Child
Parent
Child
Scale.X
Tanslate.Y
ControlPoints
Input Port
Output Port
Audio Audio
Audio
Trigger
Trigger
Duration Level
Duration
Parent
Child
Parent
Figure 3: Simple processing graph example which repre-
sents an animated sphere driven by audio. White colored
nodes depict the audio signal flow and black nodes repre-
sent the 3D scene graph. Additionally, an animation curve
node is illustrated in grey.
A simple example is illustrated in Figure 3. The
scene graph consists of a viewport, a camera, two
transformations, and a node that draws a sphere. Si-
multaneously, the incoming audio is captured and
processed, and the output of the level node is con-
nected to the Scale.X input port of the first transfor-
mation node. The beat extrapolation node controls an
animation curve node, effectively setting the duration
of the curve to the beat duration, and restarting the
curve with every beat trigger. Finally, the curve out-
put is connected to the Translate.Y input of the second
transformation. Typically, only a few of all available
input ports are connected. An example is the curve
nodes’ ControlPoints input (all others have been omit-
ted for simplicity). These ports are available for ex-
ternal value assignment by the user interface.
To align visual content to music features, real-
time audio analysis is needed to extract the latter.
In SOUNDIUM, audio analysis methods are realized
in terms of processing nodes. Currently, the system
provides methods for spectral analysis, beat and on-
set detection (Scheirer, 1998; Goto, 2001; Brossier
et al., 2004), and part detection (e.g., refrains) based
on similarity analysis of the signal’s spectral composi-
tion (Foote et al., 2002). Typically, the audio analysis
nodes deliver continuous parameters, such as spectral
GRAPP 2006 - COMPUTER GRAPHICS THEORY AND APPLICATIONS
234
levels or distributions, and discrete parameters, such
as note onset triggers. How the parameters are con-
nected to visual content is an artistic choice. How-
ever, SOUNDIUM supports the artist with a number of
methods for the manipulation of audio analysis results
in order to allow a better match to practical artistic
goals, e.g., by providing dedicated processing nodes
for modifying extracted rhythmical structures. Hence,
manifold correlations between rhythm and visual con-
tent can be created.
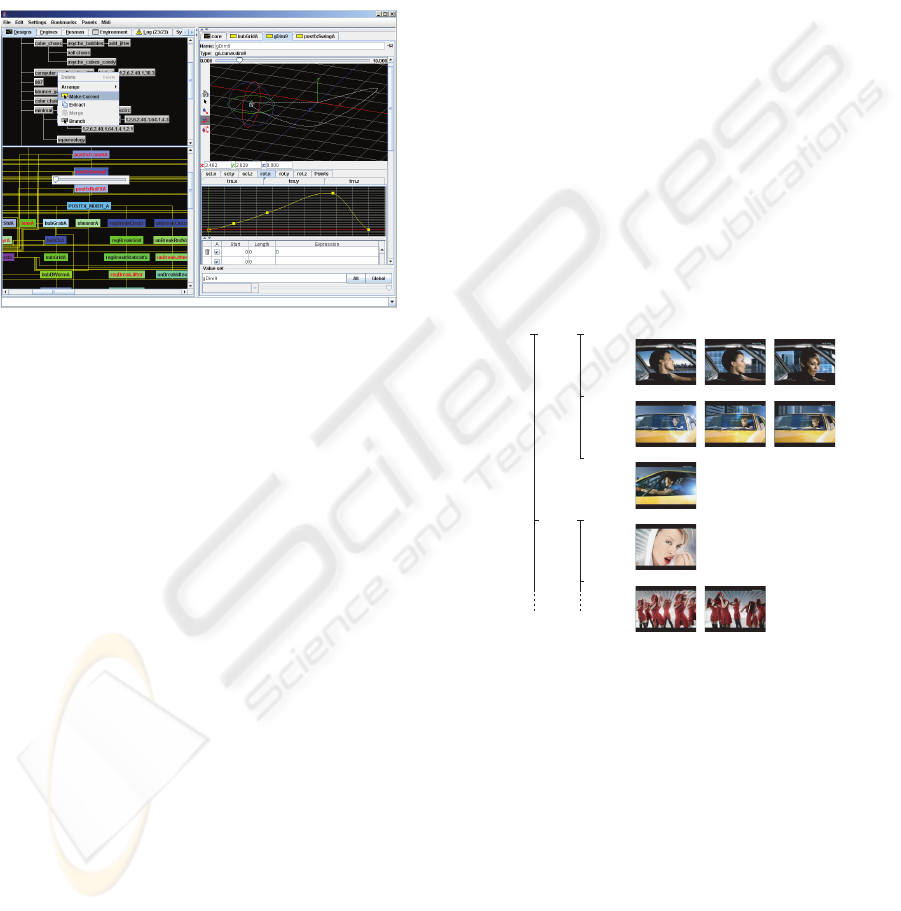
Figure 4: Screenshot of the graphical management console.
Top left: Design tree which permits high-level editing. Bot-
tom left: Processing graph representing the current system
state. Right: Node inspector for modification of a selected
processing node.
SOUNDIUM includes a graphical management con-
sole where interaction between the performer and the
system takes place (see Figure 4). The main task of
the management console is to maintain the current
system state and consistent views of it. In addition,
interactive state modification, high-level design ma-
nipulations, and media management takes also place
through the console. The SOUNDIUM system state
is represented as a highlighted node in the design tree
(Figure 4, top left). This design node has an expanded
view as a processing graph (Figure 4, bottom left).
Not shown in Figure 4 are the design’s textual rep-
resentation (SL2) and its visual rendering. Modifica-
tions can simultaneously take place through a node in-
spector (see Figure 4, right) or connected MIDI con-
trollers. Changes are reflected in all views immedi-
ately. The management console is non-modal, en-
abling direct access to every object and follows stan-
dard interface conventions as well as a minimalist ap-
proach for easier learning. Several accelerators and
shortcuts ensure a high degree of interactivity for the
experienced user. Because error states are fatal dur-
ing a live performance, modifications are statically
checked against boundary conditions and type safety
(e.g. input and output port types) before being applied
to the system state. Such errors will lead to an invalid
design which is signaled to the user without interrupt-
ing the performance.
4 THE MEDIA MANAGER
A typical media library of a live visuals artist contains
several gigabytes of pictures, video footage, geomet-
ric models, and so on. Hence, an efficient media
manager is needed to allow for quick interactive ac-
cess, which is crucial during live performance. In
SOUNDIUM, the media manager extracts metadata
in a “pre-production” phase by automatically scan-
ning media files according to their type. In addi-
tion, the media manager supports manual annotation
of media files (e.g., for semantic content descriptions
which cannot be acquired automatically). The re-
sulting metadata is stored in XML format based on
the MPEG-7 description standard (Manjunath et al.,
2002). The digital library with its incorporated meta-
data can be accessed by using fast and intuitive high-
level retrieval mechanisms. The media manager’s
GUI is embedded in the graphical management con-
sole.
Video Scene 1
Scene 2
Group 1:
Group 2:
Group 4:
Group 5:
Group 3:
Shot 1
Shot 2
Shot 3 Shot 5
Shot 4
Shot 9
Shot 10 Shot 12
Shot 6
Shot 7
Figure 5: The hierarchical structure of a video clip reverse-
engineered by the media manager (schematic view).
4.1 Video Clip Integration
Since most live visual performances include video
footage, the video clip is the most important me-
dia type a visual artist is working with. Tradition-
ally, footage is prepared manually using video edit-
ing tools, which is a very time consuming task. Our
approach employs automatic methods, which consid-
erably facilitate dealing with footage and reduce time
consuming manual tasks to a minimum: The media
manager analyzes the unedited footage using video
segmentation techniques for shot boundary detection
(Lienhard, 1999) and video abstracting techniques for
INTERACTIVE MEDIA AND DESIGN EDITING FOR LIVE VISUALS APPLICATIONS
235

scene determination (Rui et al., 1999). The latter or-
ganizes the clip into scenes, groups and shots. Thus,
a video clip is comprised of several scenes contain-
ing several groups, and a group itself consists of all
visually similar shots within a scene (Figure 5). As
a side effect of the scene determination algorithm,
shots can be ordered within a group according to
their group distance measure. This results in a mea-
sure for a group’s “best” shot, which the visual artist
will most likely use during performance. Further-
more, the media manager analyzes the motion of each
shot, which results in a camera movement classifica-
tion (pan/tilt/zoom/roll), and extracts the representa-
tive keyframes of each shot, which can be used for
browsing. If desired, the user can modify the auto-
matically generated video clip structure (e.g., by man-
ually changing shot boundaries) and add content de-
scriptions. For storage, the clip’s source file is not
modified, all editing information is stored exclusively
in the metadata. Thus, the original clip is kept ap-
plicable to all kinds of scenarios.
For browsing video clips, the user has the choice of
a temporal or a structural view. Particularly, the struc-
tural view gives an intuitive overview of the video
clip. If the user selects a shot and its destination
(i.e., a dedicated input port of a processing node),
the media manager streams the corresponding frames
to the rendering engine. In order to avoid long seek
times within a video clip, each clip is encoded with
keyframes at shot boundaries after the preparation
phase. If requested, the engine caches the frames,
which will remain available for random access later
on.
4.2 Interactive Non-Linear Editing
Besides better retrieval capabilities, the extracted
metadata of clips allows for a new form of video
footage utilization: Interactive NLE of video, i.e., the
(semi-)automatic rearrangement of a video clip’s in-
dividual shots in real-time. In order to align live visu-
als to music, our approach applies film music theory
in the reverse direction: The most popular film music
procedure is to conduct the music according to given
visual action points of a completely finished movie
(Gorbmann, 1987). A visual action point is usually
associated with a classical film cut, but it can also
be within a continuous shot (e.g., the beginning of
a pan) or refer to arbitrary types of dramatic events.
In our case, visual action points have to be created
in real-time for given “musical action points” result-
ing from audio analysis, for example extracted bar or
beat borders may enforce cuts. Following these rules,
the (short) clips of the dancers in Figure 1 have been
synchronized to the incoming beat and extrapolated
beat-durations by non-linearly stretching the clips be-
tween two beat boundaries.
In SOUNDIUM, the generation of visual action
points is realized in terms of dedicated process-
ing nodes for computer-assisted NLE. During per-
formance, the user has interactive control over the
selection of video footage and the node’s configu-
ration parameters. For instance, the user can as-
sign a whole video scene or multiple groups to the
NLE node, or tune editing parameters such as “cuts
per second”. The node then analyzes the associated
metadata and – according to its configuration – de-
cides which shots finally should be played, and how
fast and for how long. SOUNDIUM includes NLE
processing nodes implementing different editing tech-
niques (Eisenstein, 1994) ranging from the function-
ality given above (simulating visual action points) to
completely audio-independent editing.
5 THE DESIGN TREE
In our case, a design is a complete description of the
processing graph, including its nodes, value vectors,
and edges. On a more abstract level, a design directly
reflects the realization of an artistic idea. The artist’s
designs are stored in the design tree, a hierarchical
data structure, where each node contains information
about how the processing graph is to be modified in
order to realize a design. Changes to the system state
(by using the graphical management console) result in
modification of the processing graph and, if desired,
also in new nodes in the design tree.
5.1 Realization
In its simplest form, the design tree can be seen as a
multilevel undo/redo facility: All user actions manip-
ulating the system state are recorded and can be un-
done. These state manipulations are recorded as SL2
statements representing individual processing graph
changes. The user can decide to commit a design to
the design tree, where a new design node is created.
When a design is committed, the minimal sequence of
SL2 statements yielding the system state is computed
and called the normal form of a design node.
During the design process, several design nodes are
committed by the user in sequence with each node
representing a revision of a previous design (Figure 6-
b/c). This is similar to a file versioning system (Ced-
erqvist, 1993) that stores differences from one revi-
sion of a file to the next. Like in a versioning system,
the user can go back to any previous design (Figure
6-d) and start a new branch (Figure 6-e), exploring a
variant of a design. Thus, branching transforms the
linear sequence of designs into a tree.
A natural ordering of nodes by time (revisions)
takes place during the design process. However, this
GRAPP 2006 - COMPUTER GRAPHICS THEORY AND APPLICATIONS
236
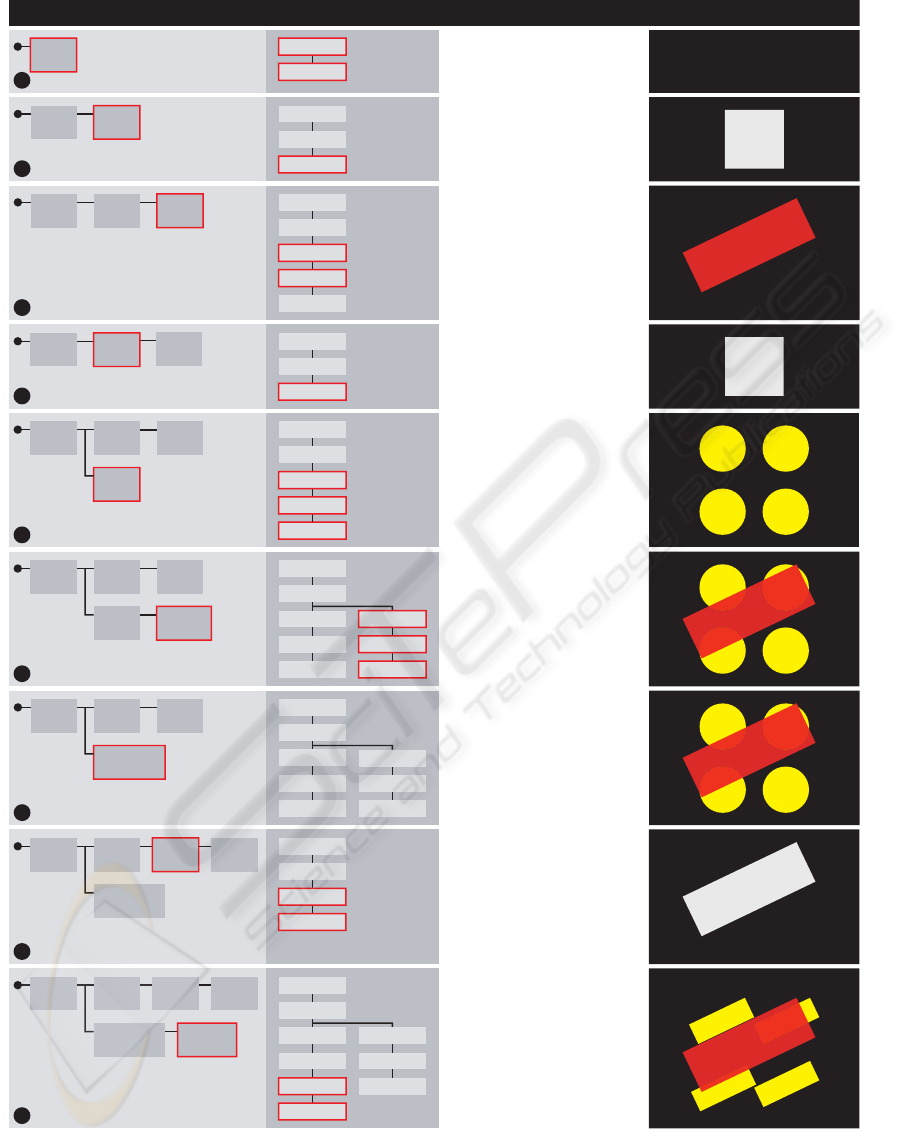
Design Tree Processing Graph Operation Output
Scene
1.1
Camera
Viewport
Initial Design
Consists of a Camera and Viewport
node. Nothing visible.
Adding a Design
A unit quad is attached to the
Viewport. Commiting the changes
results in a new design node
named Quad
.
Scene
1.1
Quad
1.2
Camera
Viewport
Quad
Modifying a Design
Two new processing nodes
(Transform and Color) are inserted
into the processing graph.
Commiting the changes results in
a design node CQuad.
Scene
1.1
CQuad
1.3
CQuad
1.3
Quad
1.2
Camera
Viewport
Quad
Transform
Color
Scene
1.1
Camera
Viewport
Disk
Fusing Design Nodes
The designs CDisk and +CQuad are
fused to a new design CDiskQuad.
The processing graph remains
unchanged.
Grid
Color
Quad
1.2
Scene
1.1
Camera
Viewport
Disk
Branching
The artist decides to deactivate
the design CQuad and create a
new design CDisk. A branch is
automatically created.
Grid
Color
Quad
1.2
CDisk
1.2.1
Scene
1.1
Camera
Viewport
Disk
Merging Designs
The design CQuad is extracted and
merged with CDisk, resulting in a
design +CQuad. The output now
consists of CQuad and CDisk. Name
conflicts (Color to Color1) are
automatically resolved.
Grid
Color
Quad
1.2
+CQuad
1.2.2
CDisk
1.2.1
CDiskQuad
1.2.1
Quad
Transform
Color1
Quad
Transform
Color1
a
b
Scene
1.1
Camera
Viewport
Reverting to a Previous Design
By activating Quad again, the
previous changes are undone. At
the same time, CQuad remains
available for future use.
Quad
1.2
Quad
d
c
g
Scene
1.1
Splitting Design Nodes
The design CQuad is split into
TQuad, containing only the
transformation part, and CQuad,
containing the color part of the
original design. Requires user
intervention.
Transform
CDiskQuad
1.2.1
h
Scene
1.1
Design Insertion
The Disk node of CDiskQuad is
replaced with extracted Quad and
Transform nodes of TQuad,
resulting in a design mix *CQuads.
Requires user intervention.
Quad
1.2
TQuad
1.3
CQuad
1.4
Quad
1.2
TQuad
1.3
CQuad
1.4
i
e
f
CQuad
1.3
CQuad
1.3
CQuad
1.3
CDiskQuad
1.2.1
*CQuads
1.2.2
Quad
Viewport
Camera
Camera
Viewport
Grid
Color
Quad
Transform
Color1
Quad1
Transform1
Figure 6: Design tree operations (rows) and their effects on the processing graph. The framed boxes in the design tree column
refer to the currently active design node. The framed boxes in the processing graph column indicate changes evoked by
activating the corresponding design node.
INTERACTIVE MEDIA AND DESIGN EDITING FOR LIVE VISUALS APPLICATIONS
237

order has usually little importance for the final set
of designs the artist wants to use during a perfor-
mance. Furthermore, not every revision is necessarily
a new design (Ramakrishnan and Ram, 1996). Hence,
a number of high-level design operations acting on
multiple design nodes complete design tree naviga-
tion and branching:
Node merging allows the user to combine arbi-
trary existing designs while automatically resolv-
ing identifier conflicts when nodes are merged (Fig-
ure 6-f).
Node fusion allows the user to unify two subsequent
design nodes (Figure 6-g).
Node splitting allows the user to subdivide an exist-
ing design node (Figure 6-h). User intervention is
required to inform the system how the design split
has to be performed.
Module extraction encapsulates a subgraph of the
processing graph in a module. Extracted modules
are available for design insertion. User intervention
is required for subgraph selection.
Design insertion allows the user to replace a
processing node with a extracted module (Fig-
ure 6-i). Whereas node merging unifies two de-
signs, design insertion changes a design by replac-
ing a processing node by one or more process-
ing nodes and connections. User intervention is
required for module and processing node selec-
tion. The system proposes a default reconnect-
ing scheme (e.g., maintaining parent-child relation-
ships for scene graph connections) that can be in-
teractively adapted.
SL2 identifier renaming is an interactive method to
change names of design nodes and processing
nodes. Explicit renaming is typically required af-
ter automatic name resolution of merge operations.
These high-level operations are implemented by
refactoring methods, as known from software en-
gineering (Fowler, 1999) applied to the SL2 code
representing a design. Unlike file versioning sys-
tems, where every revision is considered immutable,
the refactoring methods may change arbitrary design
nodes in the tree. The operations are invoked by user
interface actions.
5.2 System State Parameterization
The system does not distinguish between preparation
and performance mode. However, structural changes
to the processing graph, such as adding and remov-
ing processing nodes and connections are typically
more frequent during preparation. In contrast, para-
metrical changes, i.e., assignment of values to input
ports, are more common during performance. Chang-
ing multiple parameter of a design imposes a problem
when switching designs during performance: Strictly
following the undo/redo philosophy, all parameter
changes will be reverted when deactivating a design
node and visually important aspects of an artwork
may abruptly change (e.g. motion or color).
In order to maintain visual consistency, the para-
meter spaces of SOUNDIUM may be treated orthog-
onal to the structural space consisting of processing
nodes and connections. This is achieved by weighted
parameter vectors called valuesets, whose scope can
span multiple design nodes. Valuesets can be defined
at every design node and comprise all or a subset of a
design’s parameters. Since valuesets only contain pa-
rameter changes, they can be applied weighted with
respect to the current system state, and smooth transi-
tions between the current parametrization and the val-
ueset can be achieved. By changing a single weight,
the user can interactively modify a potentially large
number of design parameters at once.
Typical applications of valuesets are global and
high-level properties of an artwork, such as “soft-
ness”, “speed”, or “entropy” that have general pur-
pose application independent of the actual processing
graph.
5.3 The Interactive Design Process
The interactive design process using the design tree
can be split into two major stages: In a preparation
phase, designs are created in terms of an upcoming
performance. During performance, the predefined de-
signs are selected and further modified during the per-
formance. How detailed a performance is prepared
is not technically constrained but rather the artist’s
choice, and often influenced by external factors such
as the performance’s duration.
Yet, a general procedure for preparation is inher-
ent: The tree’s root node generally contains a com-
mon setup, as indicated by the “Scene” node (1.1) in
Figure 6. In practice, the setup includes a lot more
than just a camera and a viewport. For instance, full-
scene post effects (e.g., motion blur, glow, masking)
and global transformations (e.g., camera movement)
are typically placed in the root node, or in nodes close
to the tree’s root. In addition, global valuesets (e.g.,
overall scene color modification) are placed at this
point. Consequently, every design deeper in the tree’s
structure will inherit the particular global configura-
tion.
The next step is the definition of the actual de-
signs, which may be re-used and adapted from previ-
ous performances as needed. The design tree supports
the artist in structuring the performance: Designs can
be arranged as needed by creating design variations
(e.g., CQuad is a variation of Quad in Figure 6-c) or
branches containing a different design (CDisk in Fig-
ure 6-e). The arrangement may serve as a temporal
GRAPP 2006 - COMPUTER GRAPHICS THEORY AND APPLICATIONS
238

plot or even as a script during performance, or assist
multiple artists using the same common setup along
with their individual designs.
Because several parameters (e.g., those resulting
from real-time music analysis) are unknown during
the preparation phase, these designs are typically an-
ticipatory – their final visual rendering is partially un-
known and only emerges in function of the environ-
ment during the live performance. This property is
particularly effective for VJ performances that usu-
ally last several hours with musical content that is not
predictable in advance. In addition, anticipatory de-
signs provide enough space for improvisation during
the performance.
Throughout the performance, the artist selects,
fine-tunes, parameterizes, and applies designs,
thereby countervailing the unknown and adding his
perception of the moment. All changes to the system
state (i.e., the processing graph) are tracked and can
be committed to build new design nodes in order to be
reused. Using the refactoring methods presented ear-
lier an interpolation from the current design to a target
design is easily achieved. This powerful mechanisms
implement the idea of a design path (Simon, 1996)
and allow for a carefully adjusted and uninterrupted
performance.
6 RESULTS
SOUNDIUM has been used at numerous live perfor-
mances ranging from large-scale VJ events to video
art performances to interactive multimedia installa-
tions. The system has been evaluated by both novice
visual artists as well as expert computer artists. For
both groups we observed an immediate capability of
using the media manager. On the other hand, getting
accustomed to the design tree required a tutoring time
of a day or two, but then resulting in a steep learn-
ing curve. While the novice artists mainly used the
tree for recalling designs and as a undo/redo facility,
the experts quickly explored the refactoring methods
and used them to create their own designs. This sec-
tion gives concrete examples that were realized inter-
actively using SOUNDIUM.
The first example comprises a typical live perfor-
mance scenario. It illustrates how the design tree and
processing graph operations are applied to quickly
evolve a sphere into an audio-driven “digital dance
floor”. The artist starts by modeling a simple 3D
scene and gradually connecting it to extracted audio
features: A sphere is scaled by the low frequency
levels of the incoming audio signal and moves on
an elliptical orbit, changing its direction on every
bass drum onset (similar to Figure 3). Addition-
ally, the bass drum onsets also change the faces’
filled/wireframe state. The resulting output is shown
in Figure 7 (top row). Now, the performer’s design
goal is to move the camera into the sphere and add a
dance floor including dancers. Since this occurs dur-
ing a live performance, the following steps must be
executed reasonably fast and with the help of a pre-
view output (i.e., intermediate steps are not visible
on the main outputs), which is illustrated in Figure
7 (center row). The dancing girls (Figure 1) are ex-
tracted from the artist’s design tree and merged with
the current design. A “multiple copy” processing
node is inserted to generate a crowd of dancers. The
dance floor consisting of a grid of quads is then mod-
eled from scratch through direct manipulation of the
processing graph. The quads’ colors are defined by
both the audio level and the grid position. Then, the
dance floor and the dancers are transformed to fit into
the sphere. Now, all components are in place and
ready to be successively shown on the main output.
Ultimately, the camera is moved into the sphere and
a set of audio-driven different camera viewing-angles
and transformation speeds is added (Figure 7, bottom
row). Altogether, above steps take the (experienced)
artist about 10 minutes.
The second example illustrates how design opera-
tions (Section 5) are applied for efficient live design
editing. The source design (Figure 8, left) is trans-
formed into a target design, i.e. five cubes represent-
ing the audio spectrum (right). Two possible design
transitions are shown. In both transitions, design in-
sertion has been applied to transfer the target’s back-
ground color to the source design while the source
design’s structural dominance has been gradually re-
duced. Application of the design operations including
user intervention took about 5 minutes for each transi-
tion, provided that source and target design are given
in advance.
In the last example, analyzed video footage has
been rearranged in real-time by interactive NLE: Us-
ing the media manager, the video was automatically
segmented into three scenes consisting of several
shots. Scene 1 consists of five groups of shots show-
ing a woman in blue color tones, scene 2 consists of
two groups showing a close up of a man’s face in dark
color tones, and scene 3 consists of four groups of
the woman and the man waiting for a train. During
performance, the artist matches these three scenes to
three different patterns detected by a dedicated “nov-
elty measure” audio processing node (Foote et al.,
2002). In addition to the computer-assisted alignment
of scenes to music parts, individual shots are non-
linearly stretched in order to fit into beat intervals.
Figure 9 illustrates two bars of music together with
the representative keyframe of the emerging shots (the
difference between musical pattern 2 and 3 is not vis-
ible in the waveform).
INTERACTIVE MEDIA AND DESIGN EDITING FOR LIVE VISUALS APPLICATIONS
239
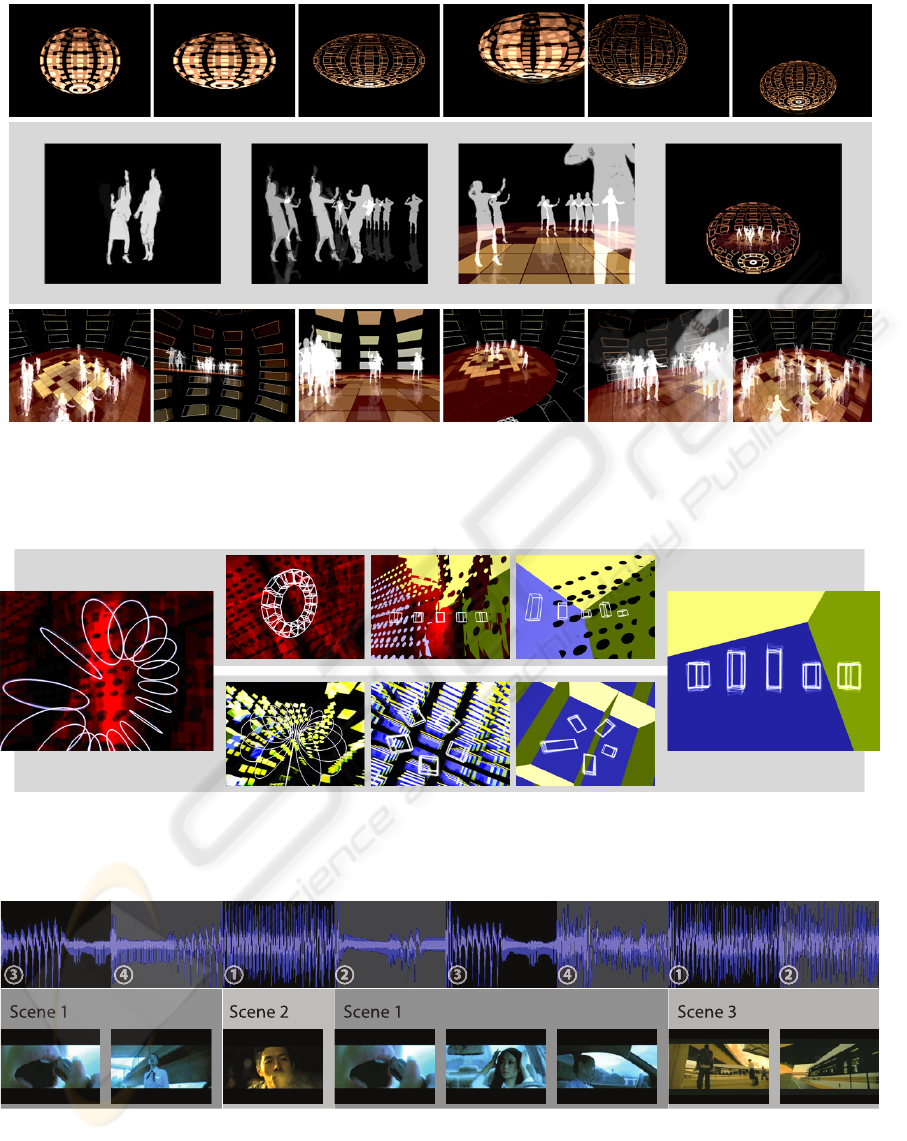
Figure 7: Designing a digital dance floor. The top row shows the current design, visible to the audience on the main output
while the artist prepares the transition into the sphere on the preview output (center row). Eventually the resulting scene is
shown from different camera angles that are switched in context to the music (bottom row).
Figure 8: Design transformation example. The design on the left is transformed into the one on the right by applying design
operations. Two possible alternatives are illustrated.
Figure 9: Interactive real-time video editing example. Different shots of three scenes are aligned to different music parts
using similarity analysis. The individual shots are non-linearly stretched to beat intervals. The beat numbers (4/4 measure)
are denoted on the horizontal axis.
GRAPP 2006 - COMPUTER GRAPHICS THEORY AND APPLICATIONS
240

7 CONCLUSIONS
We presented two novel extensions for live visual per-
formance systems. Together, the contributions raise
live performance to a higher level, allowing the artist
to focus on design and content instead of low level
processing details.
First, the media manager substantially enhances
the way the artist interacts with large media libraries.
Most important, annotated and segmented video clips
together with real-time audio analysis methods can
be used for real-time non-linear video editing during
performance. Although the computer vision meth-
ods applied for video segmentation impose certain
limitations in terms of correctness, they have proven
enormously valuable, and the method of automatic
analysis and manual adjustment is much faster than
manual segmentation. In addition, since we adhere
to the MPEG-7 standard, annotated “ready-for-use”
video footage databases will eventually become avail-
able. Nonetheless, a future work direction is the
implementation of additional vision methods for vi-
sual semantic-based mining and retrieval (e.g., ob-
ject recognition using local features). Interactive NLE
could be facilated by introducing a control gram-
mar (Wonka et al., 2003) to encode editing tech-
niques. Furthermore, interactive video composit-
ing tools could be integrated into SOUNDIUM (Wang
et al., 2005).
Second, the novel concept of the design tree stores
and organizes the visual artist’s designs and acts as
a link between preparation and performance. High
level design operations and refactoring methods sig-
nificantly reduce the time required to create and ma-
nipulate individual designs. They further provide
means of design interpolation and allow for a seam-
less performance. For more intuitive usage and navi-
gation of large design repositories (e.g., thousands of
designs), future work may introduce a semantic-based
annotation model for the design tree.
Both extensions have been implemented as part of
the SOUNDIUM live visuals system. We however be-
lieve that both of them can be applied to other ex-
isting live visuals systems. In view of ever growing
media libraries it is only a matter of time until other
systems must provide a media manager. We further
believe that the design tree, which is a unique and
very general concept per se, is not only suited for
live visuals systems but could be adapted for virtu-
ally any interactive software system, in the simplest
case by just replacing the common one-dimensional
undo/redo mechanism.
Finally, finding an optimal user interaction model
for computer-based live performance certainly re-
mains an attractive direction for future work. In par-
ticular, we focus on live composition and performance
of music and visuals using the same software system.
ACKNOWLEDGMENTS
We thank J
¨
urg Gutknecht and Luc Van Gool of ETH
Z
¨
urich, and Christoph P. E. Zollikofer of University
of Z
¨
urich for supporting our work. Thanks also to
Philippe W
¨
uger, Mortiz Oetiker and David Stadel-
mann for implementing the vision algorithms. This
research was supported in part by the NCCR IM2, by
SNF grant 205321-102024/1, by Swisscom, and by
the mighty Corebounce association.
REFERENCES
Brossier, P., Bello, J. P., and Plumbley, M. D. (2004). Real-
time temporal segmentation of note objects in mu-
sic signals. In Proceedings of the 2004 International
Computer Music Conference. International Computer
Music Association.
Cederqvist, P. (1993). Version Management with CVS.
Signum Support AB.
Eisenstein, S. (1994). Selected Works 2: Towards a Theory
of Montage. British Film Institute. Ed. by Nichael
Glenny and Richard Taylor.
Foote, J., Cooper, M., and Girgensohn, A. (2002). Creating
music videos using automatic media analysis. Proc.
ACM Intl. Conf. on Multimedia, pages 553–560.
Fowler, M. (1999). Refactoring: Improving the Design of
Existing Code. Addison-Wesley Object Technology
Series. Addison-Wesley.
GarageCube (2005). Modul8 real-time video mixing and
compositing software. http://www.garagecube.com.
Gorbmann, C. (1987). Unheard Melodies: Narrative Film
Music. Indiana University Press.
Goto, M. (2001). An audio-based real-time beat tracking
system for music with or without drum sound. Journal
of New Music Research, 30(2):158–171.
Jehan, T., Lew, M., and Vaucelle, C. (2003). Cati
dance: Self-edited, self-synchronized music video. In
GRAPH ’03: Proceedings of the SIGGRAPH 2003
Conference on Sketches & Applications. ACM.
Lienhard, R. (1999). Comparison of automatic shot bound-
ary detection algorithms. In Image and Video Process-
ing VII. Proc. SPIE 3656-29.
Manjunath, B. S., Salembier, P., and Sikora, T. (2002). In-
troduction to MPEG-7: Multimedia Content Descrip-
tion Interface. John Wiley and Sons.
Pukette, M. (2002). Max at seventeen. Computer Music
Journal, 26(4):31–43.
Ramakrishnan, R. and Ram, D. J. (1996). Modeling design
versions. The VLDB Journal, pages 556–566.
Rui, Y., Huang, T. S., and Mehrotra, S. (1999). Construct-
ing table-of-content for videos. ACM Multimedia Sys-
tems, 7(5):359 – 368.
INTERACTIVE MEDIA AND DESIGN EDITING FOR LIVE VISUALS APPLICATIONS
241

Scheirer, E. (1998). Tempo and beat analysis of acoustic
musical signals. J. Acoust. Soc. Am., 103(1):588–601.
Schubiger, S. and M
¨
uller, S. (2003). Soundium2: An in-
teractive multimed ia playground. In Proceedings of
the 2003 International Computer Music Conference.
International Computer Music Association.
Simon, H. A. (1996). The Sciences of the Artificial. MIT
Press.
Strauss, P. S. and Carey, R. (1992). An object-oriented
3D graphics toolkit. In Computer Graphics (Proceed-
ings of SIGGRAPH 92), volume 26, 2, pages 341–349.
ACM.
Sutherland, I. E. (1963). Sketchpad, a Man-Machine
Graphical Communication System. PhD thesis,
Massachusetts Institute of Technology.
Tseng, B. L., Lin, C.-Y., and Smith, J. R. (2002). Video
personalization and summarization system. In Inter-
net Multimedia Management Systems. SPIE Photonics
East.
Ulyate, R. and Bianciardi, D. (2002). The interactive dance
club: Avoiding chaos in a multi-participant environ-
ment. Computer Music Journal, 26(3):40–49.
VJCentral (2005). http://www.vjcentral.com.
Wagner, M. G. and Carroll, S. (2001). Deepwave: Visu-
alizing music with VRML. In VSMM ’01: Proceed-
ings of the Seventh International Conference on Vir-
tual Systems and Multimedia (VSMM’01), page 590.
IEEE Computer Society.
Wang, J., Bhat, P., Colburn, A., Agrawala, M., and Co-
hen, M. (2005). Interactive video cutout. In Proceed-
ings of ACM SIGGRAPH 2005 / ACM Transactions on
Graphics, volume 24, 3, pages 585–594. ACM.
Wonka, P., Wimmer, M., Sillion, F., and Ribarsky, W.
(2003). Instant architecture. In Proceedings of ACM
SIGGRAPH 2003 / ACM Transactions on Graphics,
volume 22, 3, pages 669–677. ACM.
GRAPP 2006 - COMPUTER GRAPHICS THEORY AND APPLICATIONS
242
