
IMAGE MATCHING USING RELATIONAL GRAPH
REPRESENTATION
Lai Chui Yen, Daut Daman, Mohd Shafry Mohd Rahim
Faculty Of Computer Science and Information System, University Technology Malaysia, 81310 Skudai, Johor, Malaysia
Keywords: Image Matching, Structural Description, Graph Matching, Relational Graph, Association Graph, and
Maximal Clique.
Abstract: A stereo matching strategy that involves the usage of structural description from the image is proposed. This
structural matching strategy is to address the problem of image features that undergo occlusion and also the
missing feature situation. The description of the image scene is done by the construction of a relational
graph that described the relationship among image primitives. Consequently, the matching problem is to
match two structural descriptions, which is represented by a relational graph. The matching between these
relational graphs is determined by comparing these structures using graph theory. The best available match
between these relational graphs can be determined by finding the best maximal clique in an association
graph.
1 INTRODUCTION
Image matching is the process of identifying and
establishing the matching between corresponding
positions in the image data, which are cast by the
same physical point in the real scene. It is an
integral part of numerous tasks in computer vision,
such as recovering 3D structure from stereo images
(Ohta, et. al. 1985, Trapp, et. al. 1988, Zhang, et. al.
2001), or from image sequences of moving scene
(Liu, et. al. 1992, Polefeys, 1999). Those
applications may involve different approaches, but
virtually all these works, shared the same basic aim
of image matching. In this paper, we would like to
present an approach that intends to solve the stereo
matching problem, which is to match corresponding
points in the images of the scene to establish a local
triangulation.
Numerous image-matching algorithms have
been proposed, which can roughly be classified into
two categories: the area-based (template) matching
and feature matching. Area-based matching
correlates grey level template as the matching
primitives. In the feature-based approach, salient
image primitives like points or edges are extracted.
Its corresponding features in the other image are
searched by enforcing some constraints and then
finally verified using some similarity scheme. Most
of these feature based matching methods narrow
down the number of possible matches for each
feature by enforcing certain constraints on feasible
matches. Viewing geometry parameters such as
epipolar constraint or analytical constraint control
the searching of matching candidates. These
methods are fast because only a small subset of the
image pixels are used, but may fail if the image
primitives cannot be reliably detected in the images.
Sometimes, feature based method cannot address
well in the problem of occlusion, missing features,
feature extraction, or other similar problem domain.
The approach we propose in this paper aims at
exploiting a structural (graph) matching to
particularly handling the dissimilarity between
image features due to occlusion or missing features.
We first represent the image data as relational graph
and later match using graph matching between these
relational graphs. The best available match between
relational graphs can be determined by finding the
best maximal clique in the association graph.
2 RELATED WORK
In this section, we review some efforts related to the
feature-based matching, focusing on some
commonly used matching constraints. Epipolar
constraint is commonly applied to reduce the search
space for potential matching candidates from two
400
Chui Yen L., Daman D. and Shafry Mohd Rahim M. (2006).
IMAGE MATCHING USING RELATIONAL GRAPH REPRESENTATION.
In Proceedings of the First International Conference on Computer Graphics Theory and Applications, pages 400-406
DOI: 10.5220/0001351704000406
Copyright
c
SciTePress
dimensional to one dimensional (Horaud, et. al.
1989). This epipolar constraint is vital in reducing
ambiguity problems and computation cost. Other
commonly used constraint is similarity constraint, in
which the matching features must have similar or
highly correlated attributes values. Uniqueness or
exclusion constraint is also used as it imposes
restrictions to a given feature in one image; where it
can only be matched with a single feature from the
other image (i.e. one-to-one mapping) (Pla, et. al.
1997). In some cases, after an initial matching, some
procedures are used to remove ambiguous matches
and later propagate other correct match candidates
to its nearby features (Zhang, et. al. 2001, Pla, F., et.
al. 1997, Zhang, et. al. 1992). The feature-based
matching may be integrated with hierarchical or
global matching technique, such as “coarse to fine”
multi-resolution matching strategies (Pla et. al.
1997) and relaxation matching (Strickland, et. al.
1992).
3 RESEARCH METHODOLOGY
3.1 Feature Extraction and Feature
Grouping
Feature extraction is a key step to derive the
structural descriptions of each image to be match. It
is basically comprised of edge detection, edge
thinning and edge linking to form a straight-line
segment. Edge elements are extracted from each
image and later linked or grouped together to form a
line segment. The result of feature extraction gives
the basis to obtain structural descriptions of the
images, which later used to construct relational
graph.
3.2 Construction of the Relational
Graph
There will be a total of two relational graphs that
each constructed from the two stereo images to be
matched. In each relational graph, the feature
extraction image is cast into structural description in
terms of line features (line segments), feature
attributes, and relationships between nearby
features. In relational graph, the set of line features
that resulted from feature extraction may be
represented by a set of nodes and a network of
pointers, where each node represents a line with its
attributes and each pointer represents a relation
between two nearby lines. There can be a variety of
relations to represent with the pointers in relational
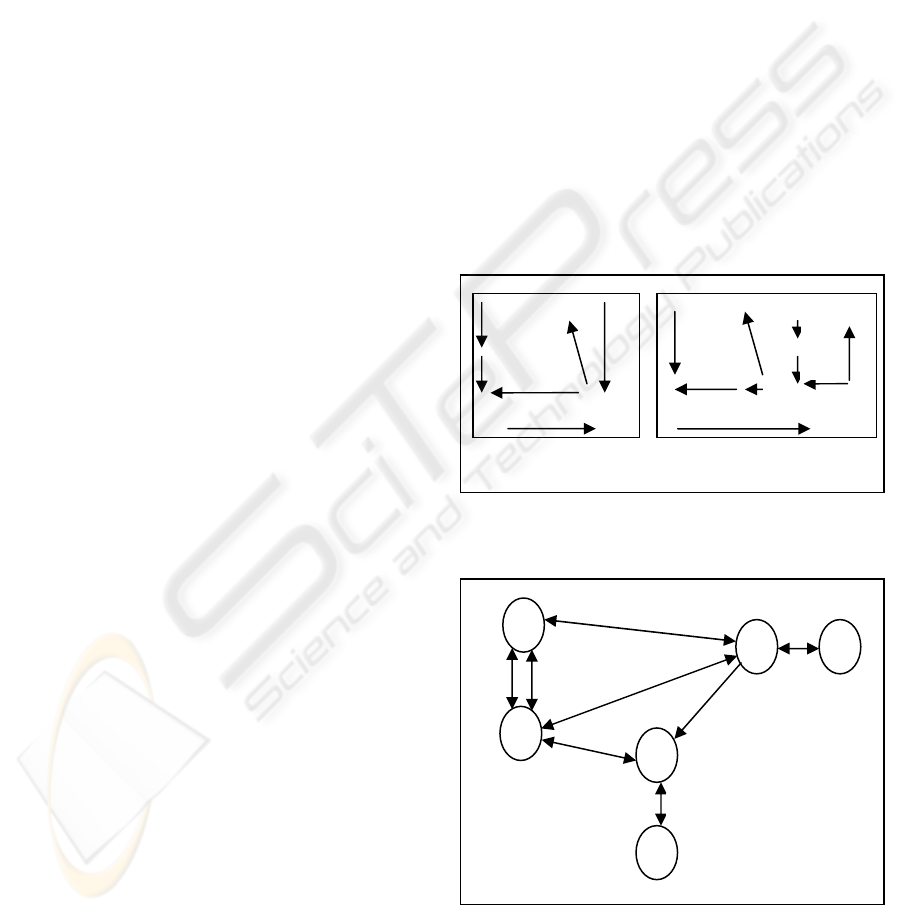
graph (Figure 2).
The construction of relational graph from the
extracted image line features is best showed with the
example in Figure 1 and Figure 2 (Horaud, R, et. al.
1989). Figure 1(a) shows a set of six left image lines
(l
1
– l
6
) and Figure 1(b) shows a set of nine right
image lines (r
a
– r
i
). Whilst, Figure 2(a) and 2(b)
shows the left and right relational graph of the left
and right line structures (Figure 1(a) and (b)),
respectively. Obviously, the left and right line
structures to be matched are not identical
(isomorphic). Part of the left structure, as shown in
Figure 1(a), is occluded. Besides, some lines are
broken into pieces in one image, but not in the other
image. Here, the stereo matching problem between
image features is cast into a double sub-graph
isomorphism problem, where the matching between
two relational graphs that are not identical can be
solved in an association graph (Section 3.3).
Figure 1: Two images to be matched; (a) left structure,
and (b) right structure.
Figure 2(a): left relational graph to be matched; the
represented interline relations are: left of (1), right of (2),
same junction as (3), and collinear with (4).
l
1
l
2
l
6
l
4
l
5
l
3
3
3
3
1
1
1
2
(a) Left relational
graph
4
(a) (b)
l
2
l
1
l
6
l
3
l
4
l
5
r
c
r
e
r
d
r
g
r
h
r
i
r
a
r
b
r
f
IMAGE MATCHING USING RELATIONAL GRAPH REPRESENTATION
401
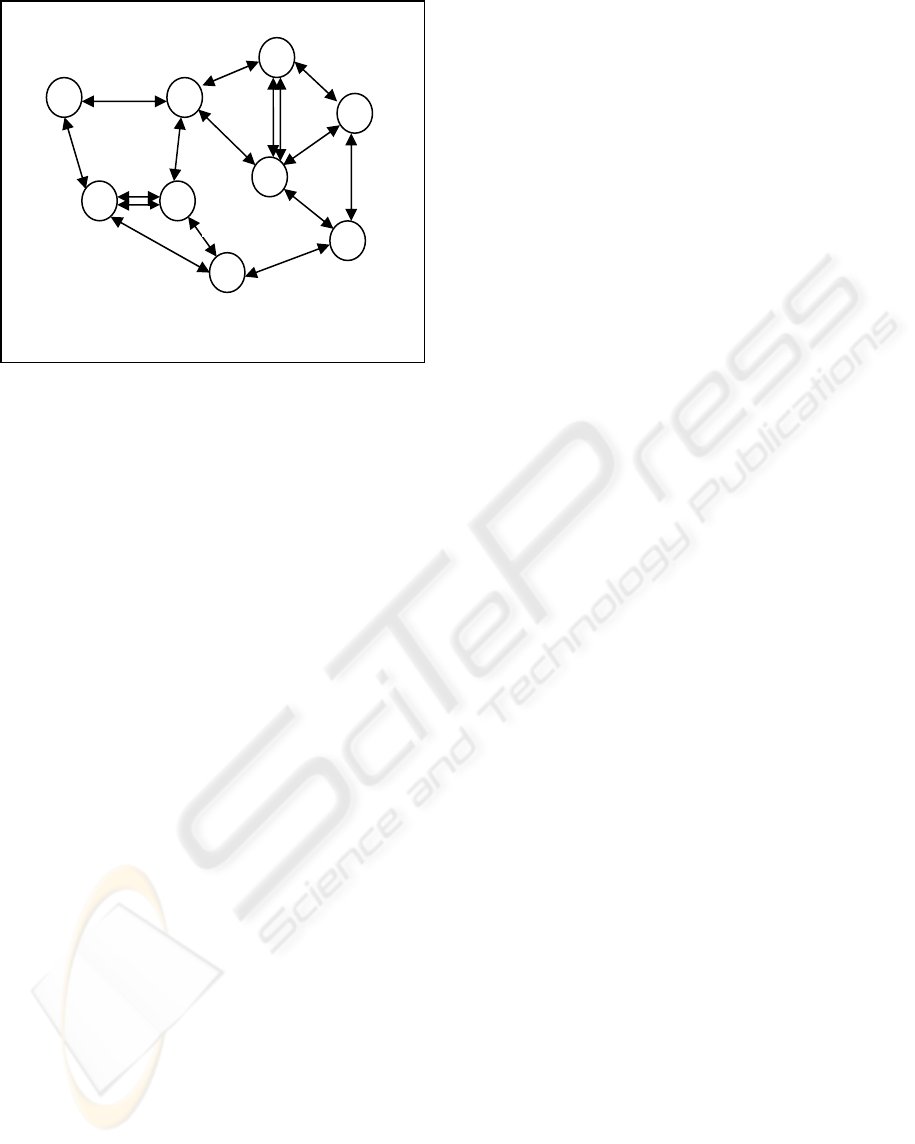
Figure 2(b): right relational graph to be matched; the
represented interline relations are: left of (1), right of (2),
same junction as (3), and collinear with (4).
3.3 Construction of the Association
Graph
To perform the graph matching between the two
relational graphs, an association (correspondence)
graph needs to be constructing from two relational
graphs. The association graph cast the matching
process into a mapping function between the left set
of elements and right set of elements, while
preserves the compatibilities of relations between
features. We take an instance from Figure 1 and
Figure 2, l
1
and l
4
are the
two left features, r
c
and r
e
are
two corresponding right features; while R
14
represents the relation between l
1
and l
4
(i.e. left-of)
and R
ce
represents the relation between r
c
and r
e
(i.e.
left of). The matching is carried out as a mapping
function of left element l
1
to right element r
c
(l
1 →
r
c
)
and of left element l
4
to right element r
e
(l
4 →
r
e
), and
must satisfy some conditions:
(1) The relation R
14
between l
1
and l
4
must
be
compatible with relation R
ce
between r
c
and r
e
,
(2) The mapping is one-to-one, i.e. each feature in
the left image is assigned to a single feature in
the right image.
To satisfy the first condition, we apply an
association graph to search the best available
mapping between the set of left and right elements
while preserves the compatibilities of relations
between features. For second condition, some
geometric constraints such as epipolar constraint to
find a list of potential corresponding features in the
right image for each feature in the left image.
These potential pairs of left-to-right matching,
i.e. the matching between l
1
and r
c
(l
1 →
r
c
) and the
matching between l
4
and
r
e
(l
4 →
r
e
), are then
represented by set of nodes in a association graph
(Figure 3) (Horaud, et. al. 1989). Take an instance
from the example, the matching pair (l
1 →
r
c
) is
represented by node (m
1c
), and the matching pair (l
4
→
r
e
) is represented by node (m
4e
) in the association
graph. As we can see from the association graph
(Figure 3), when the relation R
14
between l
1
and l
4
is
compatible with relation R
ce
between r
c
and r
e
, which
both the relations are the same “left of” relations, an
arc is linked between node (m
1c
) and node (m
4e
). We
called these mutually linked or connected nodes in
the association graph as a maximal clique.
Therefore, in the end of association graph
building process, there will be a number of maximal
cliques which constitute of different combination of
mutually connected nodes, which own compatible
relations among each other (Figure 3). The largest
maximal clique with the largest set of mutually
connected nodes in the association graph will
provide the largest number of feature matching pairs
with compatibility of relations. Hence, the largest
maximal clique can be regarded as the best available
solution of the matching between two stereo images.
In other word, stereo matching becomes equivalent
to searching for the largest set of mutually
compatible nodes or largest maximal clique in this
association graph.
Of course, in practice, a compatible relation is
not necessary in order to indicate the ‘exactly’ same
relations. Relations between two nodes can be
regarded as compatible when it satisfies some
predefined evaluation criteria or rules. Also, in
practice, the largest set of mutually compatible
nodes (largest maximal clique) is not necessary to
give the best solution. Commonly, a cost function is
assigned to each maximal clique and the best
maximal clique is selected based on cost function, in
order to determine the best available match.
r
r
r
r
r
r
r
r
r
3
3
3
3
3
2
1
1
1
4
3
2
1
1
4
1
(b) Right relational
graph
GRAPP 2006 - COMPUTER GRAPHICS THEORY AND APPLICATIONS
402
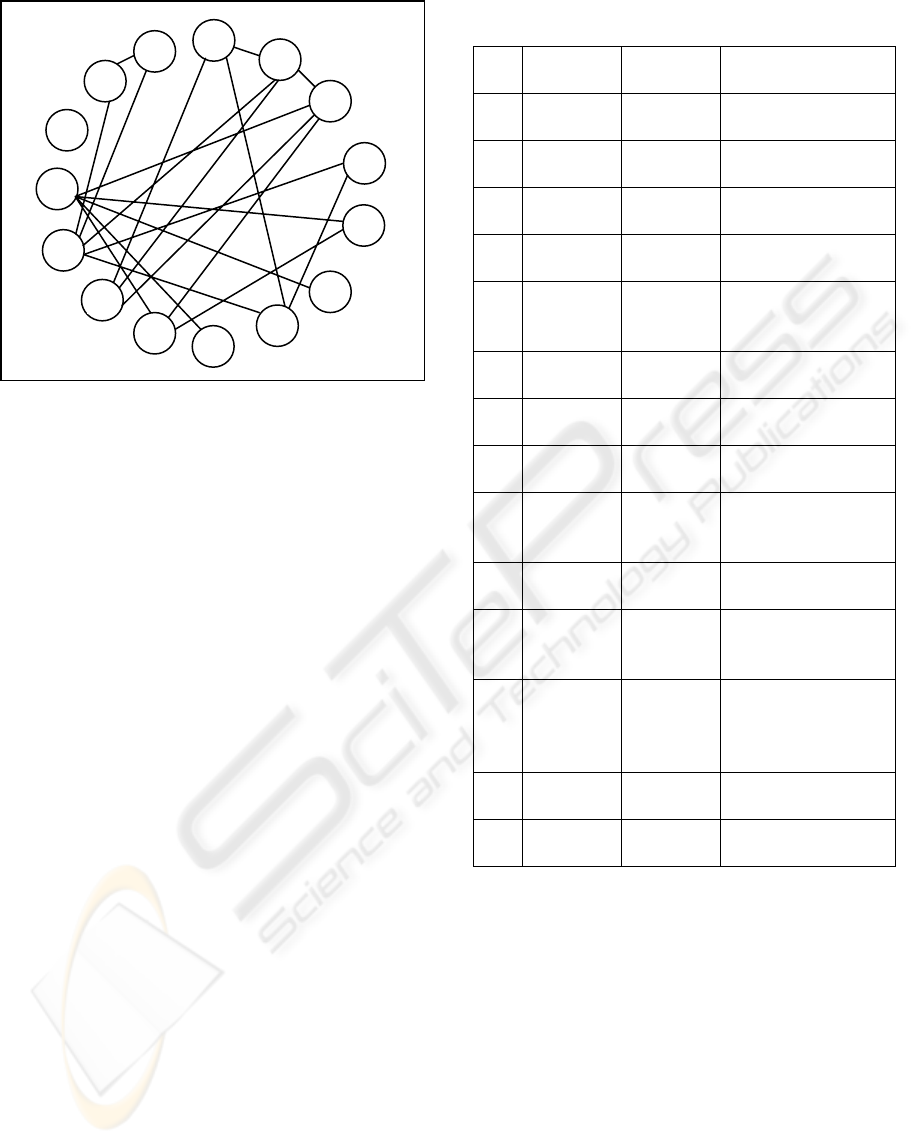
Figure 3: The association graph are formed from
relational graph
.
4 RESULT OF EXPERIMENT
The structural-based technique proposed in this
paper applied to match some stereo images. The
experiment has been done using fourteen(14) pairs
of stereo images, where each pair consists of left
image and right image. The brief of the data used in
the experiments are summarized in Table 1.
Syntactic stereo images of a house use PNG format
from VASC. The data is a pair of syntactic grey
scale image depicted a scene of a house with image
dimension 250 x 250 (Figure 4 (a) and (b)). In the
edge detection process, there are six edges detected
from the left image and six edges detected from the
right image. In the edge-tracing process, no edges
are eliminated and therefore the edge-tracing image
(Figure 4 (e) and (f)) appears the same with edge
detection image (Figure 4 (c) and (d)). After
undergoing the step of line segment extraction, there
are 23 line segments derived from the left image and
23 line segments derived from the right image (see
Figure 4 (g) and (h)). The structural information
interpreted from the left and right line segment
image is represented by the left and right relational
graph respectively (see Figure 4 (i) and (j)).
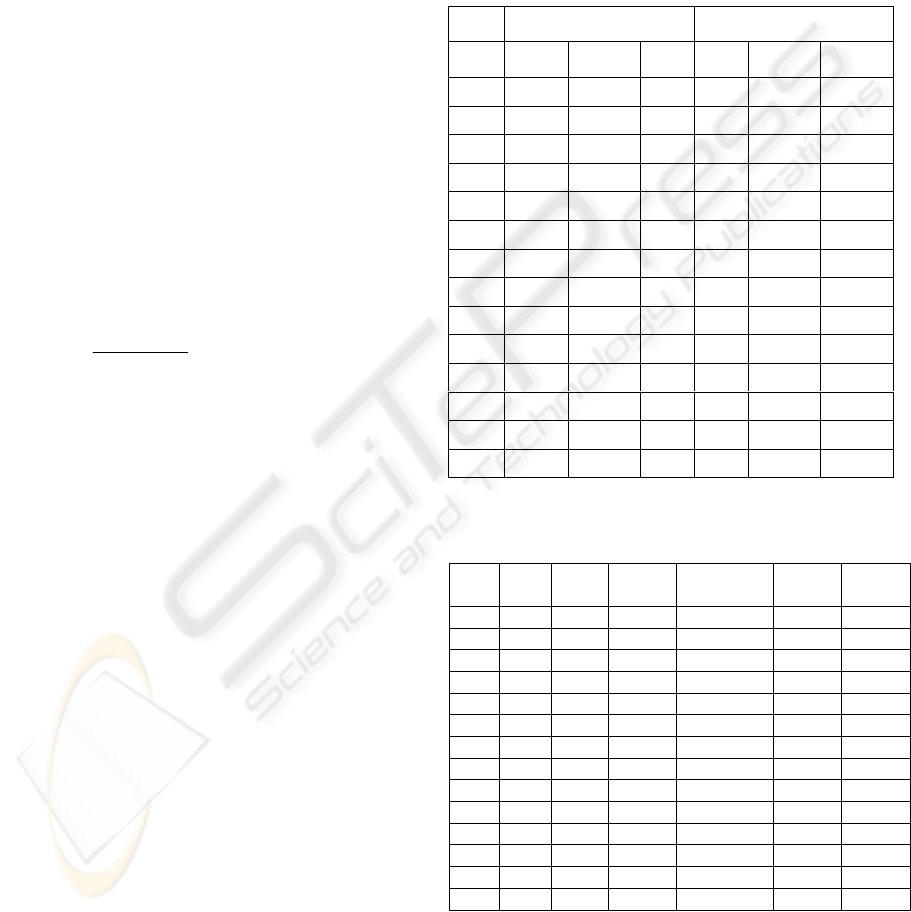
Table 1: The image data used in experiments.
Ex
p
Size Type Descriptions
1 250 x
250
PNG
(VASC)
Syntactic stereo
images of a house
2 250 x
250
PNG
(VASC)
Syntactic stereo
images of a house
3 288 x
384
GIF(©
INRIA)
Syntactic stereo
images of a block
4 288 x
384
GIF(©
INRIA)
Syntactic stereo
images of note
5 256 x
206
PNG
(VASC)
Syntactic stereo
images of some
rectangles
6 250 x
250
PNG
(VASC)
Stereo images of a
book
7 300 x
300
PGM
(VGG)
Stereo images of a
piece of gear
8 347 x
496
PGM
(VGG)
Stereo images of a
piece of gear
9 134 x
212
PNG(VA
SC)
Stereo images of a
Rubik cube and a
wooden block
10 512 x
512
PNG(VA
SC)
Stereo images of
arch of blocks
11 256 x
256
PNG(VA
SC)
Stereo images of a
telephone and a
cup
12 512 x
512
PNG(VA
SC)
Stereo images of a
tennis ball, an ice
chest and two
cylinders
13 250 x
250
PNG(VA
SC)
Stereo images of
an indoor room
14 250 x
250
PNG(VA
SC)
Stereo images of
an indoor room
Association graph is constructed from both the
left and right relational graph. The resulted
association graph has 68 nodes and 257 arcs, as
shown in Figure 4.(o). Then, the maximal clique
search is performed. The largest maximal clique is
a clique of size 19, which comprised of 19 mutually,
connected nodes. With 23 lines in the left image
and 23 lines in the right image, the matching
algorithm found 19 left-to-right correct matching
pairs, with no false matched (mismatched) lines.
There are four unmatched lines. 83 % of the left
lines are matched correctly. Figures 4 (k) and 4(l)
show the left-to-right matching lines found by the
largest maximal clique. The unmatched lines are
shown in Figures 4 (m) and 4(n).
5c
2f
4e
2g
4i
5g
1c
6a
5f
3d
1f
6b
1g
2c
6h
IMAGE MATCHING USING RELATIONAL GRAPH REPRESENTATION
403
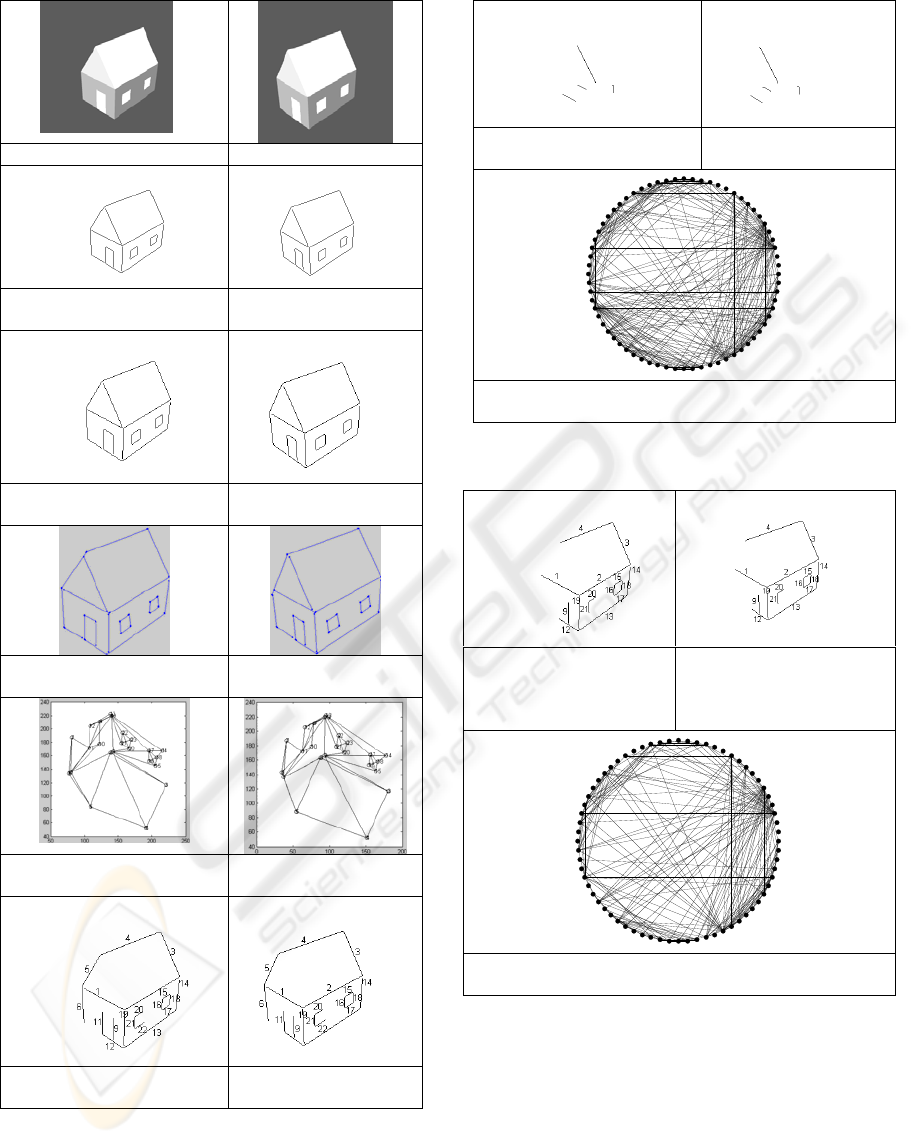
(a) Left image (b) Right image
(c) Edge detection on left
image
(d) Edge detection on
right image
(e) Edge tracing on left
image
(f) Edge tracing on
right image
(g) Line segment plotting
for left image
(h) Line segment
plotting for right image
(i) The left relational graph (j) The right relational
graph
(k) The matched lines for
left image
(l) The matched lines
for right image
(m) The unmatched lines for
left image
(n) The unmatched
lines for right image
(o) Association graph resulted from the first
experiment
Figure 4: Results of the experiment.
Figure 5: Results of the experiment without propagation.
Ambiguity in image matching might happen. (Can
be observed from the left and right image of the
house where two similar structures are formed by
the house windows). For instance, line labeled 20
of the first window in the left image might match
falsely to line labeled 15 of the second window in
the right image due to the similarity between these
two window structures, and line labeled 21 in the
left image might match falsely to line labeled 16 in
(a) The matched line
segments for left image
without propagation of
relation
(b) The matched line
segments for right image
without propagation of
relation
(c) The association graph without propagation from the
first experiment
GRAPP 2006 - COMPUTER GRAPHICS THEORY AND APPLICATIONS
404
the right image, and so forth. However, the
matching result shows that mismatch case is not
occurred at all. This observation shows that the
structural information is plausible to reduce the
ambiguity in image matching.
For structural-based image matching, again 14
samples of image are used. The structural-based
matching technique is set of rules and procedures to
accomplish image matching by taking into account
the structural descriptions of image. Here, structural
information of an image is described in terms of the
line features and its properties and inter-line
relationships. The derivation of structural
descriptions is a consequence of edge detection and
line segment fitting, line labelling and the derivation
of relationship between two neighbouring lines and
relational graph representation. Some information
about the relational graphs that represent the
structural descriptions, derived from the left and
right feature images is given in Table 2.
The density of adjacency matrix of a relational
graph ρ is the number of non-zero elements nnz
divided by the total number of matrix elements
nElnt.
ρ =
nElement
nnz
(1)
The density act as a rough indicator of the
richness of structural descriptions derived from the
left and right feature image and is represented by the
relational graph. The matrices with low density
indicate that the inter-line relationship that
successfully derived by the structural description
module is relatively in low quantity.
Here, the incorporation of inter-line
relationship, ordering (to the left of-to the right of or
to the top of-to the bottom of), intersection and co-
linearity is to impose some spatial constraints to the
feature matching process. The relationship is useful
in assisting the feature-matching algorithm to prune
away false matching candidates as well as to reduce
matching ambiguities whenever in the foregoing
problematic circumstances.
Our experiments have verified that the
incorporation of structural information is applicable
and reasonable to reduce the dependence on the
quality of the image, the performance of feature
extraction and the quality of extracted feature. The
experimental results have demonstrated that the
proposed technique is not constrained much by the
foregoing problems, and work reasonably with two
descriptions that are not likely to have a strict one-
to-one correspondence at the feature extraction
level, as can observed from the edge detection and
edge tracing images. The results also demonstrate
that the structural information compensate for the
bad effect that may cause by the foregoing
problems, at least to certain extent.
As we can
observe from the matching result, false match case
is not occurring and the number of false matched
lines is relatively in a very small quantity compared
to the number of matched lines.
Table 2: The resulted relational graph.
Table 3: The matching results.
Exp left right match Un-match false
match
Match
(%)
1 23 23 19 4 0 83%
2 24 25 20 4 0 83%
3 19 18 16 3 0 84%
4 13 6 4 9 1 31%
5 76 80 41 29 6 62%
6 27 32 4 19 4 30%
7 34 90 9 25 0 26%
8 105 124 0 99 6 6%
9 97 88 78 18 1 81%
10 73 74 22 50 1 32%
11 222 227 4 218 0 2%
12 91 91 7 83 1 9%
13 160 177 6 154 0 4%
14 173 174 6 167 0 3%
Exp Left Right
nnz nElnt ρ nnz nElnt ρ
1 95 529
0.18
91 529
0.17
2 96 576
0.17
97 625
0.16
3 65 361
0.18
66 324
0.20
4 56 169
0.33
20 36
0.56
5 284 5776
0.05
301 6400
0.05
6 108 729
0.15
130 1024
0.13
7 157 1156
0.14
382 8100
0.05
8 476 11025
0.04
571 15376
0.04
9 394 9409
0.04
391 7744
0.05
10 275 5329
0.05
279 5476
0.05
11 927 49284
0.02
959 51529
0.02
12 351 8281
0.04
345 8281
0.04
13 658 25600
0.03
770 31329
0.02
14 748 29929
0.02
713 30276
0.02
IMAGE MATCHING USING RELATIONAL GRAPH REPRESENTATION
405

5 CONCLUSIONS
In this paper, a structural-based image matching
technique is presented. The procedures consist of
the interpretation of the structural descriptions of an
image, then representing the derived structural
descriptions in relational graph and finally perform
relational graph matching in an association graph, to
accomplish image matching.
The study on structural descriptions of a feature
image has contributed to the specifications of
structural descriptions of an image in order to
facilitate the relational graph representation and
graph matching. The structural information is
described in terms of feature, feature’s properties
and relationship between features. With respect to
this, we have developed set of rules and procedures
to detect line features and inter-line relation exists in
an image. The inter-line relations focused in this
study are ordering, co-linearity, and intersection.
Structural descriptions derived from an image are
represented by a relational graph. The structural
descriptions are representing as network of nodes
and arcs in the relational graph. In the resulted
relational graph, each node represents a line feature
of the image, with its attached properties and arc (if
exist) is inserted between any two nodes to represent
the relationship between lines.
The study on deriving structural descriptions of
an image to represent in relational graph and
incorporating structural information into image
matching has contributed to the structural-based
image matching technique. Between two relational
graphs, image matching is carried out to search for
the best sub-graph isomorphism. The process
involves the derivation of an association graph from
both the relational graphs and the searching for the
largest maximal clique in the association graph to
represent the best correspondence between images.
6 FUTURE WORK
The next challenge is related to extend the
incorporation of other possible spatial relationships
between line segments features, such as disjoint,
contains, inside, overlap and others. To improve the
robustness of the method described in this paper,
more varieties of relationship are needed to describe
the structural information of an image. Further
investigations are needed on the usage of other
alternate matching primitive. The possible
alternative matching primitive is using region.
Region as matching primitives can reduce the size
and complexity of the relational and association
graph because the number of regions to be matched
is always less than the number of line segments for
any given image. The method is worthwhile to
extend to other kind of features with their specific
relationships. Further extension to incorporate with
other feature properties such as orientation, texture
and contrast is needed to increase the robustness of
similarity measure.
REFERENCES
Horaud, R., Skordas, T., 1989, Stereo correspondence
through feature grouping and maximal cliques, IEEE
Transactions on Pattern Analysis and Machine
Intelligence, 11 (11) p.p. 1168-1180.
Liu,Y., Huang, T. S. ,1992, Three-dimensional motion
determination from real scene images using straight
line correspondences, Pattern Recognition, 25(6), pp.
617-639.
Ohta,Y, Kanade, T.,1985, Stereo by Inra- and Inter-
Scanline Search Using Dynamic Programming, IEEE
Transactions on Pattern Analysis and Machine
Intelligence, 7(2), pp. 159-174.
Pla, F., Marchant, A., 1997, Matching feature points in
image sequences through a region-based method,
Computer Vision and Image Understanding, 60(3)
p.p. 271-285.
Pollefeys,M., 1999 Self-Calibration and Metric 3D
Reconstruction from Uncalibrated Image Sequences,
Ph.D. Thesis, Katholieke Universiteit Leuven,
Belgium.
Strickland, R. N., Mao, Z., 1992, Computing
correspondences in a sequence of non-rigid objects,
Pattern Recognition, 25(9) p.p 901-912.
Trapp,R., Drüe, S., Hartmann, G., 1988, Stereo matching
with implicit dectection of occlusions, Burkhardt, H.
and Neumann, B. (eds.), Proc. of 5
th
European
Conference on Computer Vision (ECCV’98), vol.II,
pp.17-33.
Zhang, Z. , Shan, Y. ,2001, A progressive scheme for
stereo matching”, Pollefeys, M. et al. (eds.): SMILE
2000, Lecture Notes on Computer Science, Springer-
Verlag Berlin Heidelberg, vol.2018, pp. 68-85.
Zhang,Z., Faugeras, O. ,1992 , Estimation of
Displacements from Two 3-D Frames Obtained from
Stereo, IEEE Transactions on Pattern Analysis and
Machine Intelligence, 14 (12) p.p. 1141-1156.
GRAPP 2006 - COMPUTER GRAPHICS THEORY AND APPLICATIONS
406
