
UNIFIED MODEL BASED THREE DIMENSIONAL TOOL FOR
MANAGING COMPUTER NETWORKS
Meva Dodo, Patrice Torguet, Michelle Sibilla, Jean Pierre Jessel
Institut de Recherche en Informatique de Toulouse (IRIT), Université Paul Sabatier, Toulouse, France
Keywords: 3D Visualization, Computer network management, Common Information Model.
Abstract: Computer network management is a field where several researches have been done and many tools created.
The last decades have seen the appearance of a new generation of management tools introducing a new
approach based on graphical visualization enabling the users to explore visually a complete system. The
main objective of the graphical visualization is to facilitate the different tasks of the administrators. This is
particularly important when the system is becoming complex due to the growth of information flow, the
heterogeneity of devices and environments or applications that handle this information. In this perspective
this research is led with as a goal to study the benefit of the use of 3D graphical representation combined
with an object-oriented information model (CIM - Common Information Model - proposed by the industrial
consortium DMTF - Distributed Management Task Force). Through this research we have particularly
focused on the necessary requirements to offer a high quality of visualization and the ways or languages
allowing the modelling of all resources present in a complex computer network.
1 INTRODUCTION
The heterogeneity of devices increases inevitably the
complexity of computer systems and particularly
networked computer systems. That implies an
increase of complexity of system administrator’s
tasks. Many tools are proposed to the users by
industries and research laboratories which main goal
is to minimize the effort needed to understand a
complex system in order to fully focus on improving
the overall performance or solve problems. To fulfil
this goal the researches have been directed towards
the use of graphical representations that allow easier
human understanding of complex systems. As an
example field, the techniques used for network
visualization may be classified in two groups: those
that use a node-link paradigm and the virtual worlds
based techniques. The main advantage of using a
node-link diagram to represent network structures is
that a person can directly see the relationships that
are drawn as a set of graphical edges appearing in
the diagram. This makes easier for the process of
human perception to understand the relational
structures of information. 2D and 3D representations
are the two well-known techniques using this
paradigm. A new technique used to visualize
networks is based on virtual worlds. Its main benefit
is that it enables to create a visual metaphor and use
novel devices to provide a natural and intuitive form
of navigation and interaction with the data.
However these tools will never be effective if
there are no ways or languages for gathering and
modelling all the system resources to be managed. In
this work we have chosen to use the CIM object-
oriented information model. The main motivation of
the industrial consortium DMTF (DMTF, 2005) in
providing this model was to solve the problem of the
heterogeneity of different devices and environments
forming a complex system by facilitating the
integration of applications and entire systems
developed by different vendors. We think that this
object-oriented model can also benefit a lot the
understanding of the system complexity if it is
associated with a good graphical visualization.
2 RELATED WORK
2.1 Node-Link Representation
The traditional method used in network visualization
is the use of a 2D graphical representation combined
with a network management protocol (Hewlett-
Packard, 2005) (Gus Estrella, 2005) (Bradley
256
Dodo M., Torguet P., Sibilla M. and Pierre Jessel J. (2006).
UNIFIED MODEL BASED THREE DIMENSIONAL TOOL FOR MANAGING COMPUTER NETWORKS.
In Proceedings of WEBIST 2006 - Second International Conference on Web Information Systems and Technologies - Internet Technology / Web
Interface and Applications, pages 256-263
DOI: 10.5220/0001251302560263
Copyright
c
SciTePress

Huffaker, 2005). The principal shortcoming of these
tools resides in their inability to generate an accurate
picture of the resource’s information specifically
when the system is getting too complex. Many
techniques have been used to reduce this limitation,
for example the use of animation (Deborah Estrin et
al., 2005), the optimisation of display space use
(Nguyen and Huang, 2005)…
3D visualization eliminates increasingly many of
the restrictive issues found in 2D representation
techniques such as display clutter and device
overlap. The main advantage of the 3D graphical
representation is this easiness to provide a tool
offering a high quality of visualization according to
Schneiderman’s precept “The Visual Information
Seeking Mantra is: Overview first, zoom and filter,
then details-on-demand” (Le Grand and Michel
Soto, 1999).
Among the tools using a 3D graphical
representation, UNIVIT (UNiversal Interactive
VIsualization Tool) (Le Grand and Michel Soto,
1999) is one of the most innovative systems in term
of ideas for offering a good visualization. It allows
visualising any kind of hierarchical data that can be
described with the XML format.
Another popular tool based on 3D visualization
is CyberNet (Abel et al., 1999) which main feature is
its ability to collect data and visualize large amount
of dynamical information. The collected information
is structured and mapped on visual parameters
(shape, colour, size, location...) of 3D objects in
order to build a dynamical metaphoric world where
the user may navigate and interact.
Both the above mentioned tools have a common
characteristic: they only display information
structured hierarchically. In comparison to the two
precedent tools, PatrolVisualis (BMC, 2005) offers
different sorts of 3D visualization, such as graphs
and trees. Its other main feature is the use of natural
metaphors for device representation.
Designed for network performance visualization,
Cichlid (Brown et al., 2000) supports two types of
view: 3D bar charts used for displaying numeric
quantities, and vertex/edge graphs for representing
network topologies in three dimensions. Although it
does not use natural metaphors for the devices
representations, the main advantage of Cichlid is its
capability to offer 3D representations of the
performance measures via different types of
diagrams such as packet length distribution, traffic
volume by address block…
3D graphical representations have proved that
they can adequately eliminate the limitations
associated with 2D visualization systems, but like
most systems they have their own glitches. A
possible drawback is the choice of metaphor used to
represent the different devices that sometimes does
not reflect the real form of an element, or the
additional charge for 3D rendering.
2.2 Virtual Worlds
The emergence of multimedia technologies such as
video conferencing and streams-based applications
has increased the hugeness of information
throughout the network. Due to that, the network
management tasks exceed the capability of a single
administrator and need new tools minimizing the
necessary effort to understand a complex system.
Virtual worlds offer new solutions to the limitations
found in existing network visualization tools. By
providing an interactive three dimensional
environment in which several users can move
around and interact, the virtual world techniques
greatly enhance the network manager’s
understanding.
Based on the CoRgi (Schmidt, 1999) virtual
reality toolkit, a study was done using a landscape
metaphor as a visual representation for network
visualization. The network is totally converted to a
natural landscape where mountains and trees
represent respectively network switching equipment
and computers. An interesting characteristic of this
environment is the use of thunder 3D sounds
associated with a trouble indicating the source of
network errors.
Flatland (Fisk et al., 2003) is an environment
designed to monitor traffic at an administrative
boundary between the Internet and an internal
network. Using the concept of territory, the internal
address space of the network is mapped into a
circular region while the external address space, the
Internet at large, is mapped into a hemispherical
region. The two regions are separated by a shield
that represents the administrative boundary, the
firewall. The colour of rays connecting an
originating host to the destination host through the
shield indicates the state of intrusions.
In order to provide a way to control high-speed
computer networks, VENoM (Virtual Environment
for Network Monitoring) (Cubeta et al., 1998) has
been developed as a suite of models and applications
based upon collaborative virtual worlds. It was
designed specifically to visualize large ATM
(Asynchronous Transfer Mode) optical fibre, wide
UNIFIED MODEL BASED THREE DIMENSIONAL TOOL FOR MANAGING COMPUTER NETWORKS
257

area networks. The environment includes physical
room layouts, system resource abstractions, real-
time, and system-specific information. It also allows
multiple network administrators to collaborate in the
same virtual world regardless of the person’s
physical location. The administrators are represented
by virtual humans. Similarly all resources are
represented by virtual objects which look like them.
In the next section, we talk about the necessary
requirement in having a standard model for
management system. Indeed, in the management
system, all resources should be modelled uniformly
in order to make their exploitation easier (CIM,
2000).
3 A STANDARDIZED MODEL
REQUIREMENT
3.1 Discussion
As mentioned above, managing complex network is
always a great challenge due not only to the growth
of information throughout the system but
specifically to the variety of technology used in each
resource that handles this information. Sometimes
each product defines its management data in
different ways by creating its own semantics,
terminology, data structures and protocols. In an
attempt to address those issues DMTF (WBEM,
2005) proposes an object-oriented model, CIM,
which goal is to provide a common way to represent
the computing and networking elements and the
relationships between them.
3.2 CIM Model Advantages
Originally CIM was developed to support the
integration of multi-vendor applications into Energy
Management System (EMS). By combining the most
powerful concepts from relational databases, such as
normalization and views, with the most powerful
concepts from object-oriented analysis, such as
generalization, aggregation, and design patterns,
CIM supports the integration of a wide range of
utility systems and applications (Podmore et al.,
1999). Extensions have been made to handle
computer and communication networks.
Through the CIM concept, DMTF proposes a set
of grammars carrying:
- Structural concepts derived from the object
paradigm: schema, class, property, method,
association (seen as a specialisation of the
class concept) and reference (seen as a
specialisation of the property concept).
- New specific concepts (qualifier, trigger,
indication) expressing constraints and/or
meta-information on the structural
concepts, and the dynamic of modelled
elements.
Using those grammars, a modelling approach with
three levels of abstraction is proposed: the “Core
Model” introducing high level abstract classes
allowing organizing the managed elements into
physical and logical elements; the “Common
Model” that is the extension of the “Core Model” to
the following domains: system, application,
network, physical equipment and functional
equipment; and the “Extension Model”: specialises
the “Common Model” to the technology domains
relating to the implementation of the managed
resources. Extension Models are defined by
individual companies or organizations, but not by
the DMTF. From all elements defined in this meta-
model will be modelled the different resources to be
managed (CIM, 2000). Figure 1 shows the basic
elements of CIM model.
Towards the three levels of abstraction, CIM
provides a common definition of management
information for systems, networks, applications and
services, and allows for vendor extensions. Within
CIM schema all classes modelling managed
elements are derived from the ManagedElement
class which is an abstract class. It is in the Core
Model. One of its subclass is the
ManagedSystemElement class. This class is the base
class for the system element hierarchy. It represents
systems (computers, networks, storage libraries and
application systems); the software that runs on them,
the functionality provided by them and abstractions
of the hardware that composes them.
CIM_Dependency and CIM_Component are two
classes abstracting the relationships between
managed elements.
This concept is specifically important because it
allows to understand well how the different elements
are interconnected and how they are hierarchically
organised. Another important class is
CIM_Indication. It abstracts all events that can
change the system’s behaviour. Using this class it is
possible to associate an action to be carried out when
an event is received by an object.
WEBIST 2006 - INTERNET TECHNOLOGY
258
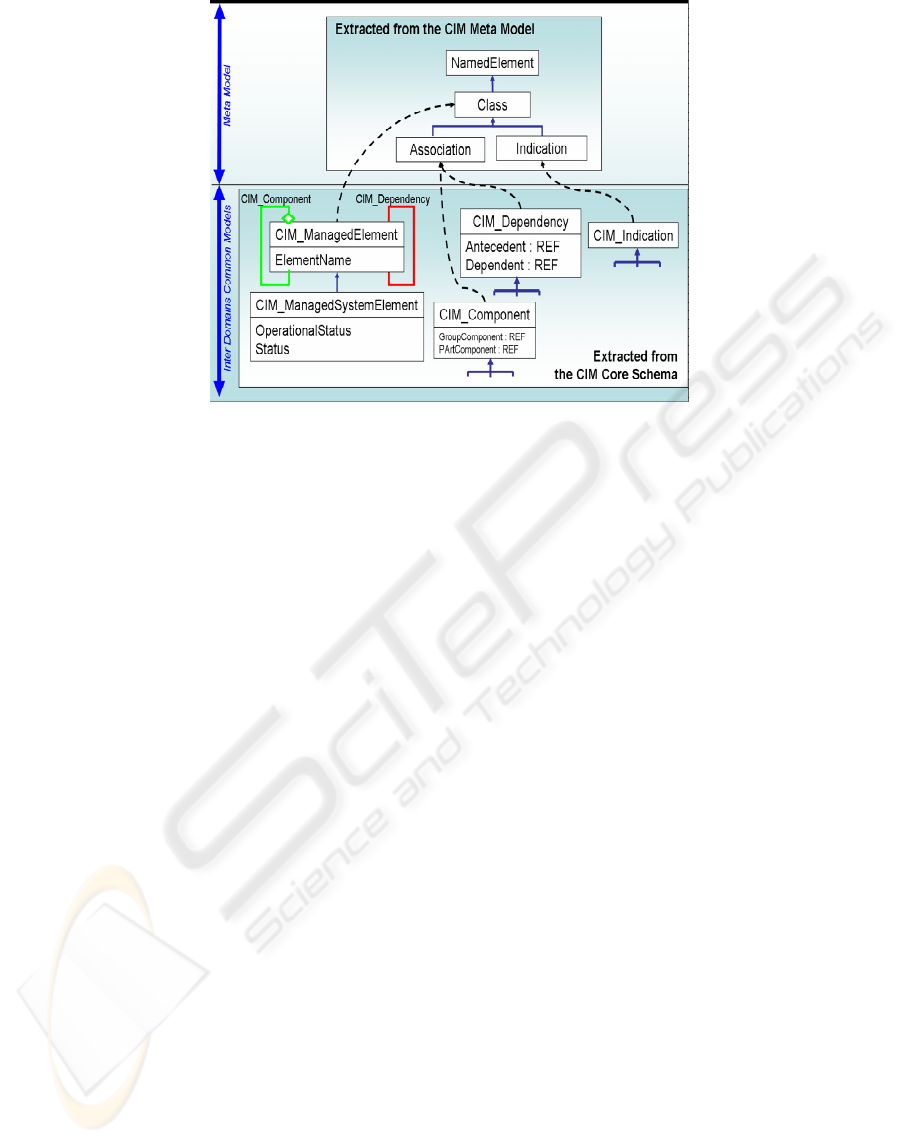
Figure 1: Basic elements of the CIM model.
4 OUR 3D VISUALIZATION
APPROACH
From advantages offered by traditional tools and the
powerfulness of virtual world techniques we propose
through this paper a three dimensional tool to
enhance the user’s understanding of complex
network system. The aim of this study consists in
offering complex network administrators an
environment allowing them to perform effectively
their tasks. To fulfil this goal the future application
should provide a high quality of visualization
following the Schneiderman’s precept. For this,
seven high level tasks should be supported (Wiss et
al., 1998): Overview- Gain an overview of the entire
collection of data that is represented; Zoom- Zoom
in on items of interest; Filter- Filter out
uninteresting items; Details-on-demand- Select an
item or group and get details when needed; Relate-
View relationships among items; History- Keep a
history of actions to support undo, replay, and
progressive refinement; Extract- Allow extraction
of sub-collections and of query parameters.
Thus, complex network management may be
facilitated by the use of 3D visualization techniques
if some measures of representation and navigation
are satisfied. Le Grand (Le Grand and Michel Soto,
1999) expresses the Schneiderman’s precept in term
of quality of representation and quality of
navigation. The quality of representation implies that
a global view should be offered so that the users can
identify the main interest in the system before
deciding where to begin the navigation. Throughout
this process the user should be able to explore some
parts of the system and gather information details
according to his/her demand. On the other hand, the
quality of navigation is expressed by the need to
allow users to explore the system and to access the
data. The effectiveness of the navigation system may
be measured by its capability to allow the user to
answer three questions: “Where am I?”, “Where
have I been?” and “Where can I go?” (Mayer, 1999)
The first question refers to orientation that is
inseparable to the navigation process because it sets
up a prerequisite to decide where to begin the
navigation. And the two last questions resume the
major problems of users during complex system
exploration.
We also underline the importance of
metaphorical choice that is not included into the
information visualization’s Mantra. Indeed (Abel et
al., 1999) “the metaphors provide ways of
introducing concepts to users with the aid of
analogies with familiar real-objects”. Thus, using
metaphors that the user is already familiar with can
enhance legibility of information. Tsygae (Tsegaye,
2003) studied the contribution of metaphor in the
network visualization process and concluded that an
appropriate form and model set up a first way in
system understanding. Nakakoji et al. (Nakakoji,
2001) remark that the 3D representations should not
be used abusively in order to avoid people
misinterpreting information or obscuring the focus
of the information. Indeed, it is important to
understand when, and how should complex
visualization be used to help people in order to
understand and to explore the information easily and
UNIFIED MODEL BASED THREE DIMENSIONAL TOOL FOR MANAGING COMPUTER NETWORKS
259
accurately. Therefore in our application, all managed
resources will be represented with natural 3D
shapes.
4.1 Visualization System and
Metaphors
As complex systems may not be only structured
hierarchically, a graph representation will be
effective to represent how different devices are
interconnected. This type of visual representation is
particularly important to visualize for example an
overview of a server farm. The tree representation is
used to show how a domain or equipment is
composed of individual elements. Even though the
tool we are building will allow visualizing any type
of complex system, the first prototype is simpler.
We currently offer a 3D standard object forms used
to represent computer network (computers, switches,
printers…). Then another tool will soon be added
allowing the user to choose the colour and the
geometry of each object to be displayed according to
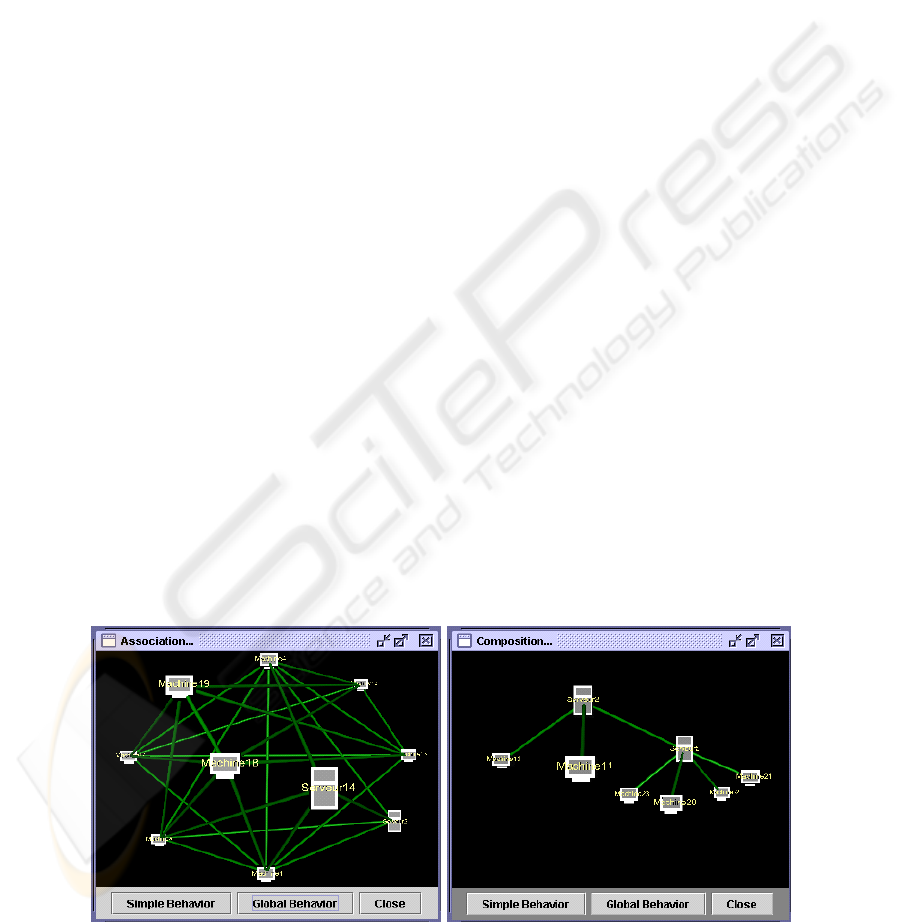
the system to be managed. The example in figure
2(a) shows association relationships are represented
by interconnections between 3D objects. Each link is
an instance of the CIM_Dependency class. They are
modelled by a cylinder which width and colour may
be changed to indicate the data flow between two
elements or simply the status of the connexion.
The button labelled “GlobalBehavior” allows the
user to move the scene entirely. After clicking this
button, one can translate, rotate or zoom the scene to
find interesting views. While the “SimpleBehavior”
button is used to move independently the objects.
This allows the user a full control of the display. In
fact, one of our goals consists in offering the user an
environment where he/she can adapt the presentation
following his/her needs.
The hierarchical composition of equipment or a
domain is displayed as shown in the figure 2(b).
This is very important because it enables the user to
understand how a large domain is set up or of what
specific equipment it is composed. The links used in
this figure are instances of the CIM_Component
class.
4.2 Navigation and Interaction
Using the Java3D API, we have taken advantage of
several of the features it offers to create a good
navigation. Zooming is used to allow users to
explore the detail or the context of the system. The
left mouse button allows rotating an object or an
entire scene. To avoid a possible clutter of the
display and to provide the user a full control of the
scene the right mouse button is used to move an
object and thus rearrange the disposition in order to
have a better presentation. By clicking an object
with the middle mouse button, a “popup menu”
appears. This menu allows the users to have details
about the clicked object such as: its description, the
objects with which it is associated and its
substructure (i.e. what it is composed of). For
example, from the submenu description one can
have a window describing the object. This is a
textual description of the object (for instance its
location in a WAN, LAN, or the devices that it is
composed of, or other parameters).
Figure 2: 3D display relationships (a) and composition relationships (b).
WEBIST 2006 - INTERNET TECHNOLOGY
260
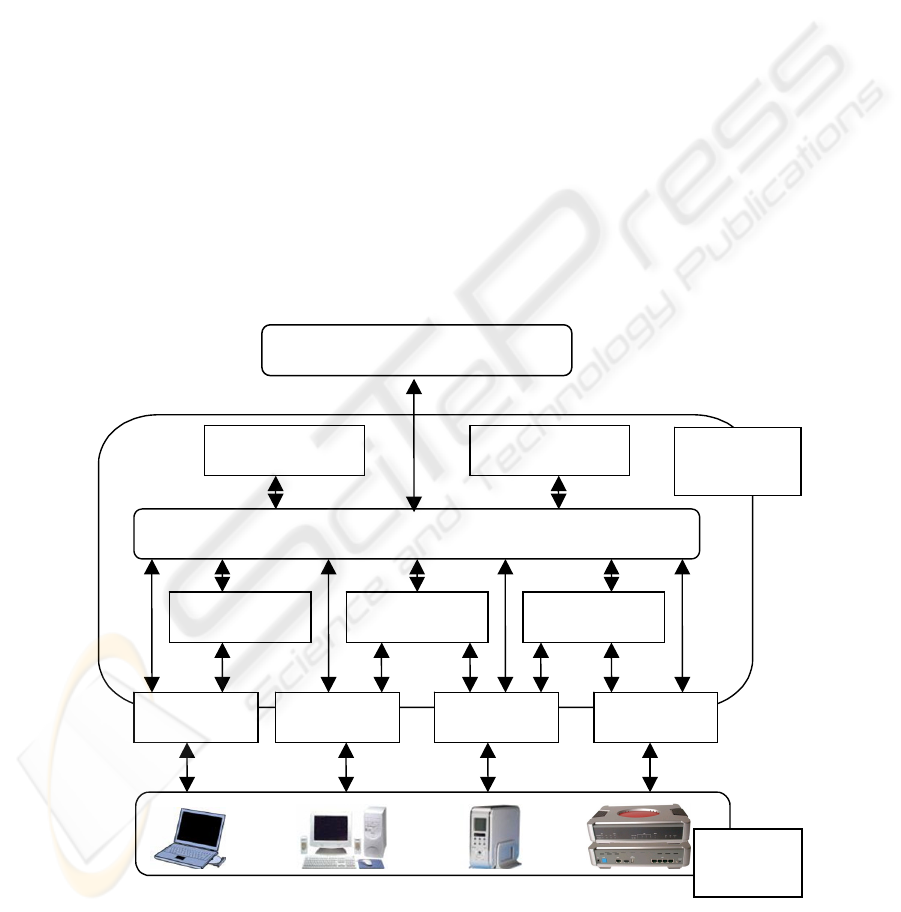
5 SOFTWARE ARCHITECTURE
Figure 3 shows an overview of our system. The 3D
visualization application communicates with a
complex system which deals with all the
management information.
The collection and the organisation of
information are not the main interest of our study;
however we think that it is always good to give a
brief explanation of the management system. In fact
it is based on WBEM (Web-Based Enterprise
Management) architecture proposed by DMTF. This
architecture consists of the Object Manager (OM)
and Object Provider (OP) notions.
An Object Manager is an application responsible
of one or more management domains that may be
functional (ex: security) or structural (ex: computer
or satellite component). In the WBEM architecture,
an Object Manager is implemented by a
management database called a MIB (Management
Information Base). All information of resources to
be managed is stored in the MIB described using
CIM model.
An Object Provider is a manager entity
responsible of the integration with a specific
environment. This environment may be an
environment to be managed (ex: UNIX, Windows),
a management environment (ex: SNMP) or any type
of environment. For each type of environment an
Object Provider will be necessary. The Object
Provider assumes an important role by providing a
homogenous view of heterogeneous environments to
be managed. The Object Providers act as gateways
between the management system representing OMs
and the real managed world (WBEM integration
viewpoint).
So in order to be managed, a node must
communicate with an object provider (e.g. through
SNMP) that pushes all management information to
an object manager responsible of its domain.
3D Visualisation
Object Manager
Object
p
rovider
Object Manager
Object manager
Software bus
Object manager Object manager
Object
p
rovider
Object
p
rovider
Object
p
rovider
Managed
objects
SUMO
Platform
Figure 3: Software architecture of our system.
UNIFIED MODEL BASED THREE DIMENSIONAL TOOL FOR MANAGING COMPUTER NETWORKS
261

5.1 Implementation
To ensure portability and durability of solutions, all
components of the system are developed in Java. All
3D components are created with Java3D. The user
interface application communicates with the object
managers using CORBA.
When the network becomes complex, it may not
be easy for one administrator to ensure efficiently all
tasks. Therefore we plan to modify our system so
that two or more users can collaborate in order to
manage network.
Actually, the visualization application runs on a
laptop with a 1.8Gh processor. The graphic card is
an X200 series ATI. But the only requirement of our
application is an OpenGL or DirectX supported
card. As most current graphic cards support DirectX
this is not a big requirement.
6 CONCLUSION AND FUTURE
WORK
Managing complex systems is always a great
challenge and the technology progress makes this
task more complex. We can see through the many
tools currently in use that their usefulness depends
not only on the visualization quality, but also and
mostly on their capability to model all resources to
be managed. Another important remark in creating
an effective visualization is that the metaphors
should not be chosen abusively in order to avoid
small interpretation problems or a possible complete
misunderstanding of the system. The connections
between the data must also be shown in order to
facilitate the understanding process because they
reflect the relational structures of the managed
resources.
We have developed a tool allowing users to
explore, in 3D, objects and their dependency
relationships. Instead of developing and
implementing new platform we have coupled our
tool with CAMELEON, a CORBA/java/CIM based
management system (SUMO, 2005). In order to let
users select and display interesting data or events the
tool will soon be associated with a query system
(using CQL – CIM Query Language). Another goal
is to refine the semantic aspects with views
customisation.
In the future, the CIM_Indication class will be
exploited for system diagnostic. For example, we
plan to add 3D sounds that will attract the user’s
attention to a problematic event (errors, faults,
power downs…). Moreover, as Java3D loads a lot of
3D files, our tool will easily be modified to include
environmental models such as buildings. This will
allow the user to see the real location of the faulty
element.
REFERENCES
The Distributed Management Task Force (DMTF), “Why
CIM? The value of the Common Information Model”,
June 2003. Retrieved June 5, 2005, from
http://www.dmtf.org/education
Hewlett-Packard, “Manage dynamic networks with HP
OpenView”. Retrieved June 5, 2005, from
http://www.managementsoftware.hp.com/
solutions/nsm/nsm_bb.pdf
Gus Estrella, GXSnmp SNMP Manager. Retrieved June,
2005, from http://www.gxsnmp.org
Bradley Huffaker, “Otter: A general purpose network
visualization tool”. Retrieved July 12, 2005, from
http://www.caida.org/tools/visualization/otter/paper/
Deborah Estrin, Mark Handley, John Heidemann, Steven
McCanne, Ya Xu, “Network Visualization with the
VINT Network AniMator” IEEE Computer, 33 (11),
pp.63-68, November, 2000. Retrieved April 6, 2005,
from http://www.isi.edu/%7Ejohnh/PAPERS
/Estrin00b.pdf
Quang Vinh Nguyen, Mao Lin Huang, “A Space-
Optimized Tree Visualization”, Proceedings of the
2002 IEEE symposium on Information Visualization,
pp.85-92, October 28-29, 2002, Boston, Massachusetts
Bénédicte Le Grand, Michel Soto, “Navigation in Huge
Information Hierarchies – Application to Network
Management”, ACM NPIVM’99 Workshop (Workshop
on New Paradigms in Information Visualization and
Manipulation), Kansas City, MI, USA, pp. 56-61,
November 2-6, 1999
P.Abel, P.Gros, D.Loisel, J.P.Paris. “Network
Management and Virtual Reality”, International
Scientific Workshop on virtual reality and prototyping,
June 1999
BMC Software “The New Vision of Network
Management”. Retrieved March 3, 2005, from
http://www.atsweb.it/Images/Documenti/
BMC_DS_Visualis.pdf
J.A Brown, MCGregor A.J, Braun H-W. “Network
Performance Visualization: Insight Through
Animation”, Proceedings PAM2000 Passive and
Active Measurement Workshop, Hamilton, New
Zealand, pp. 33-41, April 2000
Wilfred SCHMIDT. Network Visualization and Virtual
Reality”. Technical Report, 1999. Retrieved February,
2005, from http://www.cs.ru.ac.za/research
/Groups/vrsig/pastprojects/023networkvisualization/pa
per01.pdf
WEBIST 2006 - INTERNET TECHNOLOGY
262

Mike Fisk, Steven A.Smith, Paul M.Weber, Satyam
Kothapally, Thoms P.Caudell. “Immersive Network
Monitoring”, Proceedings PAM2003 Passive and
Active Measurement Workshop, La Jolla, California,
April 6-8, 2003
James A. Cubeta, Kirk T. Kern, David D. Egts. VENoM –
“Virtual Environment for Network Monitoring”,
Symposium on Advanced Information Processing and
Analysis proceedings, March 1998
Melekam Tsegaye, “Network Visualization with 3D
Metaphors”, Southern African Telecommunication
Networks & Applications Conference (SATNAC),
2003. Retrieved April 12, 2005, from
http://www.cs.ru.ac.za/research/students/g98t4414/
static/papers/SATNAC2003.pdf
Kumiyo Nakakoji, Akio Takashima, Yashuro Yamamoto,
“Cognitive Effects of Animated Visualization in
Exploratory Visual Data Analysis”, Proceedings of
Information Visualization 2001, IEEE Computer
Society, pp.77-84, London, UK, July 2001
Ulrika Wiss, David Carr, Hakan Jonsson, “Evaluating
Three-Dimensional Information Visualization
Designs: A Case Study of Three Designs”,
Proceedings of International Conference on
Information Visualization, London, England, July, 29-
31, 1998
“SUpervision et Maîtrise des Opérations”. Retrieved July
12, 2005, from http://www.irit.fr/SUMO
(Podmore et al., 1999)
Robin Podmore, Rob Fairchild, Marck Robinson,
“Common Information Model–A Developer’s
Perspective”, The 32
nd
Hawaii International
conference on System Sciences, 1999
The Distributed Management Task Force, “The Web-
Based Enterprise Management standard (WBEM)”.
Retrieved June 5, 2005, from
http://www.dmtf.org/standards/wbem
The Distributed Management Task Force, “The Common
Information Model (CIM)”. Retrieved June 5, 2005,
from http://www.dmtf.org/standards/
documents/CIM/DSP0111.pdf, Version 2.4, August
2000, Whitepaper DSP0111
Matthias Mayer, “Contextual Web Visualization:
Browsing Icons and Browsing Graphs to Support
Orientation and Navigation in the World Wide Web”,
Proceedings der 6. Tagung der Deutschen Sektion der
Internationalen Gesellschaft für Wissensorganisation
Hamburg, September, 23-25, 1999. Retrived
September 20, 2005 from http://asi-
www.informatik.unihamburg.de/personen/mayer/publi
cations/mayer_infovis2000_submitted.pdf, 2
nd
edition
UNIFIED MODEL BASED THREE DIMENSIONAL TOOL FOR MANAGING COMPUTER NETWORKS
263
