
A Comparison of Methods for Web Document
Classification
Julia Hodges
1
, Yong Wang
2
and Bo Tang
3
Department of Computer Science & Engineering, Mississippi State University
Box 9637, Mississippi State, MS 39762
Abstract. W
ebDoc is an automated classification system that assigns Web
documents to appropriate Library of Congress subject headings based upon the
text in the documents. We have used different classification methods in
different versions of WebDoc. One classification method is a statistical
approach that counts the number of occurrences of a given noun phrase in
documents assigned to a particular subject heading as the basis for determining
the weights to be assigned to the candidate indexes. The second classification
method uses a naïve Bayes approach. In this case, we experimented with the
use of smoothing to dampen the effect of having a large number of 0s in our
feature vectors. The third classification method is a k-nearest neighbors
approach. With this approach, we tested two different ways of determining the
similarity of feature vectors. In this paper, we report the performance of each of
the versions of WebDoc in terms of recall, precision, and F-measures.
1 Introduction
The problem of automated document understanding has been addressed from several
different viewpoints. Some researchers are interested in the generation of summaries
of documents [2, 7]. Others are interested in the extraction of key phrases from the
documents [18]. A number of researchers are concerned with the ability to find
specific information in a document, such as the name of a terrorist group responsible
for an attack. Many of these efforts have been reported at the Message Understanding
Conferences (MUCs) [10] and TREC competitions sponsored by ARPA and NIST.
Another aspect of the document understanding problem in which a number of
researchers are interested, and the one addressed in this paper, is the automated
classification of Web documents [9]. The system described in this paper, WebDoc,
automatically classifies Web documents according to the Library of Congress subject
headings.
The available directories for Web documents generally rely on humans to classify
the doc
uments. For example, according to the report on Directory Sizes available
from Search Engine Watch (http://searchenginewatch.com/reports/directories.html
accessed on September 3, 2002), Open Directory employs 36,000 editors to provide
2,600,000 links to documents. The popular Yahoo! employs over 100 editors to
provide links to between 1,500,000 and 1,800,000 documents. According to [12], the
Hodges J., Wang Y. and Tang B. (2005).
A Comparison of Methods for Web Document Classification.
In Proceedings of the 5th International Workshop on Pattern Recognition in Information Systems, pages 154-163
DOI: 10.5220/0002557601540163
Copyright
c
SciTePress
bottleneck in directory systems is the ‘manual classification of newly collected
documents.’
In our research, we chose to classify Web documents using the Library of Congress
classification system, a comprehensive and widely used classification system that has
a hierarchy of subject headings (categories) in which any major domain within the
hierarchy may have thousands of subject headings. We have used the traditional
information retrieval measures of precision and recall to assess the performance of
our classification system.
In this paper, we report the results of using different approaches to the
implementation of the classification component of WebDoc. We begin with an
overview of the WebDoc classification system. This includes a description of the
knowledge base used by our system, the three different classification methods that we
used (a statistical approach, a naïve Bayesian approach, and a k-nearest neighbors
approach). It also describes the different methods we used for determining if two
feature vectors are similar and for feature extraction. Finally, we discuss our
experimental results and compare the different approaches used. The experimental
results reported here represent a continuation of experiments reported in [19].
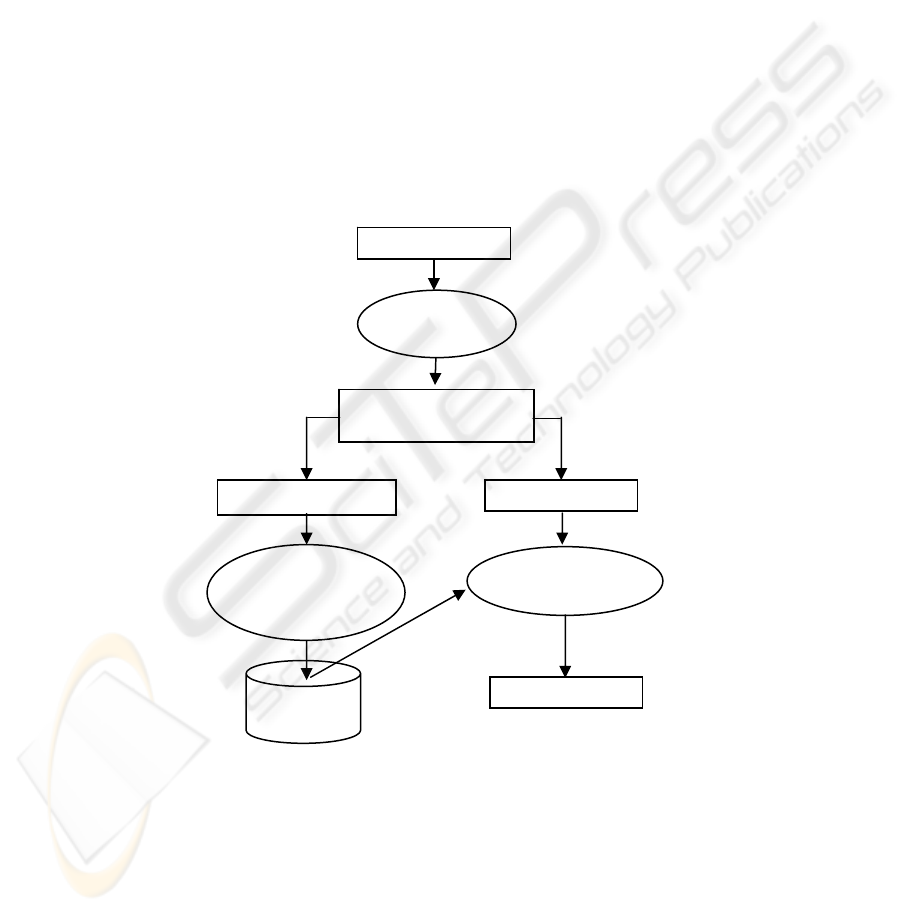
NLP
componen
t
Parsed documents with
noun phrases identified
Knowledge base
construction
component
Index generation
component
Knowledge
Base
Training documents Test documents
Candidate indexes
HTML
Fig. 1. Architecture of the WebDoc system
155

2 System Description
Our system, WebDoc, automatically classifies Web documents according to the
Library of Congress Classification (LCC) scheme. It evolved from one of our earlier
research projects, Assisted Indexing at Mississippi State (AIMS), which was an
automated system that aids human document analysts in the assignment of indexes to
physical chemistry journals [6].
We have implemented three different versions of WebDoc based on three different
approaches to the classification problem: one that uses a statistical algorithm for
determining the appropriate classifications for a given document, one that uses a
Bayesian approach, and one that uses the k-nearest neighbors (kNN) method. Each
version of WebDoc consists of three major components – the natural language
processing (NLP) component, the knowledge base construction component, and the
index generation component, as shown in Figure 1. The NLP component tags the Web
document with syntactic and semantic tags (e.g., noun and astronomy) and parses the
document so that various sentential components such as noun phrases may be
identified. The knowledge base construction component builds a knowledge base of
information that includes the LCC subject headings and their interrelationships as
well as other information used during classification The index generation component
generates a set of candidate indexes for each document in a test set of documents. (In
this paper, we use the terms subject headings and indexes to mean the same thing.)
2.1 Knowledge Base
The knowledge base, which was implemented using the ObjectStore object-oriented
database management system, consists of three sections: the thesaurus section, the
index section, and the statistical section. The thesaurus section consists of all the LCC
subject headings and their interrelationships. The index section contains the indexes
that were assigned to each document in the training set by our human expert
document classification librarian. When assessing the performance of WebDoc in
assigning indexes (or subject headings) to the documents in the test set, the indexes
assigned by the human expert are considered to be the correct indexes.
The information stored in the statistical section of the knowledge base varies
depending on with which version of WebDoc this knowledge base is associated. The
statistical section for the statistical version of Web Doc stores information that
provides mappings between noun phrases that occur in the documents and the Library
of Congress subject headings. Given a set of documents to which the appropriate
subject headings have been assigned by our human expert, WebDoc accumulates
information about the number of times that each noun phrase appears in the
documents assigned to a particular subject heading. From this, WebDoc computes the
frequency with which the appearance of a given noun phrase correctly indicates that a
document should be assigned to a given subject heading (true_positives) and the
frequency with which the appearance of a given noun phrase incorrectly indicates that
a document should be indexed by a given subject heading (false_positives). WebDoc
then uses these measures to assign weights to the various noun phrases to represent
how likely it is that a given phrase is a reliable indicator that a document should be
156

assigned to a given subject heading. The statistical section for the naïve Bayes version
and the kNN version includes information about the feature vectors that were
constructed for the training documents. This is discussed in greater detail in the
section describing these versions.
2.2 Feature Vectors
Both the naïve Bayes version and the k-nearest neighbors (kNN) version of WebDoc
used the vector space model to represent the documents. Three aspects, probability
smoothing, vector similarity, and feature selection are studied.
In general, smoothing is done to remove noise from the data [3]. In our application,
we generally have feature vectors in which a large number of the feature values are 0
due to the infrequent occurrence of many of the noun phrases. This is problematic for
a probabilistic approach such as the naïve Bayes method. A class of smoothing
methods called the Good-Turing methods ‘provide a simple estimate of the total
probability of the objects not seen’ as well as estimates of ‘probabilities for observed
objects that are consistent with the probability assigned to the unseen objects’ [1]. We
used a Good-Turing method called the Linear Good-Turing method to compute the
probabilities needed for the naïve Bayes version of WebDoc. This process is
described in the section that describes the Bayesian version.
We experimented with two different methods for determining the similarity of two
feature vectors in the kNN version: count of common feature values and cosine
coefficient. For the count of common feature values, we simply determine the number
of features in two feature vectors that have similar values. That is, we compare the
occurrence frequencies for a given feature. We consider a given feature to have
occurred a similar number of times in the two different feature vectors if the
difference in their frequencies is less than some value ∆. If the number of common
feature values is greater than some predefined threshold, then the two vectors are
considered to be the same. The cosine coefficient method computes the normalized
inner product of the two vectors [14].
Feature selection is an important part of any classification method that uses feature
vectors because of the possibility that the feature vectors may be extremely long.
Many researchers have addressed the problem of feature selection [15, 21]. In the
naïve Bayes method, extremely long feature vectors may result in an extremely high
cost for the computation of the values of P(C
i
|X) and P(X). On the other hand, feature
vectors that are too short are unable to distinguish among the documents.
Currently the features in our feature vectors are the noun phrases that occur in our
training documents. I.e., (the stem form of) each unique noun phrase is a feature. For
a given document, the feature vector representation gives the frequency with which
each noun phrase occurred in that document. Our feature vector has more than a
thousand features. Some of the features are quite useful in distinguishing among the
documents, but others are not. The goal of feature selection is to remove those
features that are not informative, thus reducing the length of the feature vector [21]. In
our experiments, we used four different feature selection methods in the naïve Bayes
and kNN versions: inverse document frequency, information gain, mutual
information, and χ
2
. A detailed introduction about these methods is provided in [21].
157

2.3 Statistical Version
The statistical version of WebDoc uses a classification algorithm that was used
successfully in AIMS [6] as well as its predecessor, KUDZU [5]. From a set of
documents that have been indexed by our human expert, WebDoc counts the number
of times that each noun phrase appears in documents assigned to a particular subject
heading. It uses that information to compute the frequency with which the appearance
of a given noun phrase correctly or incorrectly indicates that a document should be
indexed by a given subject heading. The good hits are the number of occurrences of a
given noun phrase in documents indexed by a particular index. The bad hits are the
number of occurrences of a given noun phrase in documents not indexed by a
particular index. Given a test document, WebDoc computes a weight to be assigned to
each index based on the noun phrases that occur in that document. The weight
assigned to a given index based on the occurrence of a particular noun phrase is given
by the formula:
weight (N, I) =
),(_),(_
),(_
INhitsbadINhitsgood
INhitsgood
+
where N represent a noun phrase and I represent an index or subject heading.
2.4 Naïve Bayes Version
The naïve Bayes version of WebDoc is based upon Bayes’ theorem for computing the
probability of a particular conclusion C given certain evidence E:
P(C|E) =
)(
)(*)|(
EP
CPCEP
This theorem allows the probability of a conclusion C given evidence E to be
computed in terms of the prior probability of the conclusion C, the prior probability of
the evidence E, and the probability of the evidence E given the conclusion C. A
Bayesian approach to classification has been used successfully in a number of
systems reported in the literature [13]. An assumption made in this approach to text
classification is that, for a given subject heading, the probabilities of phrases
occurring in a document are independent.
During the training of the WebDoc system, the feature vector for each document in
the training set is generated and stored in the knowledge base. The prior probability of
a given subject heading C
i
is calculated using the formula:
P(C
i
) =
documentsallforgeneratedindexesofnumbertotalthe
headingsubjecttheas
i
Cwithdocumentsofnumberthe
During the testing phase, WebDoc generates the feature vector X for a test
document. Using information available in the knowledge base, WebDoc then
calculates the value of P(X|C
i
) for that document.
In some of our experiments, we applied the Linear Good-Turing smoothing method
to remove the noise caused by a large number of 0s in our feature vectors [1]. In this
method, the probability of a given feature occurring is replaced with a smaller
probability. The sum of the smaller probabilities is subtracted from 1.0, with the
difference being distributed evenly among the unseen features (i.e., those whose
158

feature values were 0). The detailed formula of Linear Good-Turing smoothing
method is provided in [1].
Using Bayes theorem, the probability of a given feature vector X = (A
1
, A
2
, …, A
n
)
given a subject heading C
j
is:
P(X|C
j
) = P(A
1
|C
j
) *
P(A
2
|C
j
) *
…
*
P(A
n
|C
j
)
and the unconditional probability of the feature vector X is:
P(X) = P(A
1
) *
P(A
2
) *
…
*
P(A
n
)
Let x
i
represent the frequency of feature A
i
. Using logarithms in the calculations
and including the frequencies of the features as weights, we have:
log P(X|C
j
) = (x
1
/N) log P(A
1
|C
j
) + (x
2
/N) log P(A
2
|C
j
) +
…
+ (x
n
/N) log P(A
n
|C
j
)
In our experiments, we normalized the weights to fall into the range from 0 to 1.
2.5 K-Nearest Neighbors Version
The simplicity of the k-nearest neighbors (kNN) approach has resulted in its use in a
number of document classification systems [4, 11, 20]. During training, a feature
vector is generated for each training document and stored in the knowledge base.
During testing, the feature vector for each test document is generated and compared
with the feature vector for each training document. The k documents found to be most
similar to the test document are chosen as the k-nearest neighbors. The indexes for
those documents are the candidate indexes for the test document. In earlier
experiments, we tried different values for k (i.e., 15, 30, and 50), with k=30 giving us
the best results. That is the value that we used for k in the results reported in the next
section.
The methods that we used for comparing feature vectors were described in the
earlier section on Feature Vectors. The value of ∆ used in the experiments described
here was 0.0. That is, two features were considered similar only if they occurrence
frequencies were equal.
3 Experimental Results
To evaluate the performance of the different versions of WebDoc, we used familiar
metrics from information retrieval: precision, recall, and the F-measure. Precision is
the proportion of the indexes generated by WebDoc that are correct, whereas recall is
the proportion of the correct indexes that are generated by WebDoc.
precision =
indexescorrectofnumbertotal
generatedindexescorrectofnumber
recall =
generatedindexesofnumbertotal
generatedindexescorrectofnumber
The F-measure combines precision and recall by the formula:
F
β
=
recallprecision
recallprecision
+
+
*
**)1(
2
β
β
159

When β is 0, the F-measure is the same as the precision rate. When β= +∞, the F-
measure is the same as the recall rate. Typically β is assigned a value of 1 to allow
balance between (i.e., place equal weight on) the recall and precision rates. This is the
F-measure that we use. Note that the F-measure will never exceed the average of the
precision and recall rates.
For our experiments, we had a total of 722 documents that had been downloaded
from the Web and assigned LCC subject headings by our expert classification
librarian. The documents contained a total of 737,629 noun phrases, with 107,801
unique stem forms of these phrases. There were a total of 2,047 correct indexes
assigned to these documents. On average, each document had about 1,022 noun
phrases, 149 unique stem forms of the phrases, and 3 indexes. Because of the
relatively small number of correctly indexed documents available to us, we restricted
the classifications to the highest-level subject headings under Astronomy in the LCC
subject headings hierarchy. Thus we had a total of 39 different classes (indexes) to
which the documents could be assigned. Only 21 of these 39 indexes actually
appeared in our document collection.
We used 5-fold cross-validation to divide the documents into a training set and a
test set. For each experiment that we conducted, we divided the entire collection of
documents into five partitions. Each experiment was done a total of five times, with a
different one of the five partitions used as the test set each time and the remaining
partitions making up the training set. We averaged the results on each of the five runs
for a given experiment to get the final results for that experiment.
Table 1. Summary of Experimental Results
Row
Classification
Method
Feature
Vector
Similarity
Feature
Selection
Smoothing Threshold Precision Recall
F-
Measure
1 Statistical n/a n/a n/a 0.35 61.32% 75.09% 67.51%
2 Naïve Bayes n/a none no 0.40 60.98% 71.32% 65.75%
3 Naïve Bayes n/a none yes 0.80 58.33% 79.22% 67.19%
4 Naïve Bayes n/a IDF no 0.45 60.09% 72.93% 65.89%
5 Naïve Bayes n/a IDF yes 0.80 58.02% 78.44% 66.70%
6 Naïve Bayes n/a IG no 0.40 60.76% 71.68% 65.77%
7 Naïve Bayes n/a IG yes 0.80 56.87% 77.54% 65.62%
8 Naïve Bayes n/a MI no 0.40 60.87% 71.62% 65.80%
9 Naïve Bayes n/a MI yes 0.85 63.05% 68.26% 65.55%
10 Naïve Bayes n/a χ
2
no 0.40 59.99% 71.92% 65.41%
11 Naïve Bayes n/a χ
2
yes 0.85 63.42% 69.88% 66.50%
12 kNN count none n/a 0.11 60.41% 65.87% 63.02%
13 kNN count IDF n/a 0.105 58.06% 69.04% 63.07%
14 kNN count IG n/a 0.07 56.10% 75.45% 64.35%
15 kNN count MI n/a 0.105 58.34% 67.84% 62.74%
16 kNN count χ
2
n/a 0.105 58.48% 69.16% 63.37%
17 kNN cos. coeff. none n/a 0.10 65.07% 78.74% 71.25%
18 kNN cos. coeff. IDF n/a 0.105 63.65% 78.20% 70.18%
19 kNN cos. coeff. IG n/a 0.105 64.51% 78.26% 70.73%
20 kNN cos. coeff. MI n/a 0.105 63.55% 75.81% 69.14%
21 kNN cos. coeff. χ
2
n/a 0.15 51.21% 73.23% 60.28%
160

In our experiments, WebDoc generated a set of candidate indexes for each
document based upon the weights computed for those indexes. How this computation
was done depended on which classification method was used. We used various
threshold values to filter out those candidate indexes with low weights. Here we
report the results for the threshold value that produced the best F-measure for each
combination of classification method, feature vector similarity method, and feature
selection method that we tested. The results are shown in Table 1. An entry of ‘n/a’
indicates that this was not applicable to the given classification method.
In all the approaches that we tested, decreasing the threshold for the weights of the
candidate indexes (i.e., increasing the number of candidate indexes) produced higher
recall rates at the expense of lower precision rates. For example, in many cases we
could achieve a recall rate of 100% using a threshold of 0.00, but the corresponding
precision rate would be quite low—sometimes less than 15%. The best F-measures
achieved for the different versions of WebDoc ranged from 62.74% to 71.25%, with
the recall rate in each case being somewhat higher than the precision rate. The
versions of WebDoc that used the kNN classifier and the cosine coefficient method of
determining feature vector similarity had the best F-measures, with one exception
(i.e., when the χ
2
feature selection method was used). WebDoc’s low precision rate
with the χ
2
feature selection resulted in a lower F-measure.
The statistical version of WebDoc performed almost as well as the kNN-cosine
coefficient versions, and did better than the kNN versions that used the count of
common features similarity method. The most complex of the three classification
approaches, the naïve Bayes classifier, resulted in slightly lower F-measures than the
simpler methods.
It is interesting to note that the use of smoothing did not improve the performance
of the naïve Bayes versions as one would have expected given the number of 0s in our
feature vectors. Also, the use of feature selection provided little if any improvement in
the F-measures for both the naïve Bayes and the kNN classifiers. As a matter of fact,
the best F-measure occurred with the kNN classifier that used the cosine coefficient
similarity method and did no feature selection. The lack of improvement provided by
the use of smoothing or feature selection may be due to the relatively small number of
correctly indexed documents that were available to us.
Our results compare favorably with those reported by other researchers who have
developed automated document classification systems. (See section on Related
Work.) Those researchers whose systems had higher recall, precision, and/or F-
measures than ours were not attempting to classify documents as unstructured and
varied as the Web documents that we worked with. For example, Kushmerick,
Johnston, and McGuinness achieved an F-measure of 78% for their system that
classified e-mail messages as either ‘change of address’ or ‘non-change of address’
messages[8]. Sable, McKeown, and Hatzivassiloglou achieved an F-measure of
85.67% for their kNN classifier and 79.56% for their naïve Bayes classifier, but their
classifiers were applied only to newswire stories [16].
161

4 Summary
We have described experiments conducted with different versions of WebDoc, a
system that automatically assigns Web documents to Library of Congress subject
headings based upon the text in the documents. The different versions of WebDoc
represent the use of different classification methods and different methods for
determining the similarity of the feature vectors. For the most part, WebDoc’s
performance compares quite favorably with that of other text classification systems
that have been reported in the literature, especially when compared to systems that
classify very unstructured and varied documents such as those found on the Web.
Several researchers have found improvement in the performance of their text
classification systems when they used a classification method called Support Vector
Machines (SVM) [16]. A very promising approach that has gained a lot of attention
recently is the use of kernels with SVM [21]. In future work with WebDoc, it would
be interesting to experiment with various ways of accomplishing this, comparing the
resulting performance with that of the versions of WebDoc reported here.
Acknowledgments
We are indebted to Dr. Lois Boggess and the students who worked under her direction
(Janna Hamaker, Don Goodman, and Emily Stone) for their contributions to the
WebDoc project, particularly the natural language processing component. We also
wish to express our appreciation to David Mays, who served as our expert
classification librarian and whose classifications of the Web Documents served as the
‘gold standard’ in evaluating the performance of WebDoc.
Early in our work on WebDoc, we developed a Web-based interface to our
knowledge base and made this available to the public at
http://fantasia.cs.msstate.edu/lcshdb/index.cgi. In effect this became a browser for the
Library of Congress subject headings. We have had users from all over the United
States as well as Canada and Great Britain use this browser. Some of the users are
document analysts, some are students and teachers of library science, and at least one
appears to be a builder of ontologies for a knowledge base of general ‘world
knowledge’. We welcome users of this interface, but they must understand that we
make no attempt to maintain this interface.
This work has been supported by grant number IIS973480700050383 from the
National Science Foundation.
References
1. Gale, Willam A. 1995. Good-Turing Smoothing without Tears. Journal of Quantitative
Linguistics:217-254.
2. Goldstein, Jade, Mark Kantrowitz, Vibhu Mittal, and Jaime Carbonell. 1999. Summarizing
text documents: Sentence selection and evaluation metrics. Proceedings of the 22
nd
International Conference on Research and Development in Information, pp. 121-128.
162

3. Han, Jiawei, and Micheline Kamber. 2001. Data Mining: Concepts and Techniques. San
Diego, CA: Academic Press.
4. He, Ji, Ah-Hwee Tan, and Chew-Lim Tan. 2000. Machine learning methods for Chinese
Web page categorization. Proceedings of the ACL’2000 2
nd
Chinese Language Processing
Workshop, pp. 93-100.
5. Hodges, Julia, and Jose Cordova. 1993. Automatically building a knowledge base through
natural language text analysis. International Journal of Intelligent Systems 8(9): 921-938.
6. Hodges, Julia, Shiyun Yie, Sonal Kulkarni, and Ray Reighart. 1997. Generation and
evaluation of indexes for chemistry articles. Journal of Intelligent Information Systems 7:
57-76.
7. Kupiec, Julian, Jan Pedersen, and Francine Chen. 1995. A trainable document summarizer.
Proceedings of the 18
th
Annual International ACM SIGIR Conference on Research and
Development in Information Retrieval, pp. 68-73.
8. Kushmerick, Nicholas, Edward Johnston, and Stephen McGuinness. 2001. Information
extraction by text classification. IJCAI-01 workshop on adaptive text extraction and
mining.
9. Larsen, Bjornar, and Chinatsu Aone. 1999. Fast and effective text mining using linear-time
document clustering. Proceedings of the 1999 International Conference on Knowledge
Discovery and Data Mining (KDD-99), pp. 16-22.
10. Lehnert, W., J. McCarthy, S. Soderland, E. Riloff, C. Cardie, J. Peterson, and F. Feng.
1993. Umass/Hughes: Description of the CIRCUS system used for MUC-5. Proceedings of
the Fifth Message Understanding Conference.
11. Li, Yonghong, and Anil K. Jain. 1998. Classification of text documents. Proceedings of the
14
th
International Conference on Pattern Recognition, pp. 1295-1297.
12. Lin, Shian-Hua, Meng Chang Chen, Jan-Ming Ho, and Yueh-Ming Huan. 2002. ACIRD:
Intelligent Internet Document Organization and Retrieval. IEEE Transactions on
Knowledge and Data Engineering 14(3): 599-614.
13. McCallum, Andrew, and Kamal Nigam. 1998. A comparison of event models for naïve
Bayes text classification. Proceedings of the AAAI-98 Workshop on Learning for Text
Categorization.
14. Meadow, Charles T., Bert R. Boyce, and Donald H. Kraft. 2000. Text Information
Retrieval Systems, 2
nd
edition. San Diego, CA: Academic Press.
15. Ng, Hwee Tou, Wei Boon Goh, and Kok Leong Low. 1997. Feature selection, perceptron
learning, and a usability case study for text categorization. Proceedings of the 20
th
Annual
International ACM SIGIR Conference on Research and Development in Information
Retrieval, pp. 67-73.
16. Sable, Carl, Kathy McKeown, and Vasileios Hatzivassiloglou. 2002. Using density
estimation to improve text categorization. Technical report no. CUCS-012-02, Department
of Computer Science, Columbia University.
17. Tang, Bo, and Julia Hodges, 2000. Web document classification with positional context.
Proceedings of the International Workshop on Web Knowledge Discovery and Data
Mining (WKDDM’2000).
18. Turney, P. 1997. Extraction of Keyphrases from Text: Evaluation of Four Algorithms.
Ottawa, Canada: National Research Council of Canada, Institute for Information
Technology. ERB-1051.
19. Wang, Yong. 2002. A comparative study of Web document classification methods. M.S.
project report, Mississippi State University.
20. Yang, Yiming. 1999. An evaluation of statistical approaches to text categorization. Journal
of Information Retrieval 1(1/2): 67-88.
21. Yang, Yiming and Jan O. Pedersen. 1997. A comparative study on feature selection in text
categorization. Proceedings of the Fourteenth International Conference on Machine
Learning, pp. 412-420.
163
