
A CLUSTER FRAMEWORK FOR DATA MINING MODELS
An Application to Intensive Medicine
Manuel Santos
Departamento de Sistemas de Informação, Universidade do Minho, Guimarães, Portugal
João Pereira
Escola Superior de Educação de Viana do Castelo, Viana do Castelo, Portugal
Álvaro Silva
Serviço de Cuidados Intensivos, Hospital Geral de Santo António,Porto, Portugal
Keywords: Clinical Data Mining, Clustering, Knowledge Discovery from Databases, Artificial Neural Networks, Organ
Failure, Mortality Predicting Models, Intermediate Outcomes, Intensive Medicine.
Abstract: Clustering is a technique widely applied in Data Mining problems due to the granularity, accuracy and
adjustment of th
e models induced. Although the referred results, this approach generates a considerable
large set of models, which difficult the comprehension, the visualization and the application to new cases.
This paper presents a framework to deal with the enounced problem supported by a three-dimensional
matrix structure. The usability and benefits of this instrument are demonstrated trough a case study in the
area of intensive medicine.
1 INTRODUCTION
Medical prognosis has played an increasing role in
health, namely in the critical care medicine. This
fact induced the medical community to take a more
active interest in developing models for mortality
prediction and organ failure diagnosis based on
Artificial Intelligence (AI) techniques (Hanson et al,
2001), that make possible the doctors pro-active
action. This is, as it can be easily understood, a
critical task, since the premature detection of
malfunctions in the organism may allow physicians
to respond quickly with therapy. In this context, the
existence of large Databases (DB) containing
Intensive Care Units (ICU) clinical information,
motivate and enable the application of Data Mining
(DM) techniques (Cios et al, 2002), in a Knowledge
Discovery Database process (KDD), to induce
prediction models of organ failure in a more
efficient way than other approaches (e.g., Logistic
Regression) (Gilles et al, 2001). The Sequential
Organ Failure Assessment (SOFA) (Vincent et al,
1998; Moreno et al, 1999) scores the dysfunction
degree of an organ. It can be set to values from 0 to
4 representing the organ state. Moreover, multiple
organ failure (Goris et al, 1985) highly increases the
probability of the patient’s death. This score is
evaluated by the doctors on a daily basis taking
considerable costs and time to be obtained.
Obviously, this process is fallible and dependent on
the doctor’s expertise.
Previous work in this area provided predictive
m
odels characterized by its generality, consequently,
associated to limited values of accuracy, specificity
and sensitivity. The major question concerning the
efficiency of such models is the patient individual
adjustment. This work envisages the resolution of
that bottleneck, proposing a framework for
clustering the patient’s prediction models, allowing
the disposition of a set of predictive models (e.g.,
decision trees, artificial neural networks) in a three
dimensional matrix.
Considering the admission data and other
vari
ables taken on the admission day, as well as
163
Santos M., Pereira J. and Silva Á. (2005).
A CLUSTER FRAMEWORK FOR DATA MINING MODELS - An Application to Intensive Medicine.
In Proceedings of the Seventh International Conference on Enterprise Information Systems, pages 163-168
DOI: 10.5220/0002523601630168
Copyright
c
SciTePress

Clinical Adverse Events (CAEs) occurred during the
patient’s stay in the ICU, it is possible to predict the
failure of each organ for the day following the last
day of collected data (time series). A total of 72
models were created using a data set created from
the EURICUS II study made in 42 ICUs on 9 UE
countries, between 1997 and 1999
(http://www.frice.nl). The results showed the
effectiveness of the proposed approach. Five of the
clusters presented maximum values (100%)
simultaneously for the accuracy, specificity and
sensitivity. In these kinds of patients the doctors will
get very useful support to their decisions.
The paper is organized as follows: after this
introductory considerations, the second and third
sections present the clinical data and some
definitions about events and critical events; the
fourth and fifth sections introduce the process of
data preparation, transformation and model
generation; the last two sections, preceding the
eighth one that concludes the article, are dedicated to
the results (presenting the achieved accuracies) and
to the contributions (the framework to organize the
models).
2 CLINICAL DATA
In this study a database was created based on
EURICUS II, a study made in 42 ICUs on 9 UE
countries, between 1997 and 1999. For a period of
10 months every admission to the ICU was included.
This database integrates the features related to the
case-mix (Fetter et al, 1980), namely the Age, the
Type of Admission (unscheduled surgery, scheduled
surgery and medical), the Admission Source
(Operating Bloc, Recovery Room, Emergency
Room, Infirmary, other ICU, other Hospital, other
sources), Diagnosis, Gravity Index defined by
SAPSII (Le Gall et al, 1993), SOFA of each Organ
System (Respiratory, Coagulation, Liver,
Cardiovascular, Central Nervous and Renal),
Mortality in the ICU and in the Hospital; Number of
CAEs for each of the parameters monitored
continuously, Length of Stay and Admission Day.
By definition, an organ is considered to fail when
its SOFA score is higher or equal than 3 in a 0 to 4
scale.
In this study, from the 5355 patients admitted to
the ICUs only 4425 (82.63%) stayed for two or more
days, 3105 (57.98%) stayed three or more days and
2329 (43.49%) four days or over. For the data
concerning the fifth day of stay, only 1845 (34.35%)
patients were considered.
3 CLINICAL ADVERSE EVENTS
Events (Ev) or Critical Events (CrEv) are the
occurrences of values out of the established limits
for the four physiologic variables that are monitored
continuously. These variables are the Heart Rate
(HR), the Systolic Blood Pressure (BP), the Oxygen
Saturation (SaO2) and the Urine Output (Diur). A
group of clinical specialists determined the intervals
considered normal for each one of these parameters.
Adverse events were defined as binary variables,
whose values correspond to one of two situations, in
that the variable is within or not of the established
limits (if yes, by how long). We considered as an
Event when the value of the analyzed parameter
maintains out of the limits, for a period equal or
superior to a continuous period of 10 min. (1 h. in
the case of Diur) and less than 60 min. (2 h in the
case of Diur).
It is still considered an Event when, in a
discontinuous way, values are verified out of the
limits, but that are inferior to 10 min. and in a period
of time of 30 min. maximum, since the sum of those
is greater or equal to 10 min.
The definition of Critical Event is similar to the
Event, but with different values. The times of 10
min. referred in the definition of Events, should be
replaced by 1 hour, the 30 min. for 2 hours and when
we refer to Diur, we consider 2 hours instead of 1
respectively.
A Critical Event can also be defined in some
special situations, i.e., when the value of the
analyzed parameter places among certain values.
We only can consider a new event, after a
recovery period of 30 min. or more for BP, SaO2
and HR, and of 2 hours or more for Diur, with
values inside of the intervals. In Critical Events, it
should be considered a period greater than 2 hours
for Diur and greater than 60 minutes for the
remaining ones.
4 DATA PREPARATION
A data preparation phase has been necessary to treat
the wrong or omitted data. Besides, not all the
variables were considered to generate the prediction
models, as it is the case of the age, once it is already
considered within SAPSII score.
Table 1 shows the variables that were considered
in this study and their description. For modelling
purposes, six new binary variables were created,
based in the six SOFA values, according to the
expression:
0 , if SOFA
Org
< 3 (false, no organ failure)
1 , else (true, organ dysfunction)
ICEIS 2005 - ARTIFICIAL INTELLIGENCE AND DECISION SUPPORT SYSTEMS
164

where org ∈ {Respiratory, Coagulation, Liver,
Cardiovascular, Central Nervous, Renal } stands for
the organ system.
Table 1: Variables Description
* Not considered for the prediction models. They
were only considered to build the clustering
framework.
** Dependent variables.
*** Variables just considered in the first day.
Once we intend to predict an organ failure in a
certain day, based in the data of previous days, it
was necessary to transform the database structure, in
order to capture a temporary sequence of the
variables (time series).
The variables AdmFrom, AdmType, SapsII and
Diagn are obtained once (in the first day) but their
values are considered in all situations of organ
failure predictions.
For the construction of the various models, the
SOFA values were not considered as input. Instead
the number of Events and Critical Events registered
for these two days were considered for the
prediction in cause.
We just considered a temporary horizon of five
days, because, in medical terms, the fifth day of stay
in an ICU is considered a critical point in terms of
the evolution of the patient's clinical state. The first
day was not considered for prediction purposes,
once the goal is to predict organ failure based on the
data collected in the previous days. However, it is
considered as input for all the other ones.
5 MODELS DEFINITIONS AND
CONSTRUCTION
Making use of SPSS Clementine tool
(http://www.spss.com), we submitted the database to
a Kohonen Network (Kohonen, 1995), to segment it
in three distinct groups. Later, it was fallen back
upon the C5 (http://www.rulequest.com) algorithm
in way to generate a model of decision trees to
understand each one of those clusters. This way, we
obtained 3 models for each one of the dependent
variables, and for each one of the days of stay in the
ICU (18 models for each day).
Variable Description Domain
ID Patient numbe
r
*
Respirat Respiration Syste
m
{0,1,2,3,4} **
Coagulat Coagulation Syste
m
{0,1,2,3,4} **
Live
r
Liver Syste
m
{0,1,2,3,4} **
Cardiova Cardiovascular Syste
m
{0,1,2,3,4} **
Cns Central Nervous Syste
m
{0,1,2,3,4} **
Renal Renal Syste
m
{0,1,2,3,4} **
Nrbpevnt Number of
BP
Events/day {0,1,…,24}
Nrbpcriv Number of
BP
Critical {0,1,…,10}
Nrofhrev Number of HR Events/day {0,1,…,24}
Nrofhrc
r
Number of HR Critical {0,1,…,10}
Nrofo2ev Number of O2 Events/day {0,1,…,24}
Nrofo2c
r
Number of O2 C
r
itical {0,1,…,7}
Nrofurev Number of Diu
r
Events/day {0,1,…,24}
Nrofurc
r
Number of Diu
r
Critical {0,1,…,7}
Admfro
m
Admission From {1,2,…,7} ***
Admtype Admission Type {1,2,3} ***
SapsII Simplified Acute Physiology {0,1,…,118} ***
Diagn Diagnostic {0,1} ***
After having selected the most appropriated
variables to the generation of models, a Kohonen
Network was applied to the database, in order to
create two additional variables, which correspond to
the coordinates assigned at each record (identifying
the cluster that it belongs). These coordinates make
possible the partition of the patients into three
clusters. Later, applying the C5 algorithm to each
cluster is possible to generate the respective decision
tree.
The validation of those models was made
through a 10-fold cross validation method (Dubitzky
et al, 2001). Finally, the achieved results were
analysed by means of a confusion matrix, a matrix
of size L × L, where L denotes the number of
possible classes (Kohavi et al, 1998),
6 ACHIEVED ACCURACIES
The confusion matrix is a common tool for
classification analysis, this matrix is created by
matching the predicted and actual values. When L =
2, there are four possibilities (Table 2): the number
of correct positive - True Positive (TP), correct
negative - True Negative (TN), incorrect positive -
False Positive (FP); and incorrect negative - False
Negative (FN) classifications.
Table 2: The 2 × 2 confusion matrix
↓ actual / predicted → Negative Positive
Negative TN FP
Positive FN TP
From this table, three accuracy measures can be
defined (Essex, 1995): the true Positive Rate (PR),
also known as sensitivity, recall and Type II Error;
the true Negative Rate (NR), also known as
specificity, precision and Type I Error; and the
Predictive Accuracy (PA), which gives an overall
evaluation.
A CLUSTER FRAMEWORK FOR DATA MINING MODELS - An Application to Intensive Medicine
165
These metrics can be computed using the
following equations:
x100%
TPFN
TP
PR
+
=
x100%
FPTN
TN
NR
+
=
x100%
TPFNFPTN
TPTN
PA
+++
+
=
In the Table 3, we can see the results of the
predicting models of the fifth day of stay.
Table 3: Results for the fifth day
As we can see, the accuracies achieved are quite
good, in some situations, we achieved the maximum
values (100%). However, these are the clusters that
have fewer patients, between 62 and 65 in a universe
of 1845. Clusters 0 and 2 contain between 649 and
1134 patients.
These results were possible due to the approach
adopted, as well as the use of misclassification costs
that allow us to specify the relative importance of
different kinds of prediction errors.
7 CLUSTERING FRAMEWORK
The Data Mining process created 72 prediction
models plus a higher order classification model
(based on a decision tree) that matches a patient to
the respective prediction model.
To deal with this complexity and to make more
explicit the relation patient vs. organ failure
prediction model, was considered a visualization
framework. In this framework, the prediction models
are denoted by:
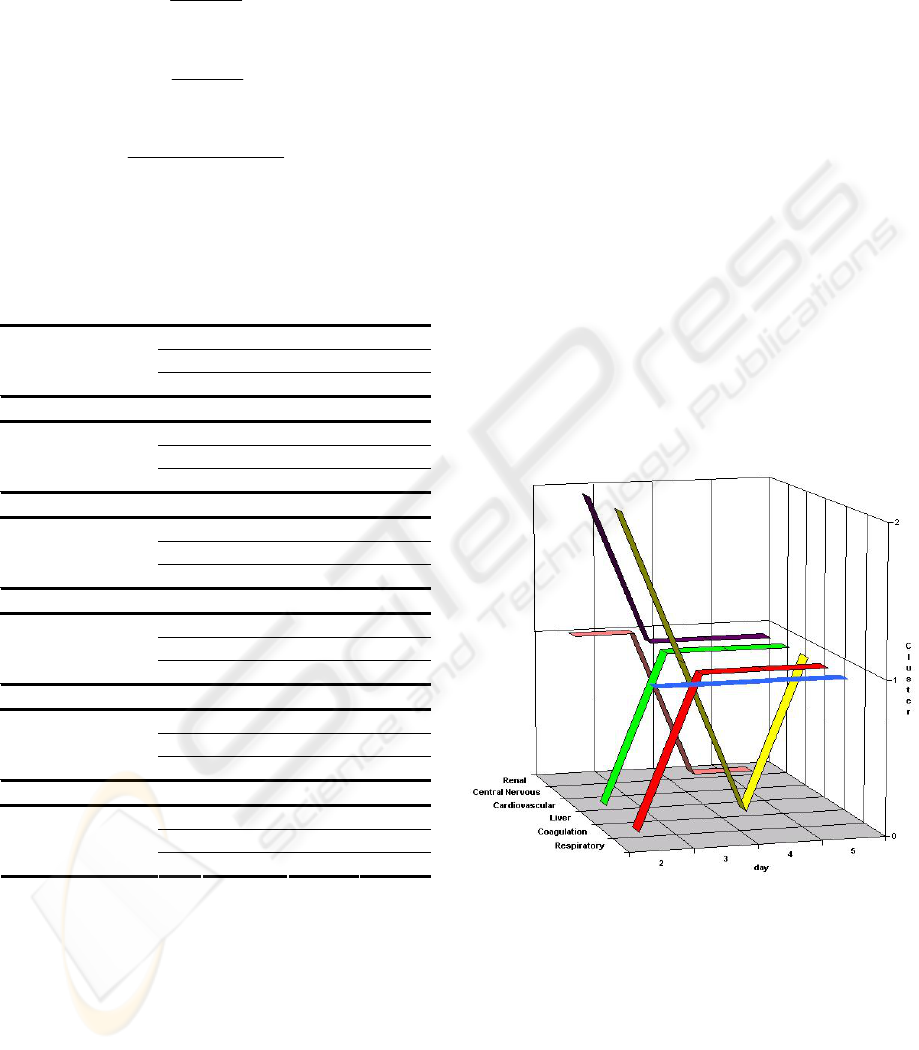
m(d, o, c, pa, se, sp)
where d ∈ {2,3,4,5} stands for the day of the
stay, o ∈ {Renal, Central Nervous, Cardiovascular,
Liver, Coagulation, Respiratory} stands for the
organ, and c ∈ {0,1,2} for the cluster. The last
arguments are the Predictive Accuracy (pa), the
Sensitivity (se), and the Specificity (sp). These
models may be organized in a cube that makes
possible the graphical presentation of the patient
course along the stay in ICU as we can see in the
Figure 1.
Cluster 0 Cluster 1 Cluster 2
PR 92,45% 100,00% 97,37%
NR 95,04% 100,00% 93,76%
Respiratory System
PA 94,43% 100,00% 94,61%
PR 100,00% 100,00% 91,67%
NR 98,51% 100,00% 99,44%
Coagulation System
PA 98,61% 100,00% 99,03%
PR 100,00% 100,00% 88,24%
NR 99,91% 100,00% 99,84%
Liver System
PA 99,91% 100,00% 99,54%
PR 94,26% 100,00% 95,73%
NR 93,07% 100,00% 96,62%
Cardiovascular
System
PA 93,29% 100,00% 96,46%
PR 93,88% 100,00% 88,98%
NR 95,51% 98,31% 95,98%
Central Nervous
System
PA 95,23% 98,44% 94,61%
PR 92,31% 100,00% 98,28%
NR 98,06% 100,00% 98,14%
Renal System
PA 97,53% 100,00% 98,15%
Figure 1: Clustering Framework
For a given patient we have a prediction model
for each one of the 6 organs (o) indexed to the day
of stay (d) and the correspondent cluster (c). Be
noticed that, in the same day, the correspondent
models of a particular patient may belong to
different clusters.
ICEIS 2005 - ARTIFICIAL INTELLIGENCE AND DECISION SUPPORT SYSTEMS
166
In the example presented in the Figure 1, the
prediction models for day 2 are given by:
m(2, Renal, 1, 97.74, 90.91, 98.19);
m(2, Central Nervous, 2, 89.10, 68.56, 93.72);
m(2, Cardiovascular, 0, 84.95, 73.91, 87.68 );
m(2, Liver, 2, 99.18, 74.19, 99.52);
m(2, Coagulation, 0, 97.35, 71.70, 98.59);
m(2, Respiratory, 1, 96.30. 90.00, 97.18).
As we can see, the prediction model for the
Central Nervous system of this patient changed from
the cluster two to cluster one, and the Predictive
Accuracy, Sensitivity and Specificity changed also.
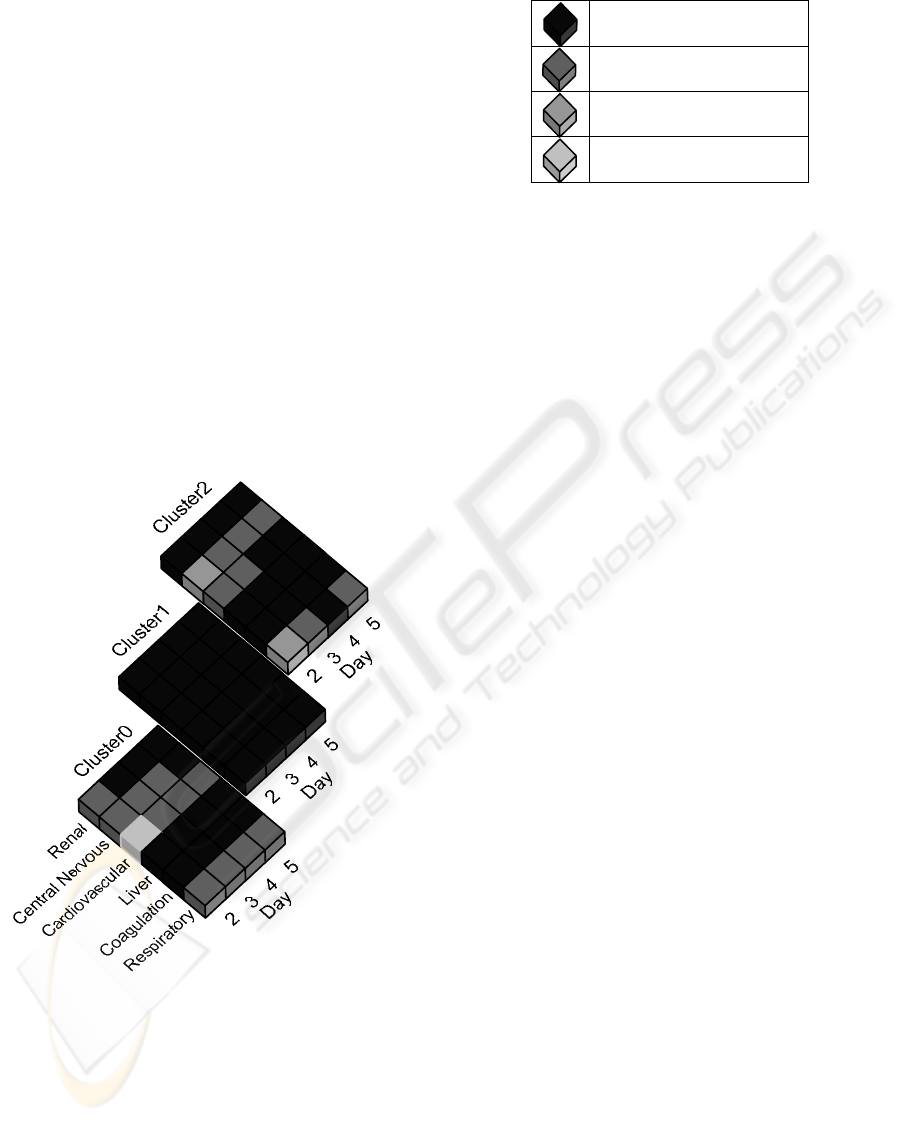
For perception convenience, this cube can be
split into three layers, one for each cluster, where the
validity of each model is represented by a grey scale
(Table 4). The darkest tone revealed higher
accuracies (as in the cluster 1).
The Figure 2 shows the Predictive Accuracies
transformed in a four tones of gray scale.
Figure 2: Predictive Accuracies
The cells correspondent to the day 5 represents
the values indicated in Table 3. The rest represent
the remaining Predictive Accuracies of the others
days of stay in the ICU. This way we can, in a visual
and easy form, distinguish the zones of interest for
prediction.
Table 4: Predictive Accuracies scale
From 95,01% to 100%
From 90,01% to 95,00%
From 85,01% to 90,00%
Up to 85,00%
The database segmentation criteria, for the third
day of stay related with the Renal system failure, can
be visualized under the form a decision tree as
following:
admtype =< 2 (1329)
admfrom =< 1 (922, 1.0) -> 0
admfrom > 1 (407)
admtype =< 1 (309, 1.0) -> 0
admtype > 1 (98, 1.0) -> 1
admtype > 2 (1776)
admfrom =< 1 (12, 1.0) -> 1
admfrom > 1 (1764, 1.0) -> 2
In this case, the variables that determined the
classification in three clusters were the Admission
Type and Admission From. The values presented
between parentheses stand for the support level and
the confidence level, respectively.
As we can see, there is only one rule that respect
to cluster 2, and two rules for each one of the
clusters 0 and 1. If the admission type is medical,
and the admission from is other then Operating Bloc,
the patient will be in the cluster 2. This rule was
applied to 1764 cases.
As we could see in the framework, the first day
of stay was not considered, once it doesn't make
sense to predict organ failure for this day, because
the only data we have was collected in the same day.
Each of the 72 models referred in the framework
correspond to decision trees generated by the C5
algorithm. Consider for example the decision tree
that predicts the Central Nervous system for the fifth
day, in the cluster 0:
sapsii =< 54 (905)
nrofhrcr4 =< 1 (870)
nrofo2ev1 =< 0 (687)
……..
nrofo2ev1 > 0 (183)
diagn =< 0 (140)
nrofhrev3 =< 0 (119)
admfrom1 =< 3 (43, 1.0) -> 0
admfrom1 > 3 (76)
nrofo2ev1 =< 4 (70)
A CLUSTER FRAMEWORK FOR DATA MINING MODELS - An Application to Intensive Medicine
167

As we could see in the tree, we could say that if a
patient has a SAPSII score less than 54, equal or less
than one critical events of heart rate in the fourth
day, at least one event of O2 in the first day, with a
diagnostic non operative, no events of heart rate in
the third day, and with admission Source of
Operating Bloc, Recovery Room or Emergency
Room, the central nervous system will not be in
failure.
This is the kind of information that is really
important in an ICU environment in a decision
support context.
8 CONCLUSIONS AND FURTHER
WORK
In this study, we presented a clustering framework,
with the purpose of identifying and applying the
model generated for the cluster in which a patient
frames to, according to his characteristics. The
majority of the models revealed high accuracies,
which is very useful in a decision support context.
The gains of this approach can be summarized as
follows:
- A matrix to dispose and explore the
models;
- A system to apply the models to a
particular patient through a process based
on three indexes: the day, the organ and the
cluster;
- An explicit way to declare the best and the
worst predictive zones (models) based on
assessment metrics such the accuracy, the
specificity and sensitivity. The doctors
know exactly what is the value and
usability of the models and its prediction.
- An alternative or complementary formalism
of knowledge representation and
visualization for decision support.
Further work will include the study of meta-
learning techniques in order to maintain the matrix
in dynamic environments (as the ICU), as well the
graphic technologies to support the visualization and
interaction with the framework, enabling the
construction of intelligent decision support systems.
REFERENCES
Cios K., Moore G., 2002. Uniqueness of Medical Data
Mining. Artificial Intelligence in Medicine.
Dubitzky W., Granzow M., Berrar D., 2001. Data Mining
and Machine Learning Methods for Microarray
Analysis, Methods of Microarray Data Analysis. In
CAMDA'00, 5-22, Kluwer Academic Publishers.
Elkan, Charles, 2001. The foundation of Cost-Sensitive
Learning. Proceedings of the Seventeenth
International Joint Conference on Artificial
Intelligence.
Essex-Sorlie D., 1995. Medical Biostatistics &
Epidemiology: Examination & Board Review.
McGraw-Hill .
Fetter RB, Shin Y, Freeman JL, et al, 1980. Case-mix
definition by diagnosis-related groups. Medical Care
18, 1-53.
Gilles Clermont, Derek C. Angus, Stephen M. DiRusso, et
al, 2001. Predicting hospital mortality for patients in
the intensive care unit: A comparison of artificial
neural networks with logistic regression models.
Critical Care Medicine, Volume 29, Number 2,
291:296.
Goris RJ, te Boekhorst TP, Nuytinck JK, Gimbrere JS,
1985. Multiple organ failure. Generalized
autodestructive inflammation? Arch Surg, 120:1109–
1115.
Hanson William C., Marshall Bryan E., 2001. Artificial
Intelligence applications in the intensive care unit.
Critical Care Medicine, Volume 29, Number 2,
427:435.
Kohavi R. and F. Provost, 1998. Glossary of Terms.
Machine Learning, 30(2/3):271–274.
Kohonen, T., 1995. Self-Organizing Maps. Springer-
Verlag.
Le Gall JR, Lemeshow S, Saulnier F., 1993. A new
simplified acute physiology score (SAPS II) base on an
European/North American multicenter study. JAMA
270:2957-2963.
Moreno R., Vincent J-L., Matos R. et al, 1999. The use of
maximum SOFA score to quantify organ
dysfunction/failure in intensive care. Results of a
prospective, multicentre study. Intensive Care Med 25,
686-696.
Vincent J., De Mendonça A., Cantraine F. et al, 1998. Use
of the SOFA score to assess the incidence of organ
dysfunction/failure in intensive care units: results of a
multicenter, prospective study. Critical Care Medicine,
Volume 26, 1793-1800
.
ICEIS 2005 - ARTIFICIAL INTELLIGENCE AND DECISION SUPPORT SYSTEMS
168
