
QUANTITATIVE EVALUATION OF ENTERPRISE
ARCHITECTURAL PATTERNS
Tariq Al-Naeem
1
, Feras A. Dabous
2
, Fethi A. Rabhi
2
, and Boualem Benatallah
1
1
School of Computer Science and Engineering, University of New South Wales, Sydney, Australia
2
School of Information Systems, Technology, and Management, University of New South Wales, Sydney, Australia
Keywords: Quantitative Evaluation, Enterprise Architectural Patterns, and Multiple-Attribute Decision Making.
Abstract: The implementation of enterpris
e and e-business applications is becoming a widespread practice among
modern organizations. A cornerstone activity in implementing such applications is the architectural design
task, which embodies many architectural design decisions. What makes this task quite complex is the
presence of several design approaches that vary considerably in their consequences on various quality
attributes. In addition, the presence of more than one stakeholder with different, often conflicting, quality
goals makes the design process even more complex. To aid in the design process, this paper discusses a
number of alternative architectural patterns that can be reused during the enterprise architectural design
stage. It also proposes leveraging Multiple-Attribute Decision Making (MADM) methods, particularly the
AHP method, to quantitatively evaluate and select among these patterns.
1 INTRODUCTION
The architectural design of enterprise applications is
greatly considered to be a complex activity
(McGovern et al, 2003). This is mainly due to the
intrinsic requirement of such applications, which is
to support multiple Business Processes (BPs) that
often utilize functionalities embedded in disparate
enterprise systems and applications.
When implementing such applications, there are
o
bviously a number of crucial design issues that
need to be addressed (Al-Naeem et al, 2004, 2005).
This includes deciding about the mechanism of
implementing BPs with activities distributed across
a number of enterprise systems, choosing how to
implement new BP functionalities, deciding on
whether to leverage existing enterprise systems or
reengineer them, etc. Indeed, the choice on every
issue is greatly driven by the project context and
desired quality attributes.
The design activity is made even more complex
by the fact that
a number of stakeholders are usually
involved in the decision process since enterprise
applications often involve the integration of BPs
distributed among different systems often managed
and operated by different departments, sometimes
different organizations.
To facilitate the architectural design task, we
h
ave identified a number of alternative architectural
patterns that can be reused during the course of
designing enterprise applications. Furthermore, we
have devised a mechanism that allows stakeholders
to express their preferences on quality attributes, and
subsequently use them in ranking these patterns
according to their attainment to desired quality
preferences. In particular, we leveraged rigorous
MADM methods (Yoon and Hwang, 1995) in the
quantitative evaluation of these patterns.
2 ARCHITECTURAL PATTERNS
In this section, we present five coarse-grained
architectural patterns that can be leveraged when
developing an enterprise application comprising
multiple BPs, where each BP often involves
invoking functionalities scattered across different
systems and applications.
All five patterns share the same goal of
sup
porting a number of distributed BPs, thus every
pattern can be considered as an alternative design
option. However, each pattern might be appropriate
under certain conditions, since the applicability of
each pattern is mainly driven by the quality
398
Al-Naeem T., A. Dabous F., A. Rabhi F. and Benatallah B. (2005).
QUANTITATIVE EVALUATION OF ENTERPRISE ARCHITECTURAL PATTERNS.
In Proceedings of the Seventh International Conference on Enterprise Information Systems, pages 398-402
DOI: 10.5220/0002511703980402
Copyright
c
SciTePress

requirements desired by different stakeholders.
Since these patterns are in early stages of
development and validation, we would rather call
them proto-patterns. Due to space limitations, we
discuss these patterns informally:
Direct & Local (DL): this pattern considers
accessing the required functionalities across
enterprise systems by direct invocation using native
APIs. On the other hand, each BP implements
locally the activities that have no corresponding
functionality. This pattern is applicable when the
majority of BPs activities have corresponding
functionalities in existing enterprise systems. It is
also applicable when performance and reliability are
the major quality concerns and when redevelopment
cost of existing systems functionalities is quite high.
Direct & Shared (DS): this pattern considers
accessing the required functionalities across
enterprise systems by direct invocation through their
native APIs. It also considers implementing all
activities of BPs that have no corresponding
implementation in any of the existing systems as
shared service-based interfaces. This pattern
applicability is similar to that of DL with the
exception that the majority of BPs activities are not
being implemented in existing systems.
Wrapper & Shared (WS): this pattern considers
providing a unified service-based interface to all
functionalities embedded in all enterprise systems. It
also considers implementing all BPs activities that
have no corresponding implementation as shared
service-based interfaces. This pattern is applicable
when having the majority of BPs activities not being
implemented. It is also applicable when ease of
installation and maintenance cost are primary quality
concerns and when redevelopment cost of existing
systems functionalities is quite high.
Wrapper & Local (WL): this pattern considers
providing a unified service-based interface to all
functionalities across all enterprise systems. On the
other hand, each BP implements locally the
activities that have no corresponding
implementation. This pattern applicability is similar
to that of WS with the exception that the majority of
BPs activities having corresponding implementation.
Migrate (MG): this pattern considers replacing
existing systems with new ones. This involves
migrating the implementation of required
functionalities into shared service-based interfaces
through a re-engineering process. It is applicable
when existing systems are likely to be obsolete in
the near future, and also when maintenance cost is
expected to be high due to significant changes
required. However, the development cost for this
pattern will be far more higher that other patterns.
3 QUANTITATIVE EVALUATION
Our discussion in the previous section shows that
each alternative pattern is impacting differently on a
number of quality attributes. So, in order to evaluate
and rank these alternatives accordingly, we need to
employ some quantitative measures in scoring them
according to their satisfaction to stakeholders’
preferences on relevant quality attributes. To this
end, we borrow from existing methods from the
literature of Multiple-Attribute Decision Making
(MADM) (Yoon and Hwang, 1995). In particular,
we employ the Analytical Hierarchy Process (AHP)
method which relies on pair-wise comparison, thus
making it less sensitive to judgmental errors
common to other MADM methods.
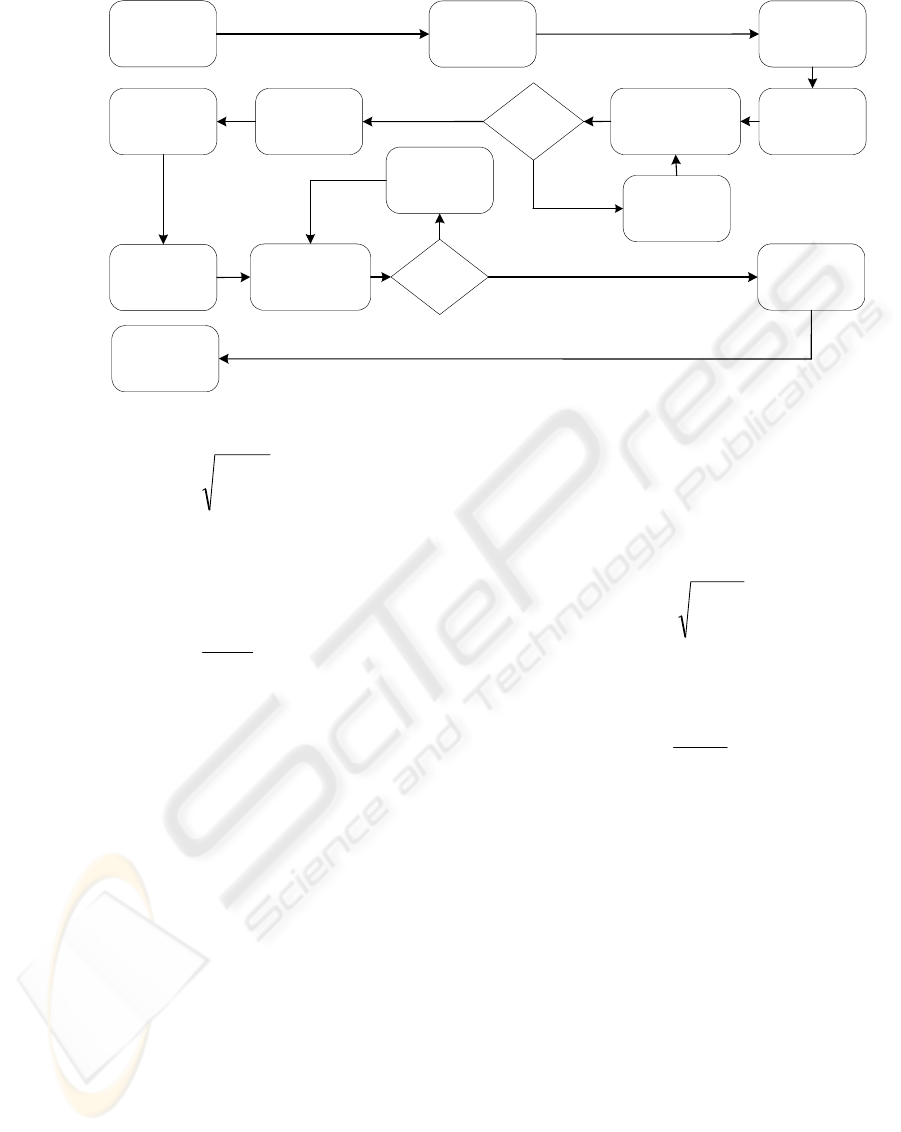
The application of AHP method comprises four
main steps as shown in Figure 1. We now formally
discuss each step:
Preparation: this step articulates the different
elements involved in the process of deciding about
design decision D
j
(
mj <=
<
=1
). It involves
identifying stakeholders involved in this decision S
1
,
S
2, …
S
u
, potential design alternatives to select from
A
1
, A
2, …
A
n
, and quality attributes used in the
evaluation process Q
1
, Q
2, …
Q
k
.
Weighting Quality Attributes: the aim of this step
is to determine the relative weight for every quality
attribute Q
z
(
kz
<
=
<
=1
). Each stakeholder S
h
(
uh
<
=
<
=1
) will need to provide their preferences
on considered quality attributes, by comparing every
pair of quality attributes (Q
a
,Q
b
), using a 9-point
weighting scale, with 1 representing equality and 9
representing extreme difference. This will be used to
determine how important Q
a
is, in comparison to Q
b
(
kba
<
=
<
= ,1
). For example, if Q
a
is considered as
"extremely more important" than Q
b
then we have
the entry (a,b)=9 and adversely (b,a)=1/9.
This means that for k quality attributes, k(k-1)/2
pair-wise comparisons will need to be made by each
stakeholder. At the end, each stakeholder S
h
will
build up a k x k matrix P
h
=( )
representing their preferences on quality attributes.
Having gathered all stakeholders’ quality
preferences P
kbaP
h
ab
<=<= ,1;
1
, P
2
, …
P
u
, we now aggregate them all
into one k x k matrix P=(
) by
computing the geometric mean for each individual
entry (a,b) using the following formula:
kbaP
ab
<=<= ,1;
u
u
h
h
abab
PP
∏
=
=
1
(1)
After that we compute the geometric mean G
a
for
every quality attribute Q
a
:
QUANTITATIVE EVALUATION OF ENTERPRISE INTEGRATION PATTERNS
399
Identify
participating
stakeholders
Identify relevant
quality attributes
Consider first
stakeholder
Aggregate all
stakeholders'
preferences on
quality attributes
Derive quality
attributes'
weights
Gather stakeholder’s
relative preferences
on quality attributes
Other
stakeholders
remaining
Yes
No
Consider next
stakeholder
Preparation
Weighting
Quality Attributes
Weighting
Alternatives’
Quality Support
Computing
Value Scores
Consider first
quality attribute
Consider next
quality attribute
Acquire
alternatives’ relative
support to current
quality attribute
Other quality
attributes
remaining
No
Yes
Derive
alternatives'
support to every
quality attribute
Compute
alternatives'
value scores
Identify potential
alternatives
Figure 1: Detailed AHP Process
k
k
z
aza
PG
∏
=
=
1
(2)
Finally, we derive the relative weight W
a
for
quality attribute Q
a
by dividing Q
a
’s geometric mean
(G
a
) by the total geometric mean for all quality
attributes:
∑
=
=
k
z
z
a
a
G
G
W
1
(3)
By applying this to all quality attributes, we
obtain a vector of quality attributes’ relative weights
where W
)1;( kaWW
a
<=<==
a
is the relative
weight for quality attribute Q
a
.
Weighting Alternatives' Quality Support
: next we
try to determine how each alternative A
i
(
) is relatively supporting quality
attributes considered. For every quality attribute Q
ni <=<=1
a
,
we will need to maintain one n x n quality support
matrix
, where every entry
(x,y) corresponds to how alternative A
),1;( nyxTT
a
xy
a
<=<==
x
is supporting
quality attribute Q
a
in comparison to alternative A
y
.
Similarly, the same 9-point weighting scale is used
for assigning weights. For example, if alternative A
x
is supporting quality attribute Q
a
"strongly more
than" alternative A
y
does, we would have the entry
(x,y)=5 and adversely (y,x)=1/5.
After constructing all quality support matrices
T
1
, T
2
, …
T
k
, we can now derive the a new nxk quality
support matrix
,
where every entry (x,a) corresponds to how
alternative A
)1,1;( kanxTT
xa
<=<=<=<==
x
is relatively supporting quality
attribute Q
a
. To build up the T matrix, we first
compute the geometric mean for every alternative A
x
at each quality support matrix T
a
, using the
following formula:
n
n
i
a
xixa
TG
∏
=
=
1
(4)
Then, we derive the relative support alternative
A
x
is having on quality attribute Q
a
using the
following formula:
∑
=
=
n
i
ia
xa
xa
G
G
T
1
(5)
Computing Value Scores: having determined the
quality attributes’ weights W and also the
alternatives’ quality support weights T, we can now
compute the value score V
ij
for alternative A
i
of
design decision D
j
using the following formula:
iz
k
z
zij
TWV
∑
=
=
1
(6)
Indeed, the alternative yielding highest value
score would represent the best alternative matching
stakeholders' preferences on quality attributes.
4 CASE STUDY
Our case study corresponds to a real capital markets
system, particularly the Australian Stock Exchange
(ASX). Trading in capital markets embodies several
ICEIS 2005 - DATABASES AND INFORMATION SYSTEMS INTEGRATION
400
BPs (e.g. trade formalization and trade execution),
with each often involving the invocation of a
number of functionalities implemented across the
different ASX enterprise systems, e.g. SMARTS,
XSTREAM, FATE, and AUDIT Explorer
(FinanceIT). Recently, a research project has been
initiated with the goal of improving the provision of
existing BP practices.
4.1 Applying AHP Method
To assess the applicability of this research, we
interviewed the Project Manager (PM) from the
development team who works very closely with the
different stakeholders of this project. This made the
PM well-positioned to provide us with the different
perspectives of the various stakeholders.
Preparation: there were three different stakeholders
involved in the decision-making process: business
managers, research teams representing system end
users, and development team. Also, five quality
attributes were suggested in the evaluation process,
namely, development cost, maintenance cost,
performance, ease of installation, and reliability.
Weighting Quality Attributes: the multiple PM’s
discussions with the different project stakeholders
made the PM able of providing us with the different
stakeholders’ quality preferences. It came of no
surprise that stakeholders were having different
views on quality attributes, resulting in different
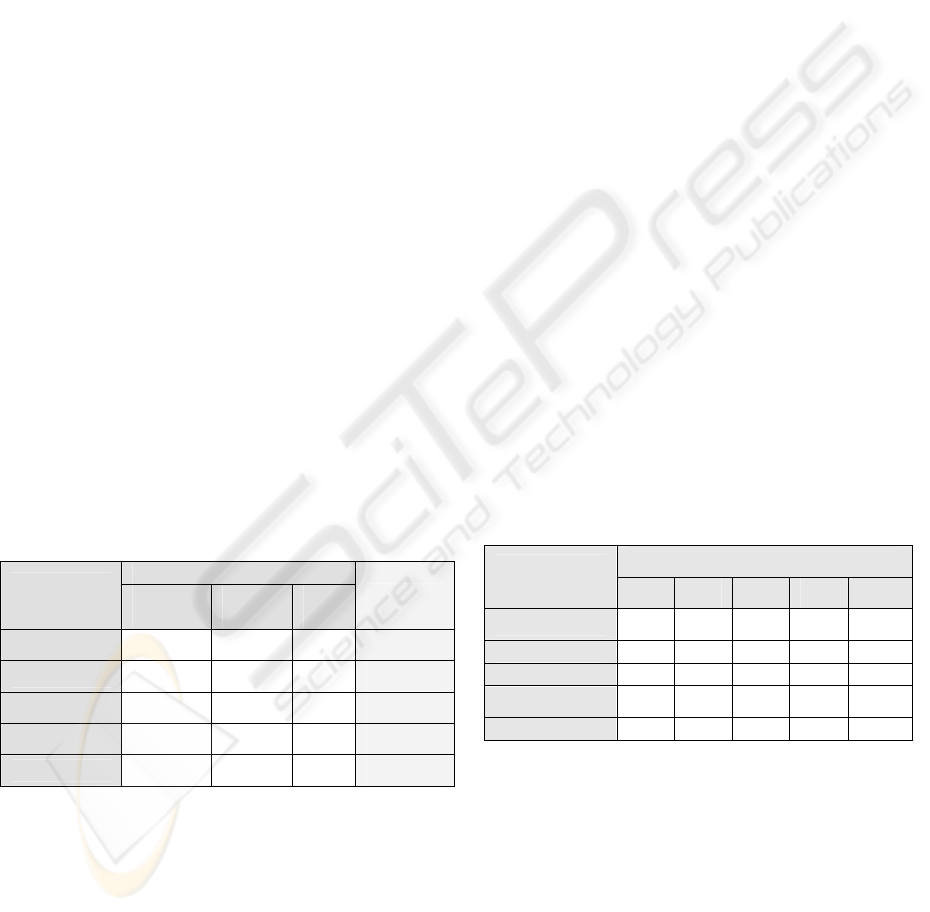
ranks as shown in Table 1. By applying Formulas 1,
2, and 3 on these preferences we obtained the
aggregated preferences (weights) on quality
attributes shown on last column of Table 1.
Table 1: Quality attributes' weights
Stakeholders
Quality
Attributes
Business
Managers
Research
Teams
Dev.
Team
Aggregated
Dev. Cost
0.400 0.031 0.378
0.195
Maint. Cost
0.202 0.208 0.220
0.240
Performance
0.074 0.149 0.079
0.111
Ease of Install.
0.041 0.140 0.052
0.077
Reliability
0.283 0.471 0.271
0.377
Weighting Alternatives' Quality Support: this
data was provided from the perspective of
development team only, because it required a
technical knowledge on the existing systems as well
as the different alternative patterns. By applying
Formulas 4 and 5 on data provided, we obtained
how every alternative relatively supports different
quality attributes as shown on Table 2.
Computing Value Scores: finally, we applied
Formula 6 to compute alternatives value score and
obtained the following rank: DS, DL, WS, MG, WL,
with value scores 0.313, 0.244, 0.199, 0.129, and
0.116 respectively.
Obtained value scores were highly sensitive to
the project context, such as the number of BPs. For
instance, if the number of BPs in the problem
context is relatively high, then this would affect the
pair-wise comparisons for the alternatives' support to
some quality attributes, particularly the development
cost. Consequently, WS and WL would have
obtained higher value scores in this case.
4.2 Discussion
The feedback we received from the PM was quite
positive. In summary, the following are the key
observations of this study:
• Established patterns have facilitated reusing and
communicating potential solutions among the
different stakeholders. This was especially true
for discussions held among the development
team members.
• Systematic synthesis of different stakeholders’
preferences has yielded aggregated weights that
were fairly acceptable to all stakeholders. In
addition, proposed approach has promoted the
involvement of stakeholders in the design
process, which in turn has improved the
acceptance chances by different participants.
• Obtained ranking results were easily justifiable
to different stakeholders due to the highly
visible decision process.
Table 2: Alternative patterns' support weights
Alternative Patterns
Quality
Attributes
DL DS WS WL MG
Dev. Cost
0.273
0.478 0.031 0.117 0.102
Maint. Cost 0.059 0.088 0.482 0.142 0.229
Performance 0.546 0.200 0.078 0.125 0.051
Ease of Install. 0.039 0.058 0.236 0.135 0.533
Reliability 0.300 0.433 0.137 0.094 0.035
5 CONCLUSION
In this paper, we have presented five enterprise
architectural patterns that can be reused in contexts
involving a number of BPs scattered among various
applications and enterprise systems. We have also
proposed and formalized a quantitative selection
approach that aids participating stakeholders to
determine an architectural alternative that best
matches their desired quality attributes.
QUANTITATIVE EVALUATION OF ENTERPRISE INTEGRATION PATTERNS
401

Our future plans are to develop suitable quality
measurement models that can subsequently be
employed in the quantitative evaluation process.
This would enable the automatic computation of
alternatives’ impacts on quality attributes without
the need for pair-wise comparisons by development
team. Indeed, this would first require implementing
a tool to automate this process.
REFERENCES
Al-Naeem, T. et al, 2004. Systematic Approaches for
Designing B2B Applications. In International Journal
of Electronic Commerce (IJEC), 9(2).
Al-Naeem, T. et al, 2005, A Quality-Driven Systematic
Approach for Architecting Distributed Software
Applications, Accepted in 27
th
Int’l Conf on Software
Eng (ICSE'05), St Louis, Missouri, USA.
FinanceIT Research Group, The University of NSW.
http://www.financeit.unsw.edu.
McGovern, J. et al, 2003, The Practical Guide to
Enterprise Architecture, Prentice Hall.
Yoon, K.P., and Hwang, C., 1995. Multiple Attribute
Decision Making: An Introduction, Sage Publications.
ICEIS 2005 - DATABASES AND INFORMATION SYSTEMS INTEGRATION
402
