
A COSMIC-FFP APPROACH TO ESTIMATE WEB
APPLICATION DEVELOPMENT EFFORT
Gennaro Costagliola, Sergio Di Martino, Filomena Ferrucci, Carmine Gravino, Genoveffa Tortora,
Giuliana Vitiello
Dipartimento di Matematica e Informatica, Università di Salerno, Via Ponte Don Melillo, 84084 Fisciano (SA), Italy
Keywords: Web applications, size metrics, effort prediction models, empirical validation
Abstract: Web applications are constantly increasing both in complexity and number of offered features. In this paper
we address the problem of estimating the effort required to develop dynamic web applications, which
represents an emerging issue in the field of web engineering. In particular, we formalize a method which is
based on the main ideas underlying COSMIC-FFP (Cosmic Full Function Point), which is an adaptation of
the Function Point method, especially devised to tackle real-time and embedded applications. The method is
focused on counting data movements and turns out to be suitable for capturing the specific aspects of
dynamic web applications which are characterized by data movements to and from web servers. The method
can be applied to analysis and design documentation in order to provide an early estimation. We also
describe the empirical analysis carried out to verify the usefulness of the method for predicting web
application development effort.
1 INTRODUCTION
In the last years, the introduction of novel
technologies and standards for the web has led to a
deep change in the scenario of traditional
information systems. Indeed, the availability of both
bandwidth for Intranet/Extranet, and new web
solutions (EJB, .NET, SOAP, etc…), allowed
developers to create “web applications”, i.e.
applications able to run in a web browser. Among
major advantages of this approach, it permits to
deploy applications without caring of the client
platform, it fully exploits the MVC architecture, and
it allows different applications to easily interoperate,
by using standard communication protocols and
languages, such as XML.
However, the sudden availability of such many
solutions has created a gap between traditional
software engineering and development approaches.
The discipline of web engineering is quickly
bridging such a gap, but however a lot of research is
still needed. In particular, currently in the literature
there are very few works addressing the problem of
estimating the effort required to develop dynamic
web applications.
This represents an emerging issue in the field of web
engineering, due to the dramatic increasing of
complexity and size of dynamic web applications,
such as e-commerce or back-office platforms, and
the consequent demand for tools supporting project
development planning with reliable cost and effort
estimations (Baresi et al., 2003), (Despande, 2002),
(Mendes et al., 2002) (Rollo, 2000) (Reifer, 2000,
2002. In the context of traditional software systems,
Function Points (FP) have achieved a wide
acceptance to estimate the size of business systems
and to indirectly predict the effort, cost and duration
of their projects (Albrecht, 1979). However, it is
widely recognized that such method is no longer
adequate for web-based systems, since it is not able
to capture the specific features affecting the size and
the effort required for those systems, namely scripts,
applets, multimedia components, etc. (Morisio et al.,
1999), (Ruhe et al., 2003), and there is an inherent
difficult to apply the method (Rollo, 2000).
Nevertheless, the appealing features of the FP
approach have motivated recent proposals of
adaptation/extension of the method, meant to exploit
its main ideas in order to predict the size of web
applications. In particular, Web Objects represent an
extension of FP, especially conceived for web
systems (Reifer, 2000), (Ruhe et al., 2003), which is
80
Costagliola G., Di Martino S., Ferrucci F., Gravino C., Tortora G. and Vitiello G. (2005).
A COSMIC-FFP APPROACH TO ESTIMATE WEB APPLICATION DEVELOPMENT EFFORT.
In Proceedings of the First International Conference on Web Information Systems and Technologies, pages 80-87
DOI: 10.5220/0001234100800087
Copyright
c
SciTePress

Functional Users
Requirements
Functional
Process Type
Sub-Process Type
Data Movement
Type
Data Manipulation
Type
Software
(a) (b)
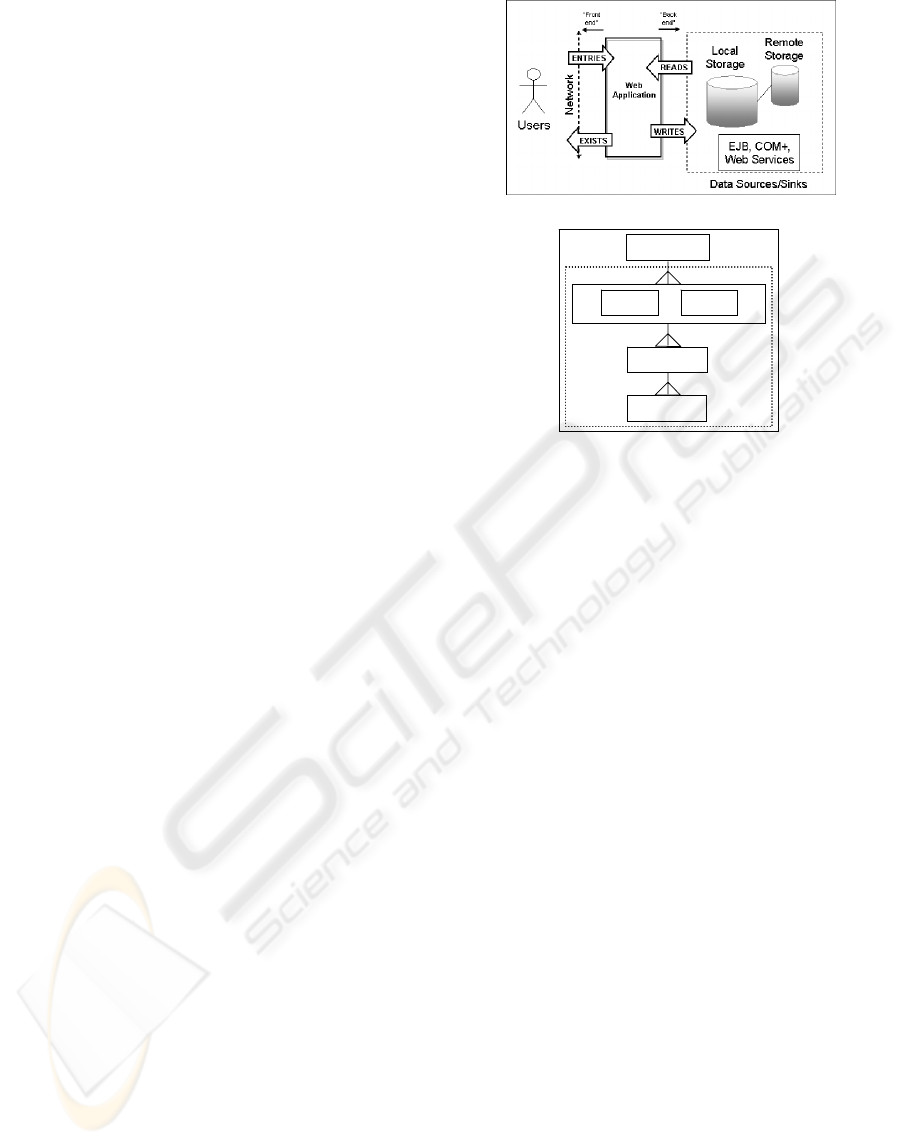
Figure 1: Generic flow of data attributes from functional perspective (a), and generic software model for measuring the
functional size (b) (COSMIC-FFP, 2003)
characterized by the introduction of four new web-
related components (multimedia files, web building
blocks, scripts and links) added to the five traditional
function types of FP. A different solution was
outlined by Rollo, who employed COSMIC-FFP, an
adaptation of FP originally defined for real-time
applications, to measure functional size of an
Internet bank system (Rollo, 2000).
Following his suggestion, in (Mendes et al., 2002)
the authors provide a formal method which adopts
COSMIC-FFP to measure size of static hypermedia
web applications. In the paper we propose to apply
the COSMIC-FFP method to estimate the functional
size of dynamic web applications. Since COSMIC-
FFP measure is focused on the counting of data
movements, it turns out to be particularly suitable
for client-server applications, which are
characterized by large amounts of data movements.
To provide an early size estimation, we propose to
apply the method on analysis and design documents.
In particular, to count the data movements from the
analysis documents we suggest to exploit the
approach provided by Jenner to estimate the
functional size of object oriented systems (Jenner,
2002). The approach considers sequence diagrams
describing use cases and provides a set of rules for
automating the counting of data movements.
Moreover, to count data movements from design
documents, we extend the proposal by Mendes et al.,
by defining a set of rules that allow us to measure
functional size of dynamic applications, using class
diagrams.
In the paper we also report on an initial empirical
validation of the approach, based on an Ordinary
Least-Squares (OLS) regression analysis performed
on a set of dynamic applications developed by
undergraduate students of two academic courses on
web engineering.
The rest of paper is organized as follows. In Section
2 we recall the main concepts of the COSMIC-FFP
method. In Section 3 we describe the rules to apply
COSMIC-FFP counting on sequence diagrams and
on class diagrams, respectively. Section 4 presents
the results of the empirical analysis carried out so
far. Section 5 concludes the paper giving some final
remarks and discussion on future work.
2 THE COSMIC-FFP APPROACH
The COSMIC-FFP approach involves to apply a set
of models, rules and procedures to Functional User
Requirements to obtain a numerical value which
represents the functional size of the software,
expressed in terms of CFSU (cosmic functional size
unit) (COSMIC-FFP, 2003). In order to apply the
method, two models are identified: the context
model and the software model.
The context model is used to clearly break up the
software parts that should be sized from the software
parts composing the operating environment (see Fig.
1.a). This is achieved by identifying boundaries and
illustrating the generic functional flow of data
attributes from a functional perspective. In
particular, the flow of data attributes is
characterized by two directions, back-end and front-
end, and by four distinct types of movements:
entries and exits, representing exchange of data with
user, and reads and writes, representing exchange of
data with the persistent storage hardware.
The software model is used to identify the goals of
software modules. It assumes that two general
principles hold for the software to be mapped and
measured: 1) software takes input and produces
useful output to users, and 2) software manipulates
pieces of information designated as data groups
which consist of data attributes. Then, such software
model allows us to consider the functional user
requirements decomposed in a set of functional
processes, where each process is a unique set of sub-
processes performing either a data movement or a
data manipulation (see Fig. 1.b).
The data movement sub-processes entry, exit, read,
write, which move data contained in exactly one
data group, are considered. The COSMIC-FPP
approach, then states that functional size of software
A COSMIC-FFP APPROACH TO ESTIMATE WEB APPLICATION DEVELOPMENT EFFORT
81
is directly proportional to the number of its data
movement sub-processes. Such an assumption is
justified by the nature of the software the method
was initially targeted at, namely real time
applications, which are characterized by several
movements of data.
3 APPLYING COSMIC-FFP TO
WEB APPLICATIONS
Dynamic web applications are generally
characterized by a significant amount of interactions
with users and data sources/sinks, such as databases,
or web services. Usually these interactions are
relatively easy to develop. To clarify, the
representative task encompasses the delivering of
information to the user (i.e. a shopping cart or a
confirmation of a transaction). Such information is
gained by some straightforward SQL DML
instruction executed on a (eventually remote)
database, and does not require complex
computations. This archetype holds for the most of
web application domains, such as e-commerce, e-
learning or news portal. As a result of such
considerations, dynamic web applications can be
suitably sized by counting data movements. It is
worth to pointing out that the counting of data
movements is the underlying principle of the
COSMIC-FFP method, which turns out to be very
suited to estimate functional size of a dynamic web
application, as suggested by Rollo (2000).
In this paper we propose to apply the COSMIC-FFP
method in the early phases of the development
process by exploiting analysis and design
documents, such as use cases and class diagrams. In
order to count data movements from analysis
documents, we use the adaptation of COSMIC-FFP
method for object oriented applications provided in
(Jenner, 2002), since it can be easily adopted in any
development process which utilizes UML use case
and sequence diagrams during requirement analysis.
The preliminary size estimation obtained from
analysis documents can be later refined by counting
the data movements in the design phase, when more
information is available. To this aim, we extend the
proposal by Rollo (2000) and Mendes et al. (2002),
by defining a set of rules that allow us to measure
the functional size of dynamic applications, using
class diagrams.
In particular, we suitably revised the context model
and the software model to deal with dynamic web
applications. The flow of data attributes gives rise to
the context model illustrated in Fig. 2.a.
(a)
Functional Users
Requirements
Software
Use CaseUse Case Class
Diagram
Class
Diagram
Functional
Process Type
Functional
Process Type
Sub-Process
Type
Sub-Process
Type
(b)
Figure 2: The functional flow of data attributes through
web applications (a) and a generic software model to
measure functional size of web applications (b)
Web applications, which executes on a web server,
are bounded in the back-end direction by Data
Sources/Sinks, and in the front-end direction by the
network and users:
• Data Sources/Sinks component encompasses all
the modules, objects or hardware suited to
provide or gain data from the web application,
such as a Web Service, a local file system or a
Database.
• Front end includes the Internet/Intranet network
useful to deliver to the users the services and/or
information managed by the web application.
Fig. 2.b depicts the generic software model, where
the data movement sub-processes are identified by
analyzing use cases and class diagrams obtained
from functional user requirements.
In Section 3.1 we consider analysis documentation
and describe the approach of Jenner (2002) to count
data movements, and in Section 3.2 we provide
counting rules to count data movements from design
artefacts.
3.1 Identifying Data Movements from
Analysis Documents
In the last years several proposals have been made
meant to apply the COSMIC-FFP method in order to
estimate the functional size of object oriented
applications (Bévo et al., 1999), (Diab et al., 2002),
(Jenner, 2002), (Poels, 2003). For our purpose,
special interest deserves Jenner’s approach, which
WEBIST 2005 - INTERNET COMPUTING
82

provides suitable rules to be applied on use case and,
more specifically, on the corresponding sequence
diagrams. Sequence diagrams turn out to be
especially useful for capturing the features of
dynamic web applications, highlighting the
interaction between different components.
Let us consider the use case FinalTest depicted in
Fig. 3, which is referred to a web application
designed for e-learning purposes, and the
corresponding sequence diagram shown in Fig 4.
Use Case Final Test
ID: Final Test
Actors: User
Entry condition: The user requests the final test by
registering his/her data, and the system checks the data
Flow of events:
The system prepares the final test.
The user compiles the test (by answering the multiple-
choice questions), then the system evaluates it and sends
the results back to the user.
The system stores the score and the user data into the
database.
Exit condition: the user receives the test results.
Figure 3: The use case modelling the Final test within an
e-learning course
: User : TestRequest : TestCreation : HTMLTest : Scoring : Sco re : DB
1:select()
2:request()
3:ConstructHT MLTest()
4:FillTest()
5:ToScore()
6:ConstructHTMLScore()
7:Display()
8:SaveScore()
The User
requests the the
final test
The system prepares the
test
The user submits the test
The system determines
the score
T h e system saves
the score
Figure 4: The sequence diagram for use case FinalTest of
Fig. 3
According to (Jenner, 2002), the boundary between
the user and the system is represented by the
interface objects (e.g., TestRequest in Fig. 4). Thus,
the following rules can be applied:
1. Each arrow from the actor to an interface object
corresponds to an entry, while each arrow from
an interface object to the actor corresponds to an
exit. For example, in Fig. 4 the arrow from User
to TestRequest determines an entry, and the
arrow from HTMLTest to User determines 1 exit.
2. Arrows not involving actors are used to
determine reads or writes. For instance, in Fig. 4
the arrow from TestCreation to HTMLTest
determines a read, and the arrow from SaveScore
to DB determines a write.
Let us observe that arrows from right to left between
intermediary objects representing return of data on a
read are not counted as further data movements,
since they are already considered in the
corresponding data request. The sum of data
movements is expressed in terms of CFSU. Thus,
the number of CFSU obtained from the sequence
diagram illustrated in Fig. 6 is 8 (2 entries, 1 exit, 4
reads, 1 write).
3.2 Identifying Data Movements from
Design Documents
In order to estimate the functional size of dynamic
web application on design documents, we have
considered class diagrams, expressed in terms of the
UML notation for the web proposed in (Conallen,
1999). It exploits stereotypes, tagged values and
constraints to suitably denote components that are
specific to web applications such as sever pages,
client pages, forms, client scripts, etc.
The counting of the data movement sub-processes
(entry, exit, read and write) has been obtained by
defining the following rules. In rules 2, 4, and 7, we
have a count that has been adjusted with a weight C
associated to the component and determined by
considering its influence on the development
process. In particular, C=1, means little influence;
C=2, means medium influence; C=3, means strong
influence. Thus:
1. For each client web page count 3CFSU, where 3
derives from 1 entry, 1 read and 1 exit. Indeed,
an entry is sent to the application by requesting
the client page (entry), the page is read from the
web server (read) and then shown to the user
(exit).
2. For each multimedia component, visualized after
an explicit request of the client, count C*3CFSU
where the number 3 has been determined by 1
entry, 1 read, and 1 exit. In other words, the
media is considered as another web page
downloaded from the server when it is requested.
3. For each script used to provide a functionality to
manipulate document on the client side, count 1
entry.
4. For each application executed on the client side,
count C*2CFSU where the number 2 has been
obtained as sum of 1 entry and 1 exit. The entry
is considered to run it and the exit to show it.
5. For each server side interpreted script or
compiled module used to produce a dynamic
web page, count 3CFSU, where 3 derives from 1
entry, 1 read, and 1 exit. In this case, a form
allows users to input data and request a dynamic
page (entry). The web server elaborates the input
of the user through the server-side script or
module (read) and produces a web page which is
sent to the user (exit). Moreover, count an
A COSMIC-FFP APPROACH TO ESTIMATE WEB APPLICATION DEVELOPMENT EFFORT
83
additional read if an access control is first
performed.
6. For each server side script modifying persistent
data through the web server, count 3CFSU
where the number 3 has been determined by 1
entry, 1 write and 1 exit. The user inputs data
through a form (entry), the data is written
through the web server (write) and the result is
shown to the user (exit). Count an additional
read if an access control is first performed.
7. For each reference to external applications
deployed on other servers, such as a Web
Service, a library routine, or an Enterprise Java
Bean, count C*3CFSU, where the number 3 has
been determined by 1 entry, 1 read, and 1 exit. If
the reference requires parameter passing, count
C*4CFSU, where 4 derives from 1 entry, 1 read,
1 write and 1 exit).
Let us note that rules 5, 6, 7 were specifically
conceived to consider dynamic aspects of web
applications, rule 2 refers to multimedia components
and rules 1, 3, 4 take into account elements common
to static web applications. In particular, the latter
rules are analogous to the ones provided by Mendes
et al. in (Mendes et al., 2002) to measure
hypermedia web applications. The sum of the
identified data movements is expressed in terms of
CFSU.
Application of the rules: an example
Now, in order to show the application of the above
rules, let us consider two class diagrams, referring
again to the web application designed for e-learning
purposes. The former is depicted in Fig. 5 and
models the activities for presenting learning objects
in a distance course. The latter, illustrated in Fig. 6,
is concerned with the final test whose use case
description was given in the previous subsection.
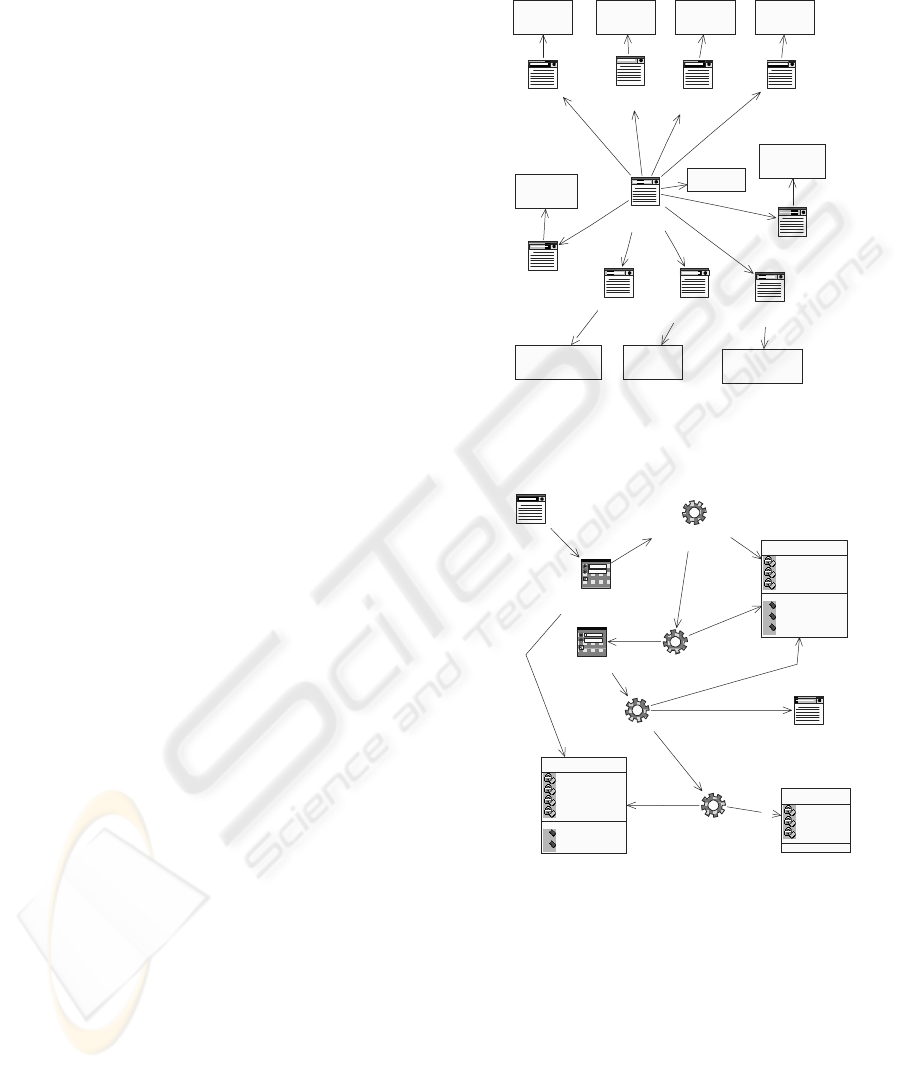
As shown in Fig. 5, from the client page HomePage,
9 client pages can be accessed, namely Intro,
Servlet, SessionCookie, JSP, JSPElements, Forms,
DataStoring, Overview and Summary. Each of those
web pages contains a request for a media which is
specified by the stereotype <<media>>. Moreover,
HomePage contains a client script.
By applying rule 1 we obtain 30 CFSUs due to the
presence of 10 client pages. The presence of a client
script in the HomePage determines the application
of rule 3, and then one more CFSU. Finally, the
application of rule 2 determines further 81 CFSUs,
since 9 media are requested by the client pages,
with an estimated weight C=3. Thus, for this class
diagram we have a total of 112 CFSUs.
Now, let us analyze the class diagram modelling the
final test activities for the given learning object (see
Fig. 6). The description of the corresponding use
case (see Fig. 4) can further support us in the
comprehension of the diagram and in the
identification of data movements.
Menu(){ }
MServlet
<<media>>
MSession
<<media>>
MJSP
<<media>>
MOverview
<<media>>
MSum mary
<<media>>
MFor ms
<<media>>
MIntro
<<media>>
MJSPElem ents
<<media>>
MDataStori ng
<<media>>
Servlet
SessionCookie JSP
Summary
DataStoring
FormsJSPElem ents
Overview
Intro
HomePage
<<Link>>
<<Link>>
<<Link>>
<<Link>>
<<Link>>
<<Link>>
<<Link>>
<<Link>>
<<Link>>
Figure 5: The UML class diagram modelling the activities
for an e-learning course
Session
LastName
Firs tName
ID
STUDENT
LastName
FirstName
ID
Score
InsertScore()
DeleteScore()
TestCreation
UserIdentification
<<Redirect>>
Score
TestForm
<<Build>>
DBUpdating
11
TEST
LastName
FirstName
ID
LoadTest()
Create_html()
ScoreCalc()
11
11
Scoring
<<Build>>
<<Redirect>>
11
FinalTest
UserRegistration
11
<<Submit>>
Figure 6: The UML class diagram modelling the final test
The user requests the final test by specifying his/her
data through the HTML form UserRegistration
contained in the client page FinalTest. The server
page UserIdentification verifies whether or not the
user is registered and the server page TestCreation
prepares the form TestForm by using the
information of the class Test. The user fills in the
form by answering the questions and submits his/her
test. Then, the server page Scoring interacts with the
database and determines the score which is sent back
to the user as an HTML page (i.e., Score).
Moreover, the server page DBUpdating inserts the
WEBIST 2005 - INTERNET COMPUTING
84
score into the database by using the user data
contained in the object Session. The presence of the
three server pages UserIdentification, TestCreation,
Scoring determines three applications of rule 5,
resulting in 9 CFSUs. Rule 6 is instead applied
considering the server page DBUpdating,
determining other 3 CFSUs. Finally, the presence of
the static web page FinalTest which contains the
HTML form UserRegistration, causes the
application of rule 1, counting further 3 CFSUs.
Thus, the total counting for the considered piece of
design documentation is 15 CFSUs.
4 EMPIRICAL EVALUATION
A statistical analysis has been performed to establish
whether the proposed applications of COSMIC-FFP
can be used to predict the development effort of web
based systems, in terms of person-hours. We have
exploited data coming from 32 web projects
developed by students during the course on Web
Engineering of two subsequent academic years. In
both cases, the most skillful students were equally
distributed among the groups in order to allow
uniformity. Each group was asked to implement a
client-server hypermedia application and to record
information on the actual effort required for the
development process in terms of person-hours.
Data of the 32 projects have been collected from the
analysis and design documentations. A descriptive
statistics has been performed both for the variable
Effort (denoted by EFH), expressed in terms of
person-hours, and the variable COSMIC-FFP
(denoted by C-FFPan when it is calculated from the
analysis documents and by C-FFPde from the design
documents), expressed in terms of CFSUs, related to
the 32 systems used. The summary statistics of those
variables are given in Table 1.
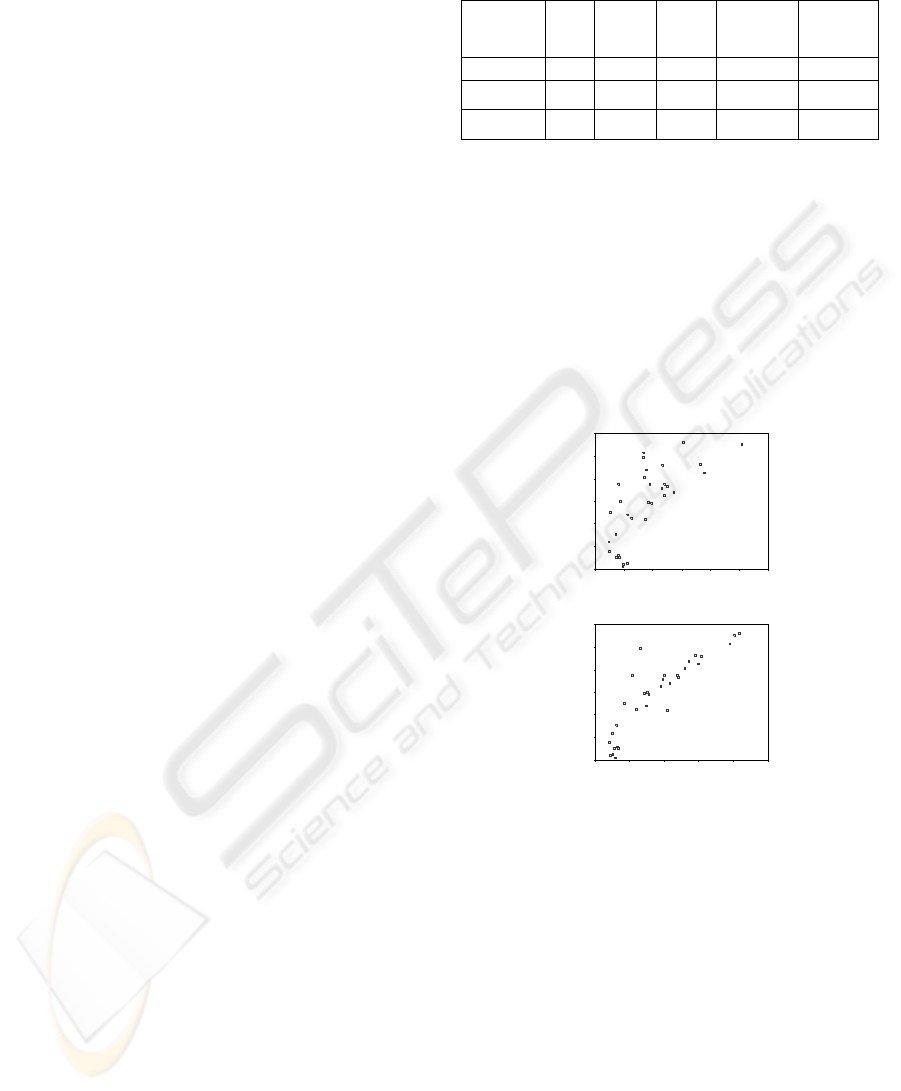
In order to perform the empirical validation of the
proposed methods, we have applied an Ordinary
Least-Squares regression analysis. Figures. 7.a and
7.b illustrate the scatter plots obtained by considering
EFH as dependent variable and C-FFPan and C-
FFPde, respectively, as independent variables. For
either measures, the scatter plot shows a positive
linear relationship between the variables involved.
This suggests that a linear regression analysis of
EFH and C-FFPan (EFH and C-FFPde, resp.) can
be performed. The linear regression analysis allows
us to determine the equation of a line, which
interpolates data and can be used to predict the
development effort in terms of the number of person-
hours required.
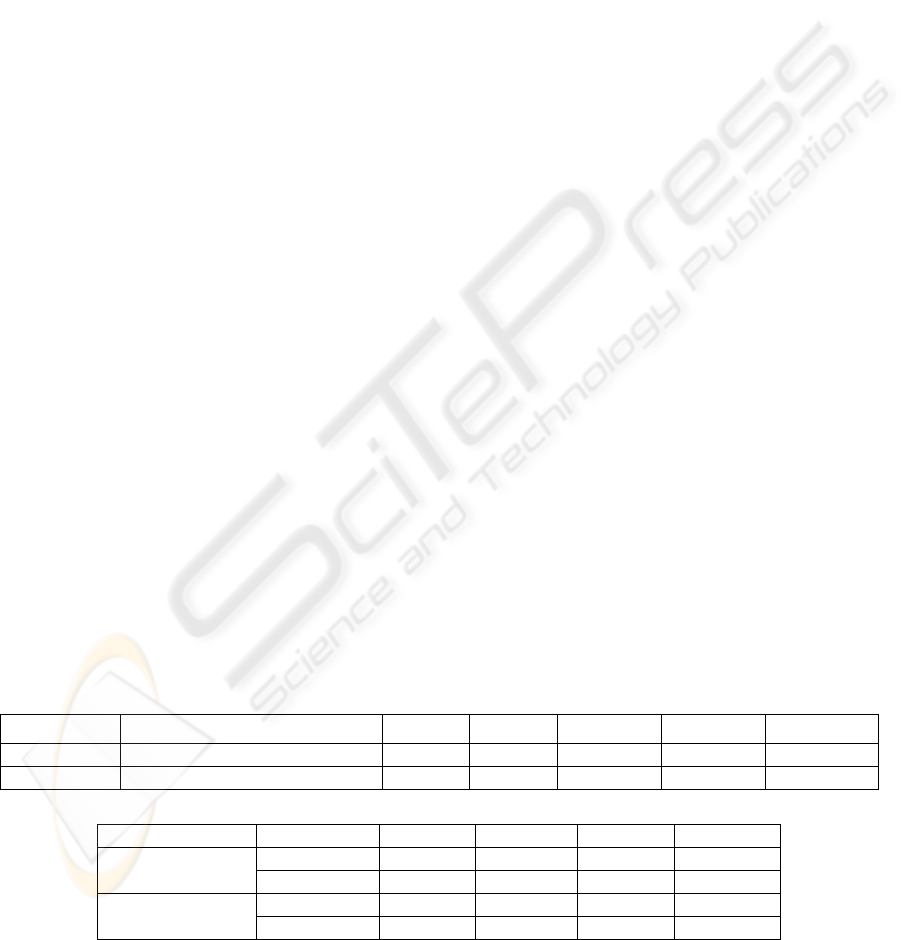
Table 1: Descriptive statistics of EFH, and size expressed
in C-FFPan and in C-FFPde
Obs MIN MAX MEAN STD.
DEV.
EFH 32 62 172 117.625 33.700
C-FFPan
32 47 509 175.594 107.975
C-FFPde
32 82 833 352.625 222.640
When applying the OLS regression, several crucial
indicators have been taken into account to evaluate
the quality of the prediction. In particular, the
goodness of fit of a regression model is determined
by the square of the linear correlation coefficient, R
2
.
Moreover, the F value and the corresponding p-
value (denoted by Signif F) are useful indicators of
the degree of confidence of the prediction.
Specifically, a high F value, together with a low p-
value indicate that the prediction is indeed possible
with a high degree of confidence.
C-FFPan
60050040030 02001000
EFH
180
160
140
120
100
80
60
(a)
C-FFPde
10008006004002000
EFH
180
160
140
120
100
80
60
(b)
Figure 7: The scatter plots for (a) EFH and C-FFPan, and
(b) EFH and C-FFPde
Moreover, for each model, we have considered the
p-values and t-values for the corresponding
coefficient and the intercept. The p-values give an
insight into the accuracy of the coefficient and the
intercept, whereas their t-values allow us to evaluate
their importance for the generated model. In
particular, a significance threshold of 0.05 for the p-
value is commonly used to establish whether a
variable is a significant predictor. In other words,
when it is less than 0.05, the variable is significant
with a confidence of 5%. As for the t-value, a
variable is significant if the corresponding t-value is
greater than 1.5. Moreover, it is useful to evaluate
the confidence interval. We can observe that the
linear regression analysis shows a high R
2
value for
A COSMIC-FFP APPROACH TO ESTIMATE WEB APPLICATION DEVELOPMENT EFFORT
85
C-FFPde, while a lower R
2
value for C-FFPan. For
C-FFPde we have R
2
=0,776, which indicates that
77.6% is the amount of the variance of the
dependent variable EFH that is explained by the
model related to C-FFPde, whereas for C-FFPan we
have R
2
= 0.523 indicating that 52,3% is the amount
that is explained by the model related to C-FFPan.
In Fig. 8.a we can observe a high F value and a low
p-value, for both measures, which indicate that the
prediction is indeed possible with a high degree of
confidence. We have also considered the p-values
and t-values for the corresponding coefficient and
the intercept (see Fig. 8.b).
The equation of the regression model for C-FFPde
obtained with this data set is:
EFH = 0.133*C-FFPde + 70.647,
where the coefficient 0.133 and the intercept 70.647
are significant at level 0.000, as from the T test. The
equation of the regression model for C-FFPan is
instead:
EFH = 0.225*C-FFPan + 78.034,
where the coefficient 0,225 and the intercept 78.034
are again significant at level 0.000.
In order to assess the acceptability of the derived
effort prediction models, we have considered the
Magnitude of Relative Error, which is defined as
MRE = |EFH
real
— EFH
pred
| / EFH
real
where EFH
real
and EFH
pred
are the actual and the
predicted efforts, respectively. The rationale behind
this measure is that the gravity of the absolute error
is proportional to the size of the observations. Such
value has been calculated for each of the 32
observations in the data set, using the models
derived for both C-FFPan and C-FFPde. We have
evaluated the prediction accuracy by taking into
account a summary measure, given by the Mean of
MRE (MMRE), to measure the aggregation of MRE
over the 32 observations. In particular, from Table 2,
we can observe that both models exhibit an MMRE
value less than 0.25. As suggested in (Conte et al.,
1986), this represents an acceptable threshold for an
effort prediction model. Moreover, we have
considered another meaningful measure, namely the
prediction at level l, defined as
PRED (l)= k /N
where k is the number of observations whose MRE is
less than or equal to l, and N is the total number of
observations. Again, according to Conte et al., at
least 75% of the predicted values should fall within
25% of their actual values. In other words, a good
effort prediction model should have PRED(0.25) ≥
0.75. This condition turns out to be satisfied by the
model derived for C-FFPde, i.e. based on design
documentation. On the contrary, the model derived
for C-FFPan indicates a lower accuracy in the
prediction. Such results are consistent with the fact
that analysis documents contain less information on
the projects, with respect to design documents.
5 FINAL REMARKS
In this paper we have proposed an approach for
estimating the functional size of dynamic web
applications, exploiting the COSMIC-FFP method,
both during analysis and design phases. Indeed, the
measure turns out to be suitable for capturing also
the dynamic aspects of such applications which are
characterized by data movements to and from web
servers. and defining appropriate procedures to
measure the functional size of software by counting
the data movements. Two sets of rules have been
provided to be applied on analysis and design
documents, respectively. In particular, sequence
diagrams are analysed by exploiting the COSMIC-
FFP rules which Jenner suggested to estimate the
size of object oriented systems (Jenner, 2002).
Conallen’s web extensions of UML class diagrams
are instead examined by applying a set of rules
which have been specifically conceived for dynamic
web applications and represent an extension of the
rules proposed by Mendes et al. for static web
applications (Mendes et al., 2002).
Prediction Model R
2
R Std Err F Signif F
C-FFPan EFH= 0.225*C-FFPan + 78.034 0.723 0.523 23.643 32.869 0.000
C-FFPde EFH=0.133*C-FFPde + 70.647 0.881 0.776 16.1969 103.962 0.000
(a)
Value Std. Err t-value p-value
Coefficient 0,225 8.072 5.733 0.000 Model for C-FFPan
Intercept 78.034 0.039 9.667 0.000
Coefficient 0.133 0.013 10.196 0.000 Model for C-FFPde
Intercept 70.647 5.425 13.023 0.000
(b)
Figure 8: The results of the OLS regression analysis for evaluating the EFH using C-FFPan and C-FFPde
WEBIST 2005 - INTERNET COMPUTING
86

Table 2: Aggregate accuracy evaluation for
C-FFPan and C-FFPde
MMRE PRED(0.25)
C-FFPan
0.18 0.72
C-FFPde
0.11 0.81
A formalization of the method has been provided by
suitably revising some basic concepts of the method,
The results of the initial empirical analysis that we
have carried out are encouraging, suggesting that the
counting of data movements can be useful for
estimating the development effort of dynamic web
applications. In particular, the application of the
method on design documents exhibits a slightly
better performance than its application to analysis
documents. This is not surprising, since during
analysis less details are usually available. For that
reason, we suggest to apply the method at the
beginning of the development process, during the
analysis phase, in order to obtain a preliminary effort
estimation, which can be later refined during design,
when further information is available, by employing
the suitable rules defined for class diagrams.
Several research directions can be planned as future
work. First of all, further analysis is needed for the
assessment of the method. Indeed, the empirical
evaluation provided in the paper has to be
considered a preliminary analysis, useful for
encouraging us in further investigation. More data
coming from the industrial world are presently being
collected, in order to obtain more reliable results.
Such data will be also used to perform a comparative
analysis with respect to other proposals, such as Web
Objects (Reifer, 2000).
Moreover, we plan to consider possible use of
adjustment factors similar to those used in the FP
approach, in order to verify their usefulness to
improve the performance of the proposed method in
the cost estimation process.
Furthermore, we focused our attention mainly on
web applications, where multimedia aspects were
marginal. It could be very interesting to tune up the
3rd rule, to better describe the efforts needed for
multimedia productions. As an example, we could
classify the digitalized media (easy to make) from
the ones created from scratch (requiring more
resources). The final result could be a taxonomy of
multimedia objects, depicting for each media the
estimated effort.
Another interesting extension of the work may come
by taking into account page templates. The sites we
considered were characterized by many structurally
different pages. Probably, if a site is composed by a
number of static pages using the same template, the
1st rule may require some tuning.
REFERENCES
Albrecht, A.J., 1979. Measuring Application Development
Productivity. In Proc. of the Joint SHARE/GUIDE/IBM
Application Development Symposium, pp. 83-92.
Baresi, L., Morasca, S., Paolini, P., 2003. Estimating the
Design Effort of Web Applications. In Proc. of the 9th
International Software Metrics Symposium, pp. 62-72.
Bévo V., Lévesque, G., Abran A., 1999. Application de la
Mèthode FFP à partir d'une spécification selon la
notation UML: compte rendu des premiers essais
d'application et questions, International Workshop on
Software Measurement (IWSM99).
Conallen, J., 1999. Building Web Applications with UML,
Addison-Wesley Object Technology Series.
Conte, D., Dunsmore, H.E., Shen, V.Y., 1986. Software
engineering metrics and models, The
Benjamin/Cummings Publishing Company, Inc.
COSMIC: COSMIC-FFP Measurement manual, version
2.2, http://www.cosmicon.com, 2003.
Deshpande, Y., 2002. Consolidating Web Engineering as a
Discipline. Software Engineering Australia, pp. 31–34.
Diab, H., Koukane, F., Frappier, M., and St-Denis, R.,
2002. McRose: Functional Size Measurement of
Rational Rose RealTime”, In Proc. of Sixth
International Workshop Quantitative Approaches in
OO Software Engineering, pp. 15-24.
Jenner, M.S., 2002. Automation of Counting of Functional
Size Using COSMIC-FFP in UML. In Proc. 12th
International Workshop Software Measurement, pp.
43-51.
Mendes, E., Mosley, N., Counsell, S., 2002. Comparison
of Web Size Measures for Predicting Web Design and
Authoring Effort”, IEE Proceedings-Software 149 (3),
pp. 86-92.
Morisio, M., Stamelos, I., Spahos V., and Romano, D.,
1999. Measuring Functionality and Productivity in
Web-based applications: a Case Study. In Proc. of the
6th International Software Metrics Symposium, pp.
111-118.
Poels, G., 2003. Definition and Validation of a COSMIC-
FFP Functional Size Measure for Object-Oriented
Systems. In Proc. International Workshop Quantitative
Approaches in OO Software Engineering.
Rollo, T., 2000. Sizing E-Commerce. In Proc of the
ACOSM 2000 - Australian Conference on Software
Measurement.
Reifer, D., 2000. Web-Development: Estimating Quick-
Time-to-Market Software. IEEE software, 17(8), pp.
57-64.
Ruhe, M., Jeffery, R., and Wieczorek, I., 2003. Using Web
Objects for Estimating Software Development Effort
for Web Applications. In Proc. of the IEEE Software
Metrics Symposium.
A COSMIC-FFP APPROACH TO ESTIMATE WEB APPLICATION DEVELOPMENT EFFORT
87
