
Mission Reliability Estimation for
Repairable Robot Teams
Stephen B. Stancliff
1
, John M. Dolan
1
and Ashitey Trebi-Ollenu
2
1
The Robotics Institute, Carnegie Mellon University, Pittsburgh, PA, USA
2
Jet Propulsion Laboratory, Pasadena, CA, USA
Abstract. NASA has expressed interest in using modular self-repairable robotic
teams for the exploration and colonization of Mars. One of the reasons often
given for using repairable robots is increased reliability. Analytical tools are
needed for estimating the reliability of robotic missions in order to determine if
this reasoning is correct, and for what types of missions. In this paper we pre-
sent the first method for analytically predicting the probability of mission com-
pletion for teams of repairable mobile robots. We then apply this method to
compare the reliability of repairable and nonrepairable robot teams for an ex-
ample mission scenario. Our results show that for this simple mission, with
reasonable assumptions regarding costs, teams of repairable robots with spare
components are superior to teams with spare nonrepairable robots.
1 Introduction
The NASA Exploration Systems, Human & Robotic Technology (H&RT) Formula-
tion Plan identifies Strategic Technical Challenges which “must be surmounted to
enable sustainable future human and robotic exploration” of our solar system [1].
These include robotic networks, modularity, reconfigurability, reusability, and redun-
dancy. The plan further identifies the need for Intelligent Modular Systems enabling
safe, affordable, effective, multifunctional robotic technologies for sustainable human
and robotic exploration to meet the U.S. National Vision for Space Exploration.
Modularity, reconfigurability, reusability, and redundancy add new complexity to
the mission design process for robotic exploration. Decisions must be made about
how to divide tasks among robots, how many robots to use, and how to configure
individual robots in order to accomplish individual tasks and overall mission goals.
A significant factor in making these decisions is the impact of robot failures on
mission completion. The literature (e.g., [2]) indicates that field robots have poor
reliability, with robots being unavailable approximately half of the time. In contrast,
the planetary rovers built by NASA have very high reliability, but this reliability is
achieved at very high cost. Sending teams of robots to Mars while keeping costs
down will require the design of robots with enough reliability to accomplish the mis-
sion but without excess reliability.
B. Stancliff S., M. Dolan J. and Trebi-Ollenu A. (2005).
Mission Reliability Estimation for Repairable Robot Teams.
In Proceedings of the 1st International Workshop on Multi-Agent Robotic Systems, pages 144-151
DOI: 10.5220/0001196701440151
Copyright
c
SciTePress

The general problem that we would like to solve is: "What is the lowest-cost con-
figuration of robots that will accomplish a given set of mission tasks with a given
probability of success?" In considering robot team configurations we wish to com-
pare repairable versus nonrepairable robots, different component reliabilities, differ-
ent repair strategies, different numbers of robots, and different numbers of spare
parts.
The only known previous work studying how cooperative repair impacts the reli-
ability of robot team missions is [3]. That paper's methods are similar to ours in be-
ing based in the reliability literature, but significantly different in assuming that repair
incurs no cost in terms of time and reliability. We contend that in most cases this cost
of repair is significant—the robots executing the repair must delay their assigned task
in order to perform a repair, and the act of repair increases their own chance of fail-
ure.
Additionally, [3] considers only cannibalistic repair, where all replacement parts
are scavenged from failed robots, and all spares are carried by the surviving robots.
Our method has been designed to be flexible with respect to the type of repair.
Finally, [3] leaves open the question of whether repairability is cost-effective. If a
repairable team can do 25% more work but increases the mission cost by 75%, then it
may not be the superior option. We incorporate cost into our evaluation method,
qualitatively in this paper, and quantitatively in future work.
In [4] we present a method for quantifying the reliability of robot modules and in-
dividual robots. In this paper, we begin to address how these reliability tools can be
used to evaluate mission design alternatives for robot teams. In Sections 2 and 3, we
outline a simple mission scenario and our method of representing it. In Section 4, we
derive analytical solutions for the probability of mission success for this mission
using repairable and nonrepairable robot teams. In Section 5, we apply our method-
ology to compare different alternatives for improving the reliability of an example
mission.
2 Problem Representation
We treat both repairable robots (RR) and nonrepairable robots (NR) as being con-
structed of multiple hardware modules. A robot might, for instance, be composed of
a computation module, a propulsion module, and a manipulation module. A robot
fails when one of its constituent modules fails. For NR, failure is terminal. For RR,
the failed module can be replaced by a spare module if one is available. The module
replacement procedure is carried out by a robot other than the failed robot.
The probability of a module's failing is found using standard reliability engineering
methods assuming a constant hazard rate. Two inputs determine the module failure
probability: the module's failure rate, often given by mean time to failure (MTTF),
and the length of time the module is operated. Ref. [4] gives more details on the
calculation of module and robot failure.
We have begun our analysis of robot mission reliability by examining a seemingly
simple mission—a group of robots must traverse together for some days, and all of
them must be functioning at the end of the traverse. We specify variants of this mis-
sion using the nomenclature (N,D,M), where N is the number of robots, D the number
of days, and M the number of spare hardware modules available. A mission with two
robots traversing for one day with no spares available is described as mission (2,1,0).
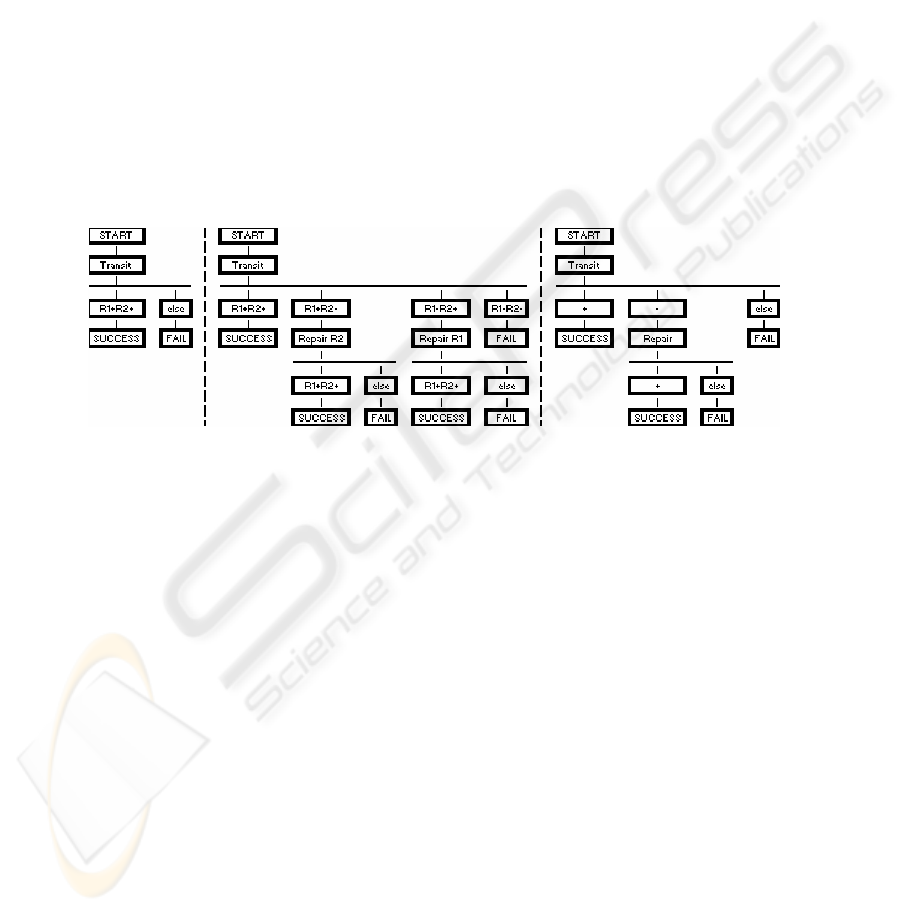
The space of all paths that could be followed by the robots can be represented in
tree form. Fig. 1 (left) shows the tree for mission (2,1,0). After a task node (Transit
in this case), the state of the robots is evaluated. Since there are no spare modules
available for (2,1,0), the mission results in failure if either robot fails.
With spare modules, not all robot failures result in mission failure, so we must ex-
amine more alternatives at each node. With two RR (Fig. 1, center), the possible
outcomes for each node are (a) both robots are alive, (b) robot 1 is alive and 2 is dead,
(c) robot 1 is dead and 2 is alive, and (d) both robots are dead. Outcome (a) causes
the robots to continue with the original (nonrepairable) plan. For (d) the mission fails
because there are no functioning robots available to perform a repair. For (b) and (c)
the robots must execute a repair sequence before returning to the original plan.
In Fig. 1 (right) we abstract further from the repair details by considering the status
of the team, rather than individual robots. The symbol "+" means that all robots are
alive, and "-" means that one or more, but not all, of the robots have failed.
Fig. 1. (left) Mission (2,1,0); (center) Mission (2,1,1); (right) Mission (N,1,1)
We can use these trees to calculate the probability of mission success (PoMS) for
the represented team configurations. The probability of reaching a leaf node is calcu-
lated by traversing from the root node to that leaf and multiplying the probabilities for
the nodes traversed. In Fig. 1 (center), the probability of reaching the second success
node is the probability that robot 1 is alive and robot 2 is dead after the Transit action
multiplied by the probability that both robots are alive after the Repair R2 action.
The PoMS is the sum of the probabilities for the three success nodes.
3 Simplifications
In our representation robot failure is assumed to occur at the end of a task. This
allows us to avoid dealing with partially completed tasks. This discretization does not
limit the resolution of the representation, because the tasks can be restated into sub-
tasks if smaller time increments are needed.
In repairing robots we ignore the different types of spare modules. The spares are
considered as a store of universal replacements. If five spares are available, we can

replace five of module A, or three of module A and two of module B, or any other
combination. We do consider module differences when calculating failures; i.e., the
different modules making up a robot contribute differently to the probability of the
robot failing. This is a significant simplification which favors the repairable teams.
We revisit this simplification in the example and intend to eliminate it in future work.
We treat all repair activities as having the same cost, in terms of failure rates. In
reality, the amount of work required to replace Module A may be different from that
for Module B. Further, under many repair scenarios the cost of repair may be a func-
tion of location, e.g., if the spare modules are kept at depots. This simplification is
reasonable if the robots carry the spares with them (which is feasible only for small
numbers of spares) and if different modules require equal effort for replacement.
We ignore simultaneous failure of modules or robots, other than complete failure
of the robot team. After each task, we ask, "did one or more (but not all) robots fail?"
If the answer is yes, then we perform a single repair, using a single replacement mod-
ule. If in fact more than one robot was calculated to fail after a task, then the addi-
tional robots are assumed to be repaired instantly and without use of resources. This
assumption is reasonable for small teams and short missions if the robots and mod-
ules are inherently very reliable since, in that case, the probability of simultaneous
failure of modules or robots is very small.
4 Analytical Solutions
For the mission described above we are able to derive a general expression for the
PoMS for an RR team in terms of N, D and M. Consider first an NR team as in Fig. 1
(left). The probability of reaching the success node is simply the probability that all
robots are alive after the transit task, i.e., P(N,1,0)=T
+
.
Moving to the configuration of Fig. 1 (right), the probability of reaching the first
success node is T
+
. The probability of reaching the second success node is the prob-
ability that a robot is dead (but not all robots are dead) after the transit task, multi-
plied by the probability that the ensuing repair task succeeds, or
+−
RT . The overall
PoMS is
+−+
+= RTTNP )1,1,( . Similarly we find that
(
)
(
)( )
+−++
+= RTTTNP 2)1,2,(
2
and
() ()( )
+−++
+= RTTTNP
23
3)1,3,( . We can generalize as
(
)
(
)
(
)
(
)
+−
−
++
+= RTTDTDNP
DD 1
)1,,(
.
(1)
Proceeding in the same way for teams with two spare modules gives
(
)
(
)
(
)
−+−+−+
++= RRTRTTNP )2,1,( ,
()
(
)
(
)
(
)
(
)
(
)
22
22)2,2,(
+−−+−++−++
+++= RTRRTTRTTTNP ,
() ()
(
)
(
)
(
)
(
)
(
)
2223
333)2,3,(
+−+−+−++−++
+++= RTTRRTTRTTTNP ,

() ()( )
(
)
(
)
(
)
(
)
22334
644)2,4,(
+−+−+−++−++
+++= RTTRRTTRTTTNP , and
() ()
(
)
(
)
(
)
(
)
(
)
22
2
11
)2,,(
+−
−
+−+−
−
++−
−
++
+++= RTTCRRTTDRTTDTDNP
D
D
DDD
,
(2)
where
2
C
D
is the number of combinations of 2 in D.
Similarly we find that
()
()
(
)
() ( )
[]
() ( )
⎪
⎭
⎪
⎬
⎫
⎪
⎩
⎪
⎨
⎧
+++
⎥
⎦
⎤
⎢
⎣
⎡
++
+=
+−
−
+−+−
−
+
−−+−
−
+
+
33
3
22
2
21
1
1
)3,,(
RTTCRRTTC
RRRTTD
TDNP
D
D
D
D
D
D
.
(3)
Examining eq. (1), (2) and (3) we determine that
() () ( ) ()
∑∑
=
−
=
−+−
−
++
⎥
⎦
⎤
⎢
⎣
⎡
+=
M
j
jM
i
ijD
j
D
D
RRTTCTMDNP
10
),,( .
(4)
We also consider teams of NR where there are spare robots. This allows us to
compare the cost of building repairable robots and sending spares versus sending
larger numbers of NR. We represent this team configuration as (n|N,D,0), where n is
the number of robots required to survive. For the configuration (2|3,D,0) we need at
least two robots out of three to survive after D days. The probability of all three ro-
bots surviving is
D
TDP )()0,,3(
3
+
= , where
+
3
T represents the probability that a team with
three members has all robots alive after the transit task. The probability that exactly
two robots survive for D days is
(
)
(
)
⎥
⎦
⎤
⎢
⎣
⎡
−
++
DD
TT
12
1 . The overall PoMS is therefore
(
)
(
)
⎥
⎦
⎤
⎢
⎣
⎡
−+=
+++
DD
D
TTTDP
123
13)()0,,3|2( .
(5)
Similarly, for four robots we get
(
)
(
)
(
)
(
)
⎥
⎦
⎤
⎢
⎣
⎡
−+
⎥
⎦
⎤
⎢
⎣
⎡
−+=
+++++
DDDD
D
TTTTTDP
22134
1614)()0,,4|2( .
(6)
5 Example Application
We now examine a simple mission design problem comparing the reliability of RR
and NR teams. We describe the mission to be analyzed, then calculate the PoMS for
alternative robot team configurations, and finally compare the cost of the alternatives.
The mission requires two robots to be alive after a six-day traverse, with
PoMS=0.99999. All robots are identical and are composed of three modules: (A)
propulsion, (B) computation/power and (C) manipulation. The MTTF for the modules
are 50000 h, 40000 h, and 30000 h, respectively, and the numbers of hours each mod-
ule is used for the Transit task are 6, 6 and 0, respectively.
The simplest available team configuration uses two NR. The probabilities of sur-
vival for each module after the Traverse task are calculated with the MTTF and usage
given above and are found to be P(S)
A
=0.99988, P(S)
B
=0.99985 and P(S)
C
=1. The prob-
ability of survival of an entire robot after the traverse action is
P(T
1
+
)=P(S)
A
·P(S)
B
·P(S)
C
=0.99973. The probability of survival of two robots after six
traverses is
P(S)=((P(T
1
+
)
2
)
6
=0.99676. Therefore, this configuration falls short of the
mission reliability requirement.
One option for improving the PoMS is to use more reliable modules. We could
meet the PoMS requirement of 0.99999 by increasing the MTTF of modules A and B
to 13,800,000 hours.
Another option is to use more than two robots, with only two robots needing to be
alive at the end of the six days. Using eq. (5) for a team of three robots yields
P(S)=P(2|3,6,0)=0.999992.
The final option we examine is to use RR and spare modules. We assume here that
the spares are carried on the robots, and ignore the negative effects of carrying those
modules on the reliability of the Transit task. During the Repair task the module
usages for the robot being repaired are A=3, B=1, C=1 (all in hrs), and the usages for
the robot performing the repair are A=3, B=3, C=2. Evaluating eq. (4) for two robots
and one spare module we find that
P(S)=0.999994.
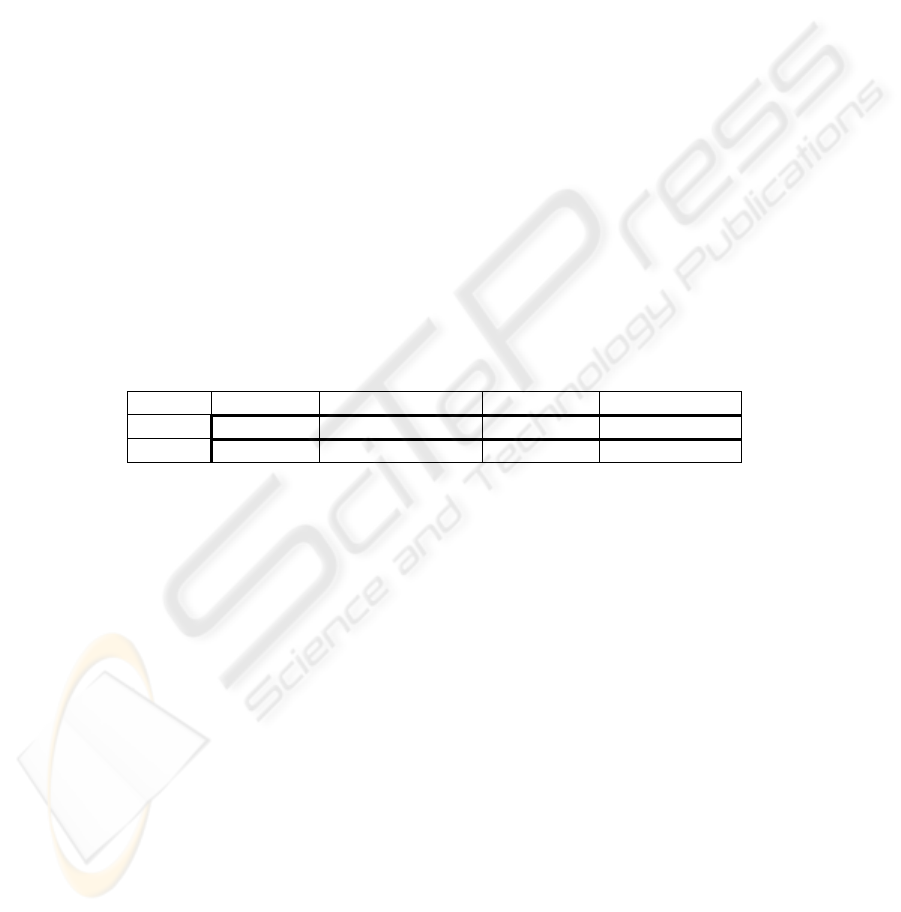
The PoMS for each configuration are shown in Table 1. The meaning of small dif-
ferences here is not intuitive, so we also provide another way of looking at them
which is "How many days can each configuration traverse with the required
P(S)=0.99999?" We see here that the base configuration fails to meet the required
mission duration and reliability, options a and b just meet the mission requirements,
and option c provides two extra days of operation above the mission requirements.
Table 1. PoMS and days of operation for each option
Base (a) Increase MTTF (b) 3NR (c) 2RR+1M
P(S) 0.99676 0.99999 0.999992 0.999994
Days 0 6 6 8
In a real-world mission design scenario we would be able to compare the expected
cost of the three options in order to determine the lowest cost alternative. Lacking
real cost information we will instead make qualitative arguments about the relative
costs of the alternatives.
Option a requires the reliability of the component modules to be increased by
three orders of magnitude. Such an increase in component reliability is unlikely,
especially for a system that has already been designed to the standards required for
planetary exploration. Even if possible, the cost of such an improvement would be
very high.
Option b requires the construction and deployment of an additional robot. The
construction cost for one additional robot should be relatively small, perhaps 25% of
the cost of developing the first robot. However, the cost to transport an additional
robot to Mars is very large, on the order of $100M.
Option c requires the addition of self-repair capabilities to the robot. We assume
here that the requisite technologies are available, so the cost is simply that of imple-
menting these technologies on the specific robot platform. We estimate that this cost
will add 25% to development costs. Option c also requires the transport of one addi-
tional robot module. This cost is significant but is much less than the cost of trans-
porting an entire robot.
We therefore conclude that option a is infeasible, and option c appears to be pref-
erable to option b when transportation costs are high. In other applications where
transportation costs are low, the costs of options b and c may be comparable, in which
case other factors would determine the choice. One factor would be the lower tech-
nological risk of option b.
A caveat here is the "universal module" simplification described earlier. This al-
lows us to replace a failed module of any type with a single spare. In reality, in order
to assure that we can replace a single failed module, we need one replacement module
of each type. In that case the transportation savings of option c over option b will
diminish significantly. However, these additional modules will also increase the
PoMS of the repairable team. This would allow us to use modules with lower reli-
ability and lower cost. The conclusion therefore remains the same—spare modules
are preferable to spare robots. Further work is needed to remove this simplification.
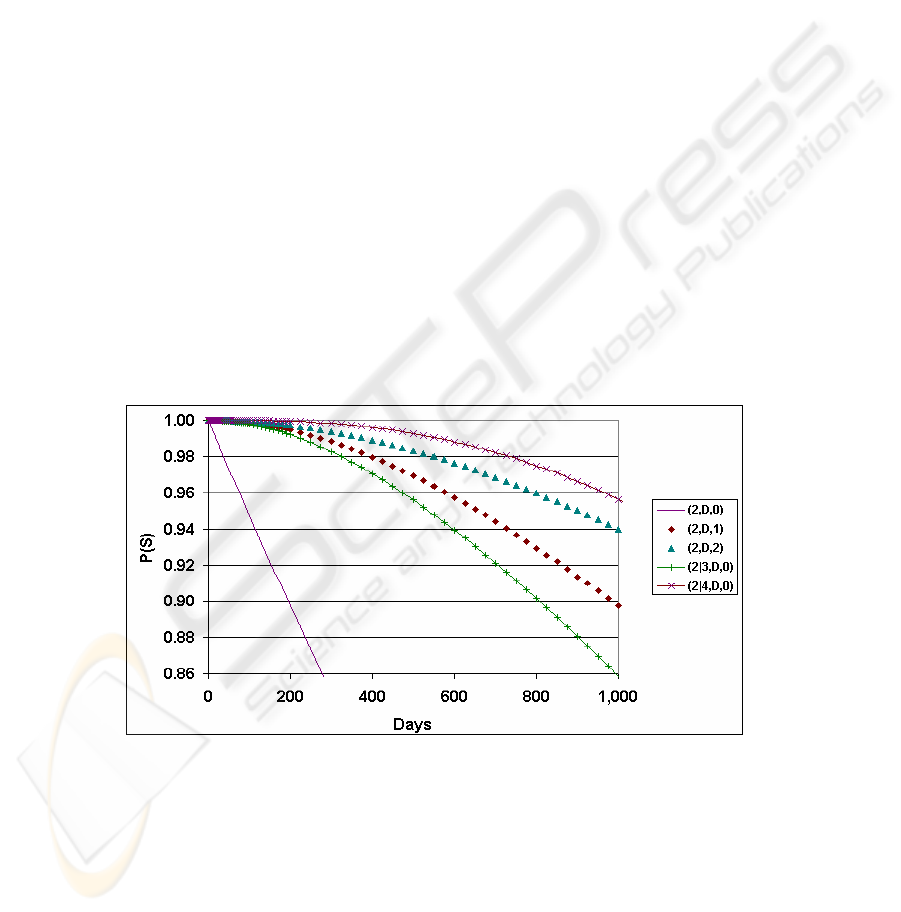
Fig. 2 compares different team configurations for missions of varying length. We
see that teams with spare NR and teams with RR plus spare modules are all far supe-
rior to the team of two NR. We also see that two RR with one spare module is
slightly better than three NR, and that two RR with two spare modules is almost as
good as four NR.
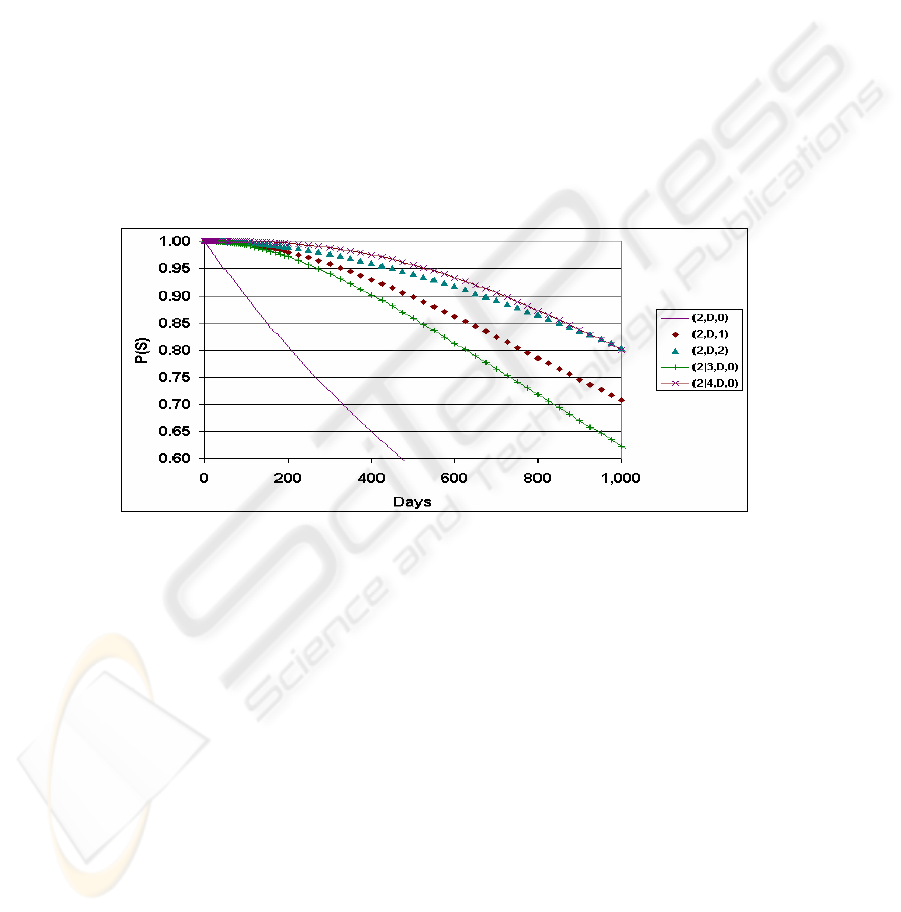
Finally, Fig. 3 shows the same team configurations and repair reliabilities as Fig. 2,
but with the MTTF of all components reduced by half. The performance of all teams
is reduced, but the RR teams are reduced less than the NR teams. This shows that the
advantage of RR teams is greater when the underlying mission (i.e., the modules and
their usage) has lower reliability.
Fig. 2. Mission success for different team configurations
6 Summary and Future Work
In this paper we present the first method for analytically predicting the PoMS for
teams of repairable and nonrepairable mobile robots. With further development, this
method and its supporting tools should allow a mission designer to make informed
comparisons between team configurations during the early stages of mission design.
We believe that the methods used in this paper can be applied to a variety of robot
mission design problems. However, the amount of work required to derive an ana-
lytical solution for even a simple mission is significant, and generating the trees them-
selves is a significant task for nontrivial missions. A focus of future work is to inves-
tigate methods for solving complex missions in an automated way.
In future work we also must address the simplifications listed in Section 3. In par-
ticular, we must differentiate the store of modules and deal with simultaneous failures
so that we can fully evaluate how many modules of each type are required to achieve
a certain PoMS.
Finally, we would like to find or develop a model of robot cost. Our goal is to be
able to make design decisions based on tradeoffs between cost and reliability. In
order to make convincing arguments about the superiority of one team configuration
over another, we need better cost estimates than the rough approximations that we
used in the example in this paper.
Fig. 3. Mission success for team configurations with decreased transit reliability
References
1. NASA (National Aeronautics and Space Administration), 2004. Human & Robotic Technol-
ogy (H&RT) Project Formulation Plan, Version 5.1. Retrieved June 25, 2005 from NASA
Exploration web site:
http://exploration.nasa.gov/documents/nova_29july04b.pdf
2. Carlson, J., and Murphy, R., 2003. Reliability Analysis of Mobile Robots. In: Proc. 2003
IEEE Int'l Conf. Robotics and Automation (ICRA 2003), September 14–19, 2003, Taipei,
Taiwan. IEEE, 274–281.
3. Bererton, C., and Khosla, P., 2002. An Analysis of Cooperative Repair Capabilities in a
Team of Robots. In: Proc. 2002 IEEE Int'l Conf. Robotics and Automation (ICRA 2002),
May 11–15, 2002, Washington, DC, USA. IEEE. 476–486.
4. Stancliff, S.B, Dolan, J.M., and Trebi-Ollennu, A., 2005. Towards a Predictive Model of
Mobile Robot Reliability. To be published as tech. report, The Robotics Institute, Carnegie
Mellon University, 2005.
