
Microsleep Detection in Electrophysiological Signals
Martin Golz
1
, David Sommer
1
and Danilo Mandic
2
1
University of Applied Sciences Schmalkalden, Department of Computer Science
98574 Schmalkalden, Germany
2
Department of Electrical and Electronic Enginering
Imperial College, London, SW7 2BT, UK
Abstract. An adaptive biosignal analysis system for the detection of microsleep
events is presented. The system was applied to the electroencephalogram and
electrooculogram recorded of 23 young volunteers while performing monotonic
overnight driving in our real car driving simulation laboratory. Biosignals
during clear observable microsleep and non-microsleep events were processed
and classified. Besides the commonly applied Periodogram method to estimate
power spectral densities we utilized the recently established method of Delay
Vector Variance. The obtained feature set was used as input vectors of
populations of Learning Vector Quantization networks which were evolved by
Genetic Algorithms. The results were compared with results from best perfor-
ming Support Vector Machines. Fusion of all recorded signals and of both
types of features led to empirical test errors down to 11.2 %. It is shown that
the proposed methodology is able to detect, but not to predict immediately
oncoming events.
1 Introduction
The detection of short-time brain states from ongoing biosignals is a challenging task
not only in the area of clinical applications but also for e.g. future human-machine-
interaction which are in the case of electroencephalogram (EEG) analysis known as
brain-computer interfaces. As a special type of such an interface one can consider a
sensor to detect short intrusions of sleep into sustained wakefulness. In case of
automobile drivers such events are believed to be a major factor in accident
causation. During the recent years this topic has received broad attention from
authorities, from the public and as well as from the research community. Most
research projects in this area, e.g. the EU projects AWAKE (2001–2004) [1] and
SENSATION (2004–2007) [2], are engaged in developing sensors to monitor driving
impairment due to fatigue and drowsiness. These impairments arise on a time scale of
some ten seconds and are typically developing as waxing and waning patterns. Some
doubts still exist about the feasibility of detecting short sleep intrusions under
demands of attentiveness in ongoing biosignals on a time scale of, say, one to five
seconds [8].
Golz M., Sommer D. and Mandic D. (2005).
Microsleep Detection in Electrophysiological Signals.
In Proceedings of the 1st International Workshop on Biosignal Processing and Classification, pages 102-109
DOI: 10.5220/0001195701020109
Copyright
c
SciTePress
Many biosignals which are more or less coupled to drowsiness do not fulfil these
temporal requirements. For example, electrodermal activity and galvanic skin
resistance are too slow in their dynamics to detect such suddenly occurring events [3].
The EEG is a relatively fast and direct functional reflection of mainly cortical and to
some low degree also of subcortical activities. Therefore, it should be the most
promising signal for microsleep detection. The electrooculogram (EOG) is a
measurement of mainly eye and eyelid movements. Their endogenous components
are coupled to the autonomic nervous system which is affected during drowsiness and
wake-sleep transitions.
We supposed that there should be characteristic short-time-stationary patterns in
both signal sources, reflecting brain microstates associated to microsleep. Using
machine learning algorithms it should be possible to detect these patterns. It is a priori
not clear how stable and how affected by disturbances they are.
2 Experiments
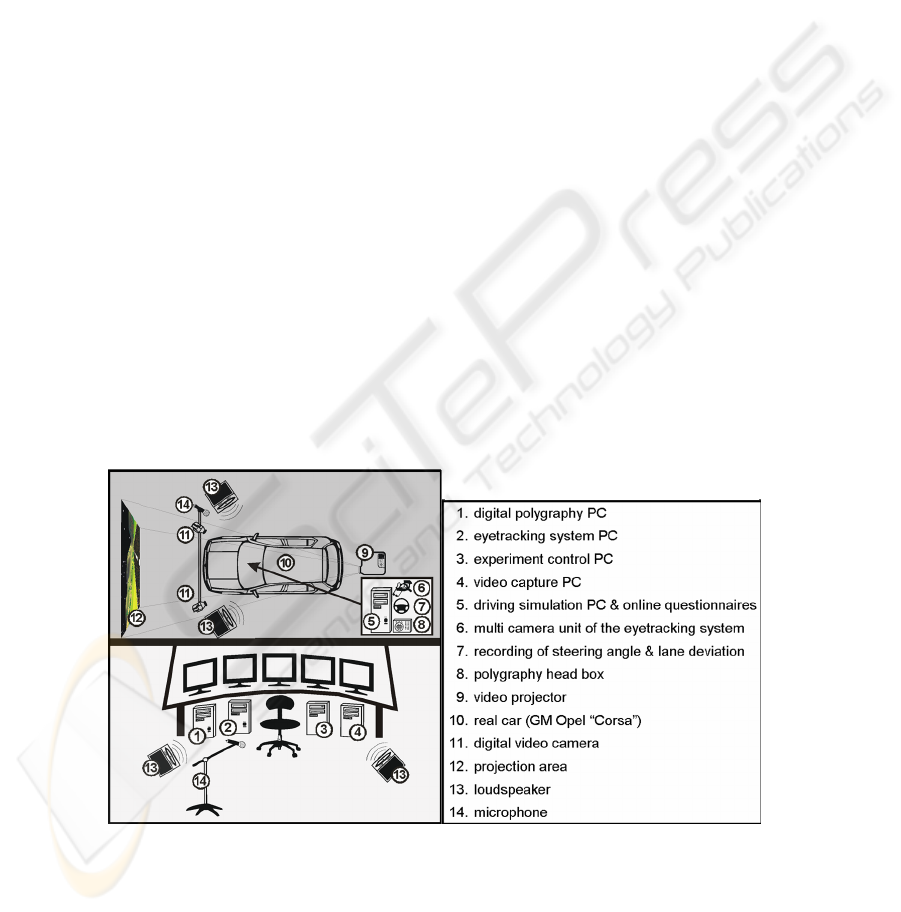
Twenty-three young adults started driving in our lab (Fig. 1) at 1:00 a.m. after a day
of normal activity and of at least 16 hours of incessant wakefulness which was
checked by wrist actometry. All in all they had to complete seven driving sessions
lasting 40 min, each followed by a 10 min period of responding to sleepiness
questionnaires and tests and a 10 min break. Experiments ended at 8:00 a.m.. Driving
tasks were chosen intentionally monotonous to provoke drowsiness and microsleep
events (MSE). The latter are defined as short intrusions of sleep into wakefulness
under demands of attention. They were detected during driving by the experimenter
who observed subjects left eye region, her/his face, and driving scene utilizing three
infrared video cameras. Typical signs of MSE are e.g. prolonged eyelid closures,
nodding-off, driving incidents and drift-out-of-lane accidents.
Fig. 1. Real car driving simulation laboratory
103

This step of online scoring is critically, because there are no unique signs of MSE,
and their exact beginning is sometimes hardly to define. Therefore, all events were
checked offline and were corrected by an independent expert. Unclear MSE
characterized by e.g. drifting of eye gaze, short phases with extremely small eyelid
gap, inertia of eyelid opening movements or slow head down movements were
excluded from further analysis. Our intention was finding out a detection system for
clear MSE versus clear Non-MSE assuming that such a system can not only detect the
MSE recognized by human experts, but would also offer a possibility to detect
unclear MSE cases which are not recognizable by experts.
Non-MSE were selected at all times outside of clear and of unclear MSE.
Five different types of Non-MSE were selected to show their influence on detection
performance:
− Non-MSE1: of first driving session (1:00 until 1:40 a.m.) only
− Non-MSE2: of first driving session and only during eyelid closures
− Non-MSE3: of first five minutes of each driving session
− Non-MSE4: of periods between MSE where subject is drowsy
− Non-MSE5: like Non-MSE4 and only during eyelid closures
An explanation for the need of five different types of Non-MSE is given later. All
in all we have found 3,573 clear MSE and picked out the same amount of Non-MSE
for further analysis in order to have balanced data sets.
Five channels of EEG (C3, Cz, C4, O1, O2) and two of EOG (vertical, horizontal)
were recorded using a sampling rate of 128 sec
-1
and binocular eyetracking signals
(two-dimensional eye gaze, pupil size) using a rate of 250 sec
-1
, but analysis of the
latter are not reported here.
3 Signal Analysis
Segments of all electrophysiological signals were extracted with respect to the
observed temporal starting points of MSE / Non-MSE using two free parameters, the
segment length and the offset between first sample of segment and starting point of
an event. In these segments linear trend was removed and the power spectral densities
(PSD) were estimated by Periodogram method applying a Hanning window.
Extraction of PSD features was followed by a feature reduction step of simple
averaging of PSD values in spectral bands. Here, three further free parameters are to
be optimized: lower and upper cut-off frequency and the width of bands. Finally,
PSD values were logarithmically transformed.
To optimize empirically all free parameters we employed Optimized Learning
Vector Quantization (OLVQ1) as a robust, very adaptive and rapidly converging
classification method [14]. OLVQ1 has at least one further free parameter to be
optimized, the number of prototype vectors. During parameter optimization the
minimal test error was searched following the cross-validation paradigm of “multiple-
hold-out”. Only when utilizing Support Vector Machines (SVM) the paradigm of
“leave-one-out” was applied, which is an almost unbiased estimator of the true
classification error [4]. Disadvantageously, this method is computationally much
104
more expensive than “multiple-hold-out”; but only in case of SVM, an efficient
implementation exists [13].
-9 -8 -7 -6 -5 -4 -3 -2 -1 0 1 2 3 4
0
5
10
15
20
25
30
test error [%]
Offset [s]
mse vs. non-mse5
mse vs. non-mse4
mse vs. non-mse3
mse vs. non-mse2
mse vs. non-mse1
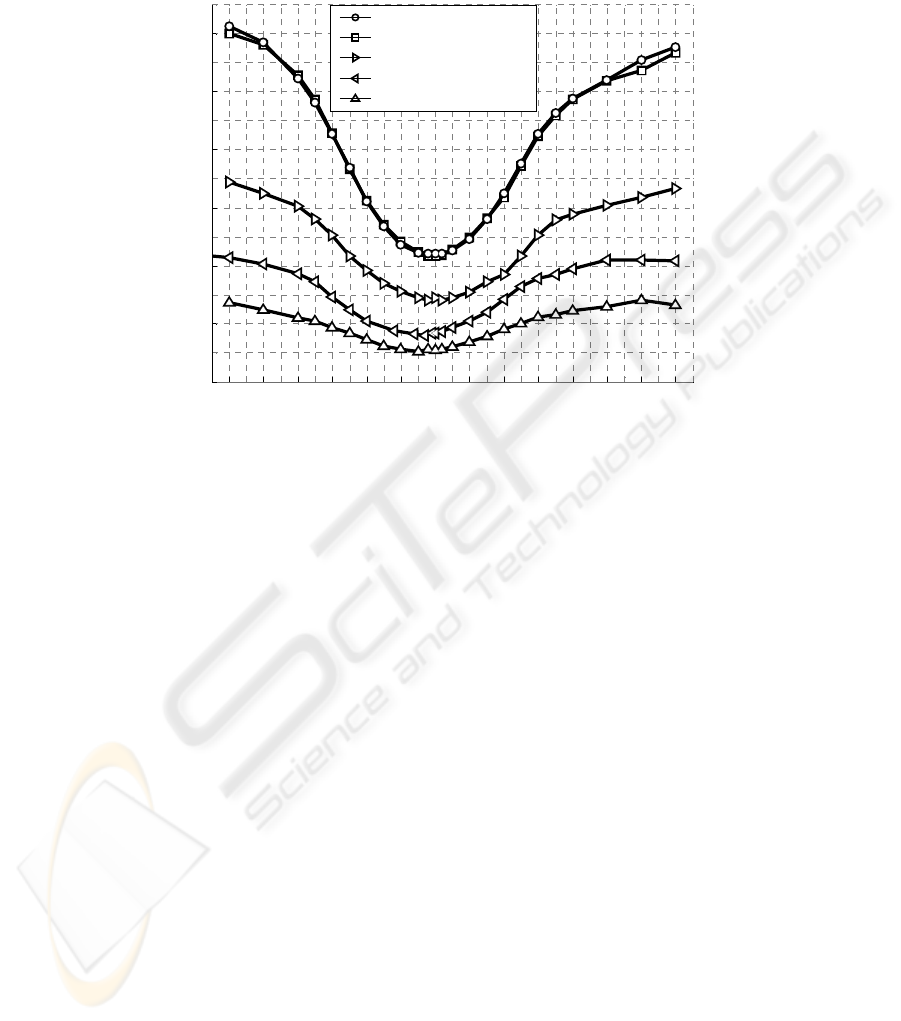
Fig. 2. Mean empirical test errors vs. segment offset parameter. OLVQ1 was utilized for
classification of clear MSE vs. five different types of Non-MSE (see text). The length of signal
segments was 8 sec.
Varying free parameters led in case of segment offset to a relative steep error
function (Fig. 2). Optimal offset values of about -3 sec together with optimal segment
length of 8 sec mean that classification works best when 3 sec of EEG / EOG
immediately before MSE and 5 sec during ongoing MSE are processed. Classification
of MSE versus Non-MSE1 resulted best because it is easiest to discriminate between
MSE, which are always ongoing under a high level of fatigue, and Non-MSE of the
first driving session, which are at relatively low level of fatigue. Classification of
MSE versus Non-MSE3 was more difficult because a lot of segments under higher
levels of fatigue are now to be classified against MSE. Applying segments of Non-
MSE5 was much more difficult because segments of both classes, MSE and Non-
MSE5, are of same highest level of fatigue. One could argue that mostly MSE are
starting by eyelid closures and, therefore, we did perhaps nothing else than a simple
detection of eyelid closures. But this was clearly not the case. Eyelid closures of MSE
versus eyelid closures of Non-MSE (type 4) were discriminated with nearly the same
error function. Only the first mentioned case, MSE against Non-MSE of the first
session, was slightly more difficult to discriminate if both classes consist of eyelid
closures (type 2).
Next, we investigated if spectral domain features represented by PSD can be
interchanged or complemented by state space features represented by the recently
introduced method of delay vector variances (DVV) [5, 6]. The motivation is as
105
follows: PSD estimation is a linear method which can be conveniently performed
utilizing the Periodogram and which has been shown to perform particularly well in
applications related to EEG signal processing [7-9]. But PSD estimation is based
solely on second order statistics. In contrast, the DVV approach is based on local
predictability in state space. This approach can show both qualitatively and
quantitatively whether the linear, nonlinear, deterministic or stochastic nature of a
signal has undergone a modality change or not. Notice that the estimation of
nonlinearity by DVV is intimately related to non-Gaussianity, which cannot be
estimated by PSD. This way, it should be possible that DVV contributes to the
discrimination ability of different classifiers.
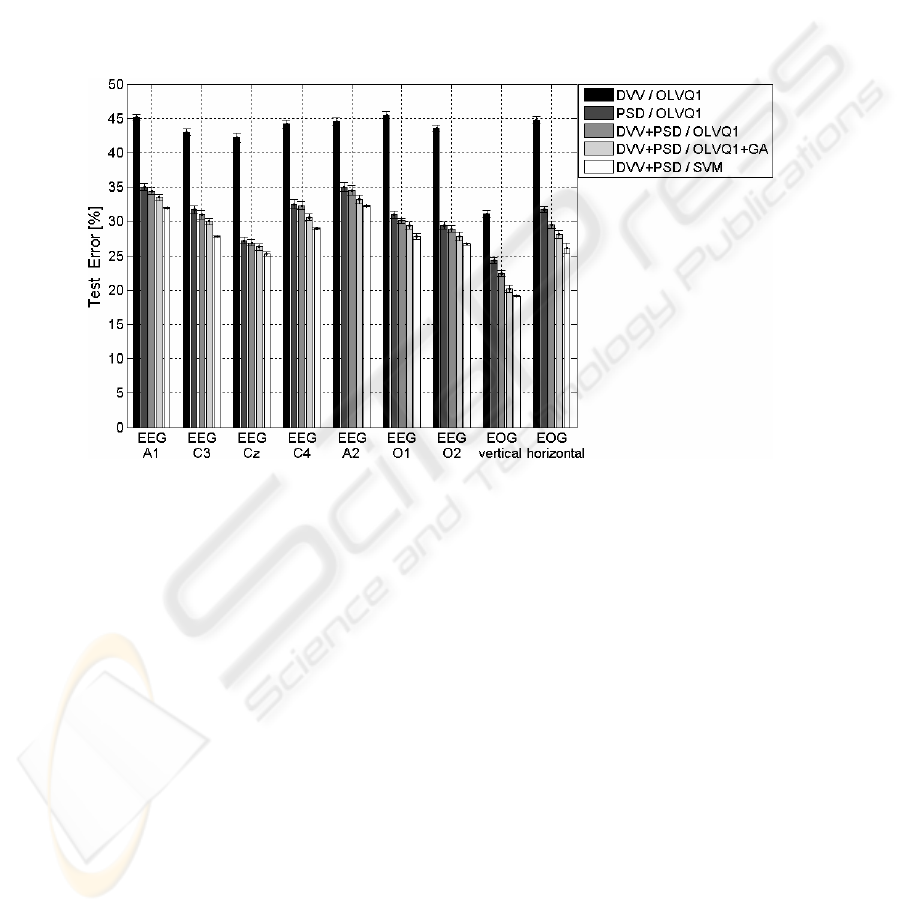
Fig. 3. Mean and standard deviation of test errors for different single electrophysiological
signals. A comparison of two different feature types and three classification methods
In addition to this question, it is important to know if single channel EEG or EOG
contains enough discriminatory information and which electrode location could be
most successful. Empirical results suggest that the vertical EOG signal is very
important (Fig. 3) leading to the assumption that modifications in eyelid movements
have high importance, which is in accordance to results of other authors [10].
Relatively low errors were also achievable in central and occipital electrode locations;
both mastoid electrodes (A1 and A2), which are considered as least electrically active
sites, showed lowest performance (highest errors), as expected. Similarity in
performance between symmetrically located electrodes (A1-A2, C3-C4, O1-O2)
meets also expectancy and supports reliance on the chosen analysis system.
DVV methodology showed low performance (Fig. 3) despite additional effort of
optimizing free parameters of DVV, e.g. embedded dimension and detail level. This
is surprisingly because DVV was successfully applied to sleep EEG [6]. Handling of
microsleep EEG and EEG in drowsy states and, moreover, of shorter segments seems
to be another challenge. PSD performed much better and performance was only
106

slightly improved by fusion of DVV+PSD. A further slight improvement was
achievable for each single signal if a scaling factor is assigned to each input variable
of the OLVQ1-network and if these factors are adapted by genetic algorithms (GA)
utilizing training errors as fitness function (Fig. 4). High values of scaling factors
indicate high relevances of the assigned input variables. This allows extracting
knowledge after succeeding training. We give no further insight into both methods
(DVV, GA) for reasons of their limited performance and because of limited space.
SVM outperformed both other classification methods, OLVQ1 and OLVQ1+GA, but
only, if Gaussian kernel functions were utilized and if the regularization parameter
and the kernel parameter were optimized previously.
Fig. 4. Microsleep detection system based on feature fusion and on combining OLVQ1
networks and Genetic Algorithms
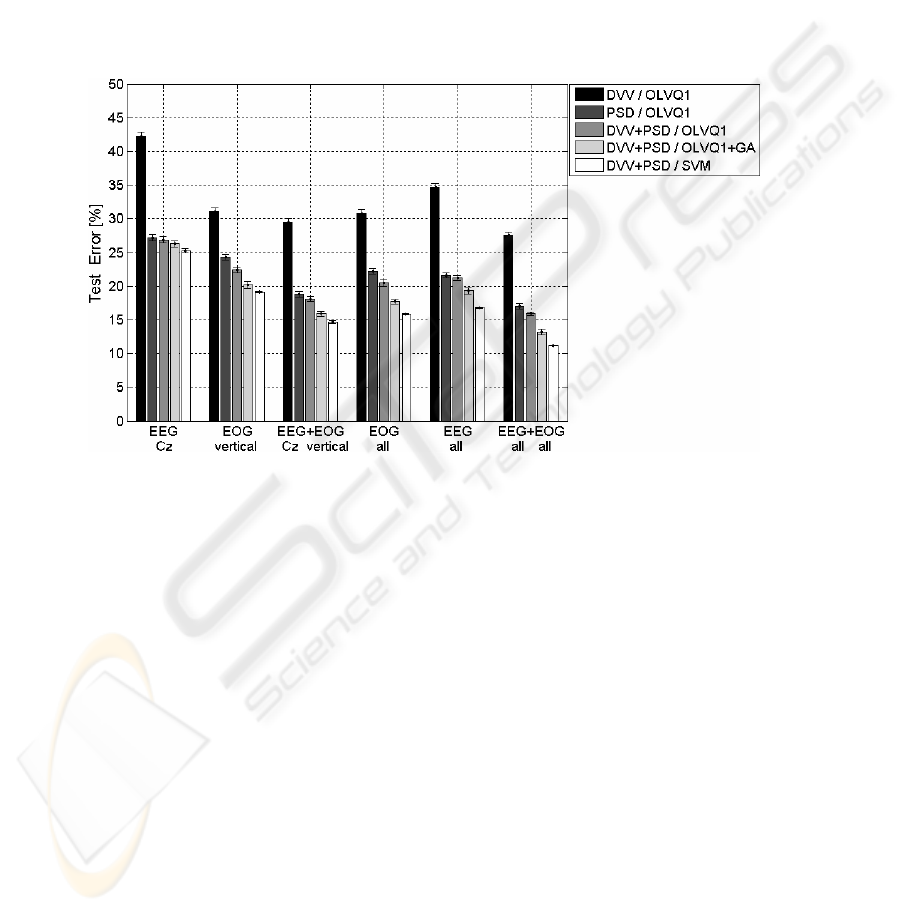
Finally, we tested if a fusion of features coming from both different signal sources
(EEG, EOG) and feature extraction methods (PSD, DVV) will improve classification
performance (Fig. 5). For comparison, the best two single channels are drawn against
fusion examples. Fusing features of both best performing single channels, i.e. Cz-
EEG and vertical EOG, resulted in higher performance than fusion of all signals of
one signal type, i.e. all EEG or all EOG signals. But, the best result was achieved by
fusion of all EEG and of all EOG signals and additionally, by utilization of SVM. For
this case empirical test errors are down to 11.2 %. It is not shown in fig. 5, but results
were nearly equal between PSD+DVV and only PSD features when utilizing SVM;
related performance decrements are only about 0.8 %.
4 Conclusions
Machine learning methods are capable to detect microsleep events in ongoing EOG
and EEG signals. Statistically validated test errors of approximately 12 % were
achieved for the discrimination between MSE and NMSE. This result should be a
step on the long way to establish a reference measure needed for development of
video-based drowsiness warning systems [1, 2]. It turned out that second-order statis-
tics performed by PSD estimation seems to deliver efficient features. The
improvements in the test error rates adding DVV features are relatively small.
Therefore, modality changes in the signals concerning their predictability and
linearity mainly detected by DVV method seem less important.
107
There is an optimum of detection, but only in a relatively small “time window”
which is nearly centred on starting point of the critical events. Future work has to find
out methods to broaden this window. This would open up the development of
predicting systems. Until now, a prediction would be too erroneous. In fig. 2 the pure
prediction case is at offset of -8 sec because we have segment length of 8 sec.
Immediately at segment endings we can perform predictions; but, the errors would be
about 30% assuming that the most difficult tasks are vital for practical applications,
i.e. MSE versus Non-MSE5 and MSE versus Non-MSE4. Only for these cases, the
real sensory task is required, where brain microstates of short sleep intrusions are to
be detected against drowsy but still attentive states.
Fig. 5. Mean and standard deviation of test errors before and after feature fusion of different
biosignals. A comparison of two different feature types and three classification methods
Fusion of features of all signals has turned out to be the best choice. The number
of fused signals multiplies the dimensionality of feature space after fusion compared
to the single signal case. This notwithstanding, the performance was improved giving
further indications that Support Vector Machines and prototype-vector based
classification methods in contrast to other methods do not have the problem of
learning discriminant functions in very high-dimensional feature spaces, which is also
known as “curse of dimensionality” [4].
Until now, not much is known about intra-individual variability. Experimental
material of much more than of one night of driving is needed to gain insight into this
topic. Concerning the inter-individual variability, large differences in signal
characteristics during microsleep and during drowsiness has been observed [11, 12].
As a consequence, detection performance is relatively low when empirical
classification errors of examples of one subject were calculated excluding all
examples of this subject from training, previously. A greater variety of feature
108

extraction methods may possibly overcome these limitations and should be likely to
improve and stabilize the discrimination of MSE.
Acknowledgements
This work was supported by German Federal Ministry of Education, Science, Research
and Technology as part of the program “Application Research and Development at Uni-
versities of Applied Sciences” under grant AFuE-FKZ 17 012 03.
References
1. Polychronopoulos, A., Amditis, A., Bekiaris, E.: Information data flow in AWAKE multi-
sensor driver monitoring system, Proc. IEEE Intell. Vehicles Symp. (2004), 902-906
2. Hagenmeyer, L., Bekiaris, E., Widlroither, H.: Guidelines for the development of HCI-
elements for drowsy operators in transportation and process control; Proc. UAHCI 2005,
Las Vegas, Nevada, USA (2005)
3. De Waard, D.: The measurement of drivers' mental workload. PhD thesis, University of
Groningen, Traffic Research Centre, The Netherlands. ISBN 90-6807-308-7 (1996)
4. Devroye, L., Gyorfi, L. & Lugosi, G.: A probabilistic theory of pattern recognition;
Springer, New York (1996)
5. Gautama, T., Van Hulle, M.M., Mandic, D.P.: On the characterization of deterministic /
stochastic and linear / nonlinear nature of time series, Technical Report (2004)
6. Gautama, T., Mandic, D.P., Van Hulle, M.M.: A Novel Method for Determining the Nature
of Time Series. IEEE Trans. Biomedical Engineering, 51(5), (2004) 728-736
7. Heitmann, A. et al.: Technologies for the monitoring and prevention of driver fatigue. Proc.
First Int Driving Symp Human Factors in Driver Assessment, Training and Vehicle Design.
Aspen CO, Iowa City, IA: University of Iowa (2001) 81-86
8. Sagberg, F., Jackson, P., Krüger, H-P., Muzet, A., Williams, A.J.: Fatigue, sleepiness and
reduced alertness as risk factors in driving, Project Report, Transport RTD (2004)
9. Sommer, D., Hink, T., Golz, M.: Application of Learning Vector Quantization to detect
drivers dozing-off, European Symposium on Intelligent Technologies, Hybrid Systems and
their implementation on Smart Adaptive Systems (2002) 119-123
10.Galley, N., Andrés, G., Reitter, C.: "Driver Fatigue as Identified by Saccadic and Blink
Indicators" in A. Gale (eds.); "Vision in Vehicles - VII"; Amsterdam: Elsevier (1999) 49-
59
11. Jung, T.-P. et al.: Estimating alertness from the EEG Power Spectrum. IEEE Transactions
on Biomedical Engineering 44 (1997) 60-69
12. Golz, M. et al.: Application of vector-based neural networks for the recognition of begin-
ning Microsleep episodes with an eyetracking system. In: Kuncheva, L. I. (ed.) Compu-
tational Intelligence: Methods & Applications (2001) 130-134
13. Joachims, T.: Learning to Classify Text Using Support Vector Machines. Kluwer, Boston
(2002)
14.
Kohonen, T.: Self-Organizing Maps (third edition). Springer, New York (2001)
109
