
Hybrid Strategy for Automatic Stellar Classification
Alejandra Rodríguez
1
, Carlos Dafonte
1
, Bernardino Arcay
1
Iciar Carricajo
2
, Minia Manteiga
2
1
Department of Information and Communications Technologies.
University of A Coruña, 15071 A Coruña, Spain
2
Department of Navigation and Earth Sciences
University of A Coruña, 15011 A Coruña, Spain
Abstract. This paper describes an hybrid approach to the unattended
classification of optical spectra of stars. The classification of stars in the
standard MK system constitutes an important problem in the Astrophysics area,
since it helps to carry out proper stellar evolution studies. Manual methods,
based on the visual study of stellar spectra, have been frequently and
successfully used by researchers for many years, but they are no longer viable
because of the spectacular advance of the objects collection technologies, which
gather a huge amount of spectral data in a relatively short time. We therefore
propose a cooperative system that is capable of classifying stars automatically
and efficiently, by applying to each spectrum the most appropriate method or
combined methods, which guarantees a reliable, consistent and adapted
classification. Our final objective is the integration of several artificial
intelligence techniques in a unique hybrid system.
1 Introduction
Spectroscopy is among the most powerful currently available techniques for the study
of stars and, in particular, their physical conditions (temperature, pressure, density,
etc.) and chemical components (H, He, Ca, K, etc.). In general terms, a stellar
spectrum consists of a black body continuum light distribution, distorted by the
interstellar absorption and reemission of light, and by the presence of absorption lines,
emission lines and molecular bands [1].
The stellar spectra are collected from telescopes with appropriate spectrographs
and detectors. Observers collect the flux distribution of each object and reduce these
data to obtain a one-dimensional spectrum calibrated in energy flux (erg-1cms-2s-1Å-
1) and wavelength (Å). The study of the distribution of spectral types and the analysis
of spectral data can help to understand the temporary change of the physical
conditions of stars from a statistical point of view, and therefore, to learn about their
evolution. This is why spectral classification is one of the fundamental aspects of the
evolutionary study of stars, and a phase that must be carried out in a fast, efficient and
accurate way.
Rodríguez A., Dafonte C., Arcay B., Carricajo I. and Manteiga M. (2005).
Hybrid Strategy for Automatic Stellar Classification.
In Proceedings of the 1st International Workshop on Artificial Neural Networks and Intelligent Information Processing, pages 62-71
DOI: 10.5220/0001194300620071
Copyright
c
SciTePress

This work is part of a global project devoted to the study of the last phases of
stellar evolution. As part of our project, we have collected a large sample of optical
stellar spectra from astronomical observations carried out at several telescopes. In
order to extract useful information from the collected spectra, we must complete a
solid and systematic classification in the current Morgan-Keenan system (MK).
The MK classification system was firstly proposed in 1943 by Morgan, Keenan &
Kellman and has experienced many revisions ever since [2]. This classification
system quantifies stellar temperatures and levels of luminosity. Stars are divided into
groups, i.e. spectral types, that are mainly based on the strength of the hydrogen
absorption lines and on the presence or absence of some significant lines of Ca, He,
Fe, and molecular bands.
The temperature of the stars is divided in a sequence called OBAFGKM, ranging
from the hottest (type O) to the coolest (type M) stars. These spectral types are further
subdivided by a decimal system, ranging from 0 (hottest) to 9.5 (coolest). In addition,
a luminosity class (from I to V) is assigned to the star, which depends on the intrinsic
stellar brightness. That is, the hottest star of the MK system would be of spectral type
O0 and the coldest would be a M9 star.
This two-dimensional system is the only one that is widely used for stellar
classification. One of its main advantages is that MK classifications are often static,
because they are based on the visual study of the spectra and on a set of standard
criteria. However, the same spectra can be classified differently by different experts
and even differently by the same person at different times.
The estimation of the spectral type and luminosity of stars is often carried out by
human experts, who analyze the spectra by hand, with no more help than their own
experience. The manual classification techniques are often based on the visual study
of the spectra and on a set of standard criteria [1]. These manual analyses usually lead
to a MK classification of the spectra.
Although the manual methods of classification have been used successfully for
many years, they are no longer viable, since the current collection technologies allow
us to obtain a huge amount of spectral data in a relatively short time. The manual
classification of all the spectra that are currently available would involve a
considerable increase in time and human resources; it is therefore highly advisable to
optimize the manual procedure by means of automatic, fast and efficient
computational techniques.
Our main objective is to formalize a hybrid system that is able to determine the
most appropriate classification method for each spectrum type and to obtain on-line
MK classifications through an Internet Stellar Database (http://starmind.tic.udc.es).
The following sections start by describing the spectral data that were used to
design and test the automatic classification techniques. Secondly, we describe the
morphological analysis algorithms that were applied to the spectra before presenting
them to the automatic techniques. Finally, we present the different artificial
intelligence models that were implemented and we contrast their results.
63

2 Spectral Data
We have chosen a complete and consistent set of 258 spectra that cover all the types
and luminosities of the MK system, in order to design the artificial models that will be
applied to the classification problem. This set is sufficiently representative because it
offers a continuous transition of the spectral features between each spectral type and
its adjacent types. The selected spectra were previously analyzed and corrected by
human experts who collaborate in the project. We have used the public catalogues of
Silva [3] - 28 spectra sampled in the range of 3500 to 8900 Å with 5 Å of spectral
resolution -, Pickles [4] - 97 spectra sampled in the range of 1150 to 25000 Å with 5
Å of spectral resolution -, and Jacoby [5], 133 spectra sampled in the range of 3510 to
7426 Å with 1.4 Å of spectral resolution.
In order to guarantee the generalization of the designed and implemented models,
we have built the training or design set with approximately 50% of the spectra of each
spectral type, leaving around 15% for validation and the remaining 35% to evaluate
the classification capability of each model.
Before presenting the spectra to the automatic techniques, we carry out a
morphological analysis of all the spectra in order to obtain the values of the
parameters that characterize each spectrum separately.
3 Morphological Analysis
The patterns that are presented to the selected models were obtained automatically by
means of signal processing techniques that measure the spectral peculiarities
(absorption and emission lines, spectral energy, molecular bands, etc.).
In particular, we measure the 25 spectral features that can be grouped into three
general types:
− Absorption and emission lines: including hydrogen, helium and metallic lines (Ca,
K, Fe, etc.).
− Molecular bands: hydrogen and carbon absorption bands.
− Rates between lines: CH-K rates, He-H rates, etc.
The signal processing algorithms used to obtain the spectral parameters are mainly
based on the spectral continuum estimation and the energy measurement. Although
the details of morphological analysis are out of the scope of this paper, it is necessary
to mention that it is not a trivial task since spectra are affected by the interstellar
reddening and by the noise that measurement instruments generate.
From a morphological point of view, an absorption line is a descending (ascending
for emission) deep peak that appears in an established wavelength zone. To accurately
calculate the intensity of each line, we carry out an estimation of the local spectral
continuum. We smoothen the signal with a low pass filter, excluding the peaks in an
interval around the sample where the line was detected. This filter is implemented by
a five-point moving average method that selects the five more stable fluxes. That is
64

⎟
⎟
⎟
⎟
⎟
⎟
⎟
⎟
⎟
⎟
⎟
⎟
⎠
⎞
⎜
⎜
⎜
⎜
⎜
⎜
⎜
⎜
⎜
⎜
⎜
⎜
⎝
⎛
∑
=
+
−
N
X*E
C
i
nj
nj
i
j
,
(1)
where Cj is the estimation of the continuum for sample j, Ei is the flux in sample i,
N is the number of values used in the moving average method to calculate the local
spectral continuum, and X is a binary vector that indicates the representative fluxes of
the spectral continuum in the zone. This means that Xi = 1 if Ei is a flux value
representative of the local spectral continuum, and Xi = 0 if Ei is a peak. The
intensity is positive for the absorption lines and negative for the emission lines.
A molecular band is a spectral zone where the flux suddenly decreases from the
local continuum during a wide lambda interval. For the molecular bands this means
that we only have to measure their energy to decide if they are significant enough. In
this case, the upper threshold line for each band is calculated by means of linear
interpolation between the fluxes in the limits of the interval defined for each band.
The area between this line and the axis of abscissas is then calculated with a discrete
integral, and the area that surrounds each band is calculated by integrating the flux
signal between the extremes of the band. Finally, the flux of the band is obtained by
subtracting both calculated energies. That is
() ()
∫∫
−=
r
l
i
r
l
ilr
λEλLB
,
(2)
where Blr is the flux of the band between the samples l and r, L is the projection
line, E is the flux function, λ the wavelength, l the left limit of the band and r the right
limit. Since the obtained value becomes more negative as the band becomes deeper
and wider, positive or negative values close to zero are not considered as bands.
The artificial intelligent techniques of this experimentation have been designed and
tested so as to consider both the described spectral parameters and full spectral data as
input patterns.
4 Classification Methods
Among the existing techniques of artificial intelligence, Knowledge-based Systems
(KBS) and artificial neural networks (ANN) seem to be most appropriate to approach
the problem of stellar classification. Knowledge-based systems can reproduce the
reasoning of experts in order to classify spectra; neural networks are capable of
learning the intrinsic relations of the patterns with witch they were trained. We have
also implemented clustering algorithms to perform a sensibility analysis of the input
spectra, although this technique is not currently used to obtain MK classifications of
stars.
Our main objective is to integrate all the designed and implemented techniques in a
unique hybrid system capable of applying the best classification method to each input
65

spectrum. The developed system includes two different tools: a spectral analyzer and
a stellar classifier.
The spectral analyzer makes an exhaustive morphological analysis of the spectra,
using the described algorithms to obtain a numerical parameterisation. It is developed
in Builder C++ and integrates ad hoc ActiveX components for the visualization of
spectra.
The analyzer retrieves the spectral data from a relational database that stores and
structures the information from human and bibliographic sources. At present,
approximately 400 spectra of our survey are stored in the database, and they will be
soon available via the Internet.
The stellar classifier is based on the development of the different artificial models
that were chosen to approach the MK classification of stars. We used both the spectral
parameters obtained by the spectral analyzer and the full spectral data to build the
input patterns of the artificial intelligence techniques. The neural networks were
implemented with the Stuttgart Neural Network Simulator [6], the clustering
algorithms were developed with MATLAB v.6.5.1 [7], and the expert systems were
implemented in OPS/R2 [8].
At present we are developing a web site that will make the stellar classifier
available through the Internet. Our main purpose is to allow users world-wide to
classify their stellar spectra on-line in a fast, efficient and comfortable way.
After analyzing the performance of each technique separately, we implemented the
best models in C++ by integrating them with the spectral analyzer, which provides us
with a unique tool for the processing and classification of the optical spectra of stars.
The next sections describe the different models that are integrated into the stellar
spectral classifier.
4.1 Knowledge-based Systems
This first approach proposes the implementation of a knowledge-based system that
combines signal processing, production rules and fuzzy techniques, obtaining a very
satisfactory emulation of the current manual process.
As a previous step towards the design of the expert systems, we carried out a
sensibility analysis of the classification parameters (absorption lines, molecular bands,
etc.). As a final result, we have defined as many fuzzy variables as classification
levels (global, type and subtype) for each luminosity class; we have also defined the
fuzzy sets and membership functions determined by the values of the spectral features
in the guiding catalogue spectra.
The developed knowledge-based system stores the information that is necessary to
initiate the reasoning process in the facts base. This descriptive knowledge of the
spectra is represented by means of frames, i.e. objects and properties structured by
levels. This model was chosen because it is the simplest and most adequate to transfer
the analysis data to the classification module and allows us to establish the
equivalence between analysis data and knowledge. The knowledge of the facts base
includes general information, such as the names of the stars, and the results of the
morphological analysis, i.e. the values of the classification parameters.
The real parameters of spectral classification and the limit values of each type and
subtype were included in the expert system in the shape of fuzzy rules. The rules base
66

is that part of the system where the human classification criteria are reproduced. We
have adopted IF-THEN production rules for the implementation of this module,
because they allow us to manage the uncertainty and imprecision that characterize
human reasoning in this field.
The conditions of these rules refer to the values of the parameters stored in the
current facts base (working memory). The conclusions allude to three levels of
spectral classification: global (late, intermediate, early), spectral type and luminosity,
and as such, the module communicates actively with the facts base.
To decide what rule to apply at each moment, we used the Means-End Analysis
strategy (MEA) [9]: basically, among the rules that were incorporated last into the
working memory, this strategy chooses the not executed rule that has the largest
number of patterns. The production rules are linked in a forward reasoning, guided by
objectives. The strategy used for the reasoning process combines guided reasoning
methods with a method based on truth values. The rules also have associated
credibility factors that were obtained from interviews with experts and from the
bibliography of this field.
We used the Shortliffe and Buchanan methodology [10] to create an evolution that
includes fuzzy sets and membership functions that are contextualized for each spectral
type. The applied inference method is Max-product, which combines the influence of
all the active rules and produces a smooth, continuous output. In our approach, the
credibility factor of each rule has also been considered as another truth value. The
defuzzification of the data into a crisp output was accomplished by the fuzzy-centroid
method [11]. With this mixed strategy, we achieved a remarkable adaptation to
human reasoning, able to successfully handle the imprecision and uncertainty implicit
in the manual classification process. In addition, we obtained the spectral
classification of stars with a probability value that indicates the grade of confidence.
Our final system is able to classify stars with a success rate very similar to the
agreement percentage between experts in the field (approximately 80%).
This part of the spectral classifier was developed in OPS/R2 [8] and integrated
with the analyzer by means of dynamic link libraries (DLL).
An additional research topic consisted in improving the implemented system by
applying the results of the best neural models, and will be described in the next
sections. The weights of the output layer units were analyzed so as to determine, for
each spectral type, which input parameters have more influence on the output. The
normalized values of the higher weights were included in the expert system in the
shape of credibility factors of the rules that correspond to the most influential
parameters for each spectral type. This modification of the reasoning rules (using the
weights values of the trained neural networks) resulted in a slightly significant
improvement of the performance of the original expert systems (around 2%).
4.2 Artificial Neural Networks
The neural networks of this approach are based on both supervised and non-
supervised learning models [12]. In particular, Backpropagation, Kohonen and Radial
Basis Functions (RBF) networks were implemented.
We have tested three backpropagation learning algorithms (standard, momentum
and quick) for the spectral types, spectral subtypes and luminosity classes.
67

We have also tested RBF networks; networks based on Radial Basis Functions
(RBF) combine non-supervised learning for hidden units and supervised learning in
the output layer. The hidden neurons apply a radial function (generally Gaussian) to
the distance that separates the input vector and the weight vector that each one stores,
called centroid.
Finally, we have also implemented Kohonen networks. The Self-Organizing Map
(SOM) algorithm of Kohonen is based on non-supervised learning. SOMs are a
unique class of neural networks, since they construct topology-preserving mappings
of the training data where the location of a unit carries semantic information [13].
The training, validation and testing patterns that are presented to the neural
networks were obtained automatically by adding the necessary functions to the
spectral analyzer developed in the expert systems approach. Once the input values are
obtained by the spectral analyzer, they must be normalized and presented to the
neural networks. Our study standardizes the inputs of the network by means of a
contextualised and specific sigmoidal function for each parameter. This function
normalizes the input parameters in the [0, 1] interval and centers and scales the
distribution function of each parameter properly. The different topologies that were
implemented for the three learning algorithms are shown in Table 3.
The backpropagation topology that has resulted in a better performance
corresponds to a network trained with 25 spectral parameters as input layer and three
hidden layers of 10, 5 and 3 units. The best results for Kohonen networks were
achieved by maps of 12x12 units. As for the RBF networks, the best topology
corresponds to a network trained with 25 spectral parameters as input layer and 8
neurons in the hidden layer.
4.3 Statistical Clustering Techniques
In order to refine the classifications made by artificial neural networks and expert
systems, we have implemented statistical clustering techniques and applied them to
the problem of spectral classification. In particular we have implemented the K-
means, Max-Min and Isodata non-hierarchical clustering methods [14].
This approach uses the spectral parameters, obtained through the morphological
analysis algorithms, as well as the full spectra. In addition, two different versions of
each algorithm with 6 and 12 initial clusters were implemented.
Although the implemented clustering methods have achieved remarkable success
rates in stellar spectra classification, this technique was mainly applied to analyze the
sensibility of the spectral parameters that were used to classify the stellar spectra.
68

Table 1. Topologies tested for Backpropagation (BP), Kohonen and RBF networks (* shows
best networks).
Network Input Patterns Hidden Layer
BP Type Spectral parameters 10
BP Type Spectral parameters 5x5
BP Type Spectral parameters 10x10
BP Type Spectral parameters 10x5x3*
BP Type 659 flux values 100x50x10x3
BP Luminosity Spectral parameters 10x10
BP Luminosity 659 flux values 100x50x10x3
RBF Type Spectral parameters 16
RBF Type Spectral parameters 8*
RBF Type Spectral parameters 4
RBF Type 659 flux values 124
RBF Luminosity Spectral parameters 8
RBF Luminosity 659 flux values 124
Kohonen Type Spectral parameters 2x2
Kohonen Type Spectral parameters 12x12*
Kohonen Type Spectral parameters 24x24
Kohonen Luminosity Spectral parameters 2x2
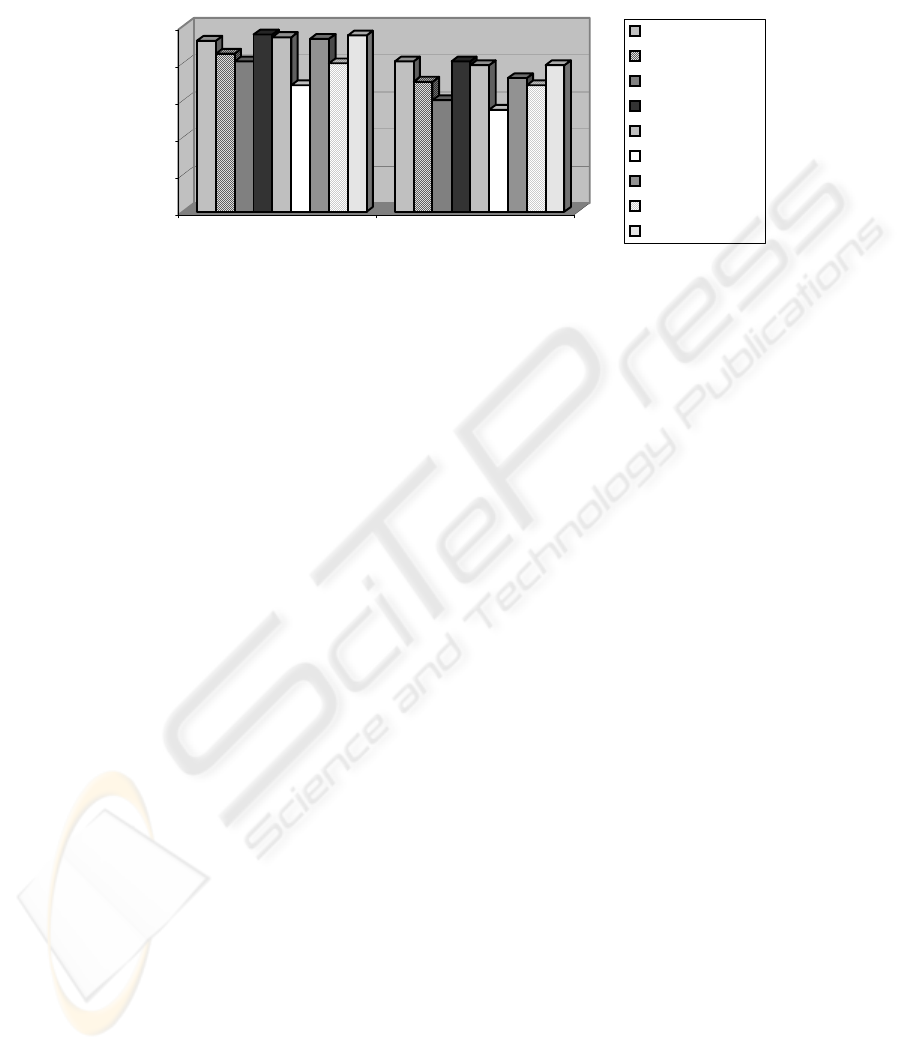
5 Results
This section makes the final comparison between the three applied global approaches:
expert systems, clustering techniques and artificial neural networks. We selected the
neural models of each type with the best performance and classified, by means of
clustering algorithms and expert systems, the 100 spectra that were used to test these
networks. Figure 1 contrasts the behaviour of the automatic techniques and that of
two human experts who collaborated on this project.
The Backpropagation and RBF networks, as well as K-means and Isodata
algorithms, obtained a high success rate of approximately 95%. The Kohonen model
obtained a low success rate in all its implementations, which could be due to the size
of the training set: this network type must cluster the data and therefore needs a
training set that is large enough to extract similarities and group the data.
Although the final results for the proposed classification methods seem to be
similar, an exhaustive study has revealed some interesting peculiarities; for example,
we have observed that each technique reached its worst results for the B and M
spectral types, i.e. the hottest and coolest stars respectively, and indeed, most of the
grouping algorithms include these spectra in the same cluster. This fact led us to
review the spectral parameters that were being used to design the models: we
discovered that B stars usually present great emission lines in zones where a
molecular band is expected, which means that the automatic techniques are unable to
differentiate between them. Our hybrid approach tries to solve these problems by
69
making a previous global classification of the star and then selecting the best method
to classify the spectra.
0%
20%
40%
60%
80%
100%
Type Luminosity
Human Expert A
Human Expert B
Expert Systems
Backpropagation
RBF
Kohonen
K-means
Max-Min
Isodata
Fig. 1. Final performance for 100 testing spectra
This final strategy consists of choosing, among all the described techniques, those
methods that present the best performance for each classification level. The final
system is mainly based on an expert system that determines the global type of each
star and that, according to the type, sends the spectra to different neural networks or
clustering algorithms in order to obtain their spectral type as well as their luminosity
level. The expert system classification is also used, as an additional information, for
those cases in which the other methods are unable to discriminate. The final
implemented system allows the users to select the spectra, visualize them, perform
different analyses and classify as many spectra as they want in a fast, comfortable and
simple way, which is the global objective of this computational approach.
6 Conclusions
This paper has proposed a hybrid and cooperative approach to the problem of MK
classification of stars. Our contribution is based on the development of an unattended
system that morphologically analyzes and automatically classifies the optical spectra
of stars.
We described several artificial intelligence models and analyzed their performance
and results to discover the best approach to the classification of each type of
spectrum. In our research, we combined signal processing techniques, expert
systems, artificial neural networks and clustering algorithms.
The best techniques reached a success rate of approximately 95% for a sample of
100 testing spectra, which, compared to manual classifications, corresponds to a
performance increase of approximately 10% (since the experts reached an agreement
percentage of approximately 87% of the spectra).
By using the additional classification information provided by the clustering
techniques, we have opened a new research line for the refinement of automatic
classifications, especially for spectral types B and M; the implemented clustering
techniques allow us to perform a sensibility analysis of the spectral parameters used to
classify stellar spectra in the neural networks and expert systems approach.
70

Finally, all the artificial intelligence techniques were integrated into a hybrid
system that has resulted in a versatile and flexible automatic method for the
classification of stellar spectra. In this way, the proposed system can achieve a better
adaptation to the classification problem, since each spectrum is processed with the
most appropriate technique according to its specific features.
For the evaluation period of the proposed models, we could count on the essential
collaboration of experts from the area of Astronomy and Astrophysics of the
University of A Coruña.
At present, we are working on our stellar database and we are developing a web
site to make the automatic classification system available through the Internet so as to
allow world-wide users to analyze and classify stellar spectra online in a fast, efficient
and comfortable way.
The authors acknowledge support from grants AYA2000-1691 and AYA2003-
09499, extended by the Spanish Ministerio de Ciencia y Tecnología.
References
1. Zombeck, M.V.: Handbook of Astronomy and Astrophysics. 2nd. ed. Cambridge University
Press (1990).
2. Morgan, W.W., Keenan, P.C., Kellman, E.: An Atlas of Stellar Spectra with an outline of
Spectral Classification. University of Chicago Press (1943)
3. Silva, D.R., Cornell, M.E.: A New Library of Stellar Optical Spectra. The Astrophysical
Journal Suppl. 81(2), (1992) 865-881.
4. Pickles, A.J.: A Stellar Spectral Flux Library. 1150-25000 A, Publications of the
Astronomical Society of the Pacific. 110, (1998) 863-878.
5. Jacoby, G. H., Hunter, D.A., Christian, C.A.: A Library of Stellar Spectra. The Astrophysical
Journal Suppl, 56, (1984) 257-281.
6. Stuttgart Neural Network Simulator. http://www-ra.informatik.uni-tuebingen.de/SNNS/.
(2001).
7. Hahn, B.: Essential MATLAB for Scientists and Engineers. University of Cape Town
(2002).
8. Forgy, C.L.: The OPS User's Manual, System Version 2.2. Production Systems Technologies
Inc. (1986).
9. Valette-Florence, P.: Introduction to Means-End Chain Analysis. Rech. Appl. Mark, 9,
(1994) 93-117.
10. Buchanan, B., Shortliffe, E.: Ruled-based Expert Systems. Adisson-Wesley (1984).
11. Mendel, J.M. Fuzzy Logic Systems for Engineering: A Tutorial. Proceedings of the IEEE,
83(3), (1995) 345-377.
12. Haykin, S.: Neural Networks. A Comprehensive Foundation. MacMillan College Pub
(1994).
13. Kohonen, T.: Self-Organizing Maps ,3. ed. Springer (2001).
14. Kaufman, L., Rousseuw, P.J.: Finding Groups in Data. John Wiley (1990).
71
