
SYSTEM OF MEASURE AND REPRESENTATION OF
ELECTROMAGNETIC EMISSIONS
Rafael Herradón, Florentino Jimenez, Julia Galiano, Juan Fernández-Corugedo
Departamento de Ingenieria Audiovisual y de Comunicaciones(DIAC).
Politecnic University of Madrid (UPM)
Keywords: Real-time systems control, environmental monitoring and control, Simulation, Propagation models,
Antennas, Radio communications.
Abstract: Due to the vertiginous increase of the electromagn
etic emissions of the modern communication systems and
to the affected population's concern, it becomes necessary a more exhaustive control of this type of
contamination. There are available different measure devices that make a characterization of the received
emissions, but most does not discriminate between the contributions from different systems. Therefore, you
cannot identify the systems responsible for the excessive measured levels. Of all the studied devices, the one
that better it fulfils the expectations it is the spectrum analyzer, that it allows to characterize the received
emissions, separating the different bands of the spectrum, and isolating the frequencies that don't perform
the existent norm. To control the spectrum analyzer we have developed a software program that makes the
measures according to the procedure exposed in the standard. Finally, another program processes and it
represents the results of the measures. In addition, this application can calculate the theoretical level of
radiation of different communication systems by simulation approximations and then, to compare with the
measurement levels and with the reference level.
1 INTRODUCTION
People demand every time a bigger mobility of the
systems of communications that they use in their
daily life. To satisfy this demand, different
technologies have appeared in the last times based
on the propagation of the electromagnetic waves that
it has relegated the cable to a second plane. As
examples of these technologies, we can mention the
mobile telephony (GSM, UMTS …), the wireless
networks (WiFi, Wimax), the communication
through Bluetooth, etc… The most attractive case
has been in the entire world the exponential grow of
the use of the mobile telephone.
The problem of the expansion of the wireless
syste
ms is the increase of the emission levels that it
can be considered harmful if it surpasses certain
exposure levels. To this physical problem, it is
necessary to add the visual and psychological impact
in the population that it is caused by the antennas of
base stations. All of this has produced an effect of
rejection in the population. Although they do not
want to lose the comforts that offer them these new
systems, they want to be sure that they do not
represent a danger for their health, demanding a
more restrictive control of the emissions levels
produced for these systems.
To respond to this concern they have been
devel
oped a series of recommendations and
standards that they regulate the maximum levels of
emissions that will tolerate (ICNIRP, 1998). In spite
of this effort, the population does not have
knowledge from the levels to those that is exposed,
and neither have they known the levels to which the
exhibition can be harmful. Even those titled capable
to characterize this emissions they find several
problems in identifying the source of emissions that
is surpassing the acceptable levels.
To solve these problems, we have developed a
syste
m able to make a complete characterization of
the completely conflicting spectrum, using the
hardware and software resources to obtain
accurately measurement, representation and
estimation of the emission levels.
368
Herradón R., Jimenez F., Galiano J. and Fernández-Corugedo J. (2005).
SYSTEM OF MEASURE AND REPRESENTATION OF ELECTROMAGNETIC EMISSIONS.
In Proceedings of the Second International Conference on Informatics in Control, Automation and Robotics - Signal Processing, Systems Modeling and
Control, pages 368-371
DOI: 10.5220/0001183603680371
Copyright
c
SciTePress

2 CAE PROGRAM
Spectrum Analyzer control (CAE) is a software
application that allows the user to make different
types of measures. This program controls a
Spectrum Analyzer and a GPS by the serial ports. To
carry out these measures the user has a series of
utilities, created for each one of the measure options.
The program is divided in five modules:
Configuration: This module helps the user through
the process of configuration of the antenna factor
and the lost of the cable.
Analyzer mode: The program sends commands to
the analyzer in real time, and the user can select the
frequencies that he wants to measure, showing the
results in a program window in the same way that
they would be seen in the analyzer.
Carrier measurement: It makes a temporal
characterization of a number of carriers selected by
the user. For this application, we use the span zero
mode of the spectrum analyzer.
Band measurement: This is the most significant
module for the estimation of emissions level. It has
two measure methods, one quick, but of less
reliability and another that requires more time but
whose results are more precise.
Each one of these applications saves the obtained
data with a certain format, in some cases attaching
the obtained graphs. So the user can check the
measures in any moment.
Figure 2: Text and graphical format of data
Each one of the text files contains the position
provided by the GPS, as well as all the data obtained
in the realized measure. Additionally, we can send
de captured data to a remote monitoring system
(Ruiz et al., 2005) using a mobile data
communication system as GPRS.
2.1 Jump in Frequency
This approach has been developed by the necessity
of making reliable measures, similar to accurately in
the broadband systems, such as isotropic probes and
field meters. We have made several measures that
have demonstrated that they should not take all the
points captured by the analyzer to make the field
calculations and received power. To know what
frequencies it is necessary to use and which it is
necessary to discard we use the following equation:
(1)
where RBW and Span are the resolution bandwidth
and the span of spectrum analyzer respectively and
Rate it is an adjusting parameter.
With this equation, we obtain the jump that we
make when we select the frequencies band that will
be analyzed
Figure 1: Application main window
pointsN
Span
RBWRate
Jump ⋅ º
⋅
=
SYSTEM OF MEASURE AND REPRESENTATION OF ELECTROMAGNETIC EMISSIONS
369
3 MODELEM PROGRAM
MODELEM is an application developed in
MATLAB to Model the Electromagnetic Emissions.
It is very intuitive and easy use software with a
series of graphic interfaces. The user can do
different actions related with Coordinates change,
antennas radiation diagram, propagation models,
transmission systems and projects. A project consists
on calculating the levels generated by a transmission
system and to make a graphic representation.
Moreover, the measurements done with the
software CAE can be represented in MODELEM to
compare the similitude between the theoretical
calculus and the measurement values. If the GSP
was connected when the measurement was been, the
coordinates are used to do the representation.
However, if the GSP was not connected, the
coordinates should be introduced manually. Then a
map can be superimposed at the measured levels.
)bpd(),,d(F
bp
bp
d4
EIRP
S
)bpd(),,d(F
d4
EIRP
S
kk
N
1k
kkkk
n
k
n
k
n
k
k
kk
N
1k
kkkk
n
k
k
1
2
2
1
≤ϕθ
π
=
≤ϕθ
π
=
∑
∑
=
=
So this program has different functions: represent
measures, simulate theoretical levels and compare
both with the security reference levels give by the
standards.
3.1 Representation of measures
The first of these functions allows the user to
process the data obtained in the measure. To
complete the representation we can add a map.
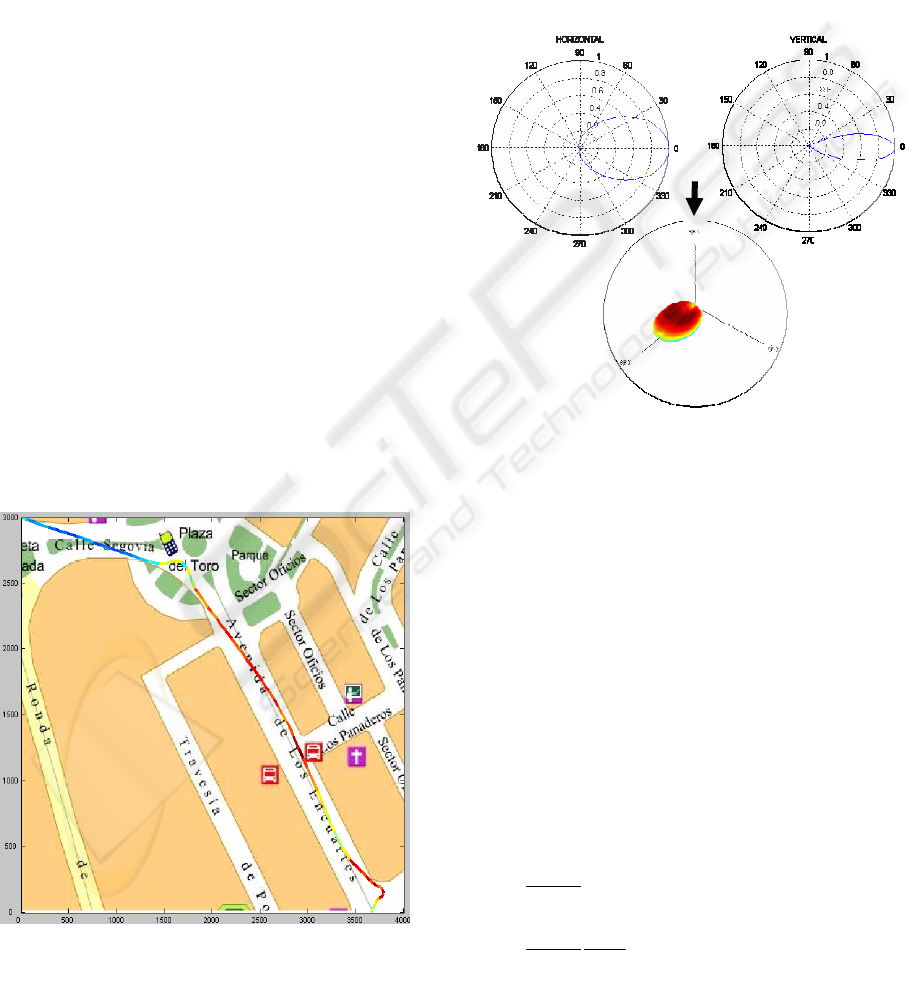
3.2 Diagrams of Radiation
Besides the representation of measures, the
MODELEM can simulate the levels radiated by a
series of systems transmitters.
To make the simulation, the user has to introduce
the data of the transmitters, and the horizontal and
vertical radiation diagram of the antennas. One of
the most complicated task is calculates the diagram
in three dimensions.
Figure 4: Radiation diagram of the antenna
3.3 Radiation models
To obtain the emitting levels we can use different
propagation models: theoretical models, (Free
Space, Flat Terrain), empirical models (UIT-R,
Okumura Hata, etc) or models based on Ray-tracing
and Ray-launching. It is necessary to consider some
specific circumstances such as the number and
location of the different emitting sources, the high
range of frequencies, etc.
One accurate and not excessively complicate
model to estimate the level of emissions is proposed
in (Herradon et al., 2002). This is a two-slopes
model with a Rayleigh factor for multipath
propagation.
(2)
Figure 3: Representation of measures and map.
ICINCO 2005 - SIGNAL PROCESSING, SYSTEMS MODELING AND CONTROL
370
where EIRP, equivalent isotropic radiated powe
istance from the source and
r, d
d
()
φ
θ
,F
the relative
diation pattern. The model above mentioned is
ditions. T
for
u itting levels produced by a typical
o tion for mobile communications
with PIRE = 1 KW are shown. In this case we use
me approaches for
ifferent environments, and they was compared with
number of emitting stations appear in figure 6.
We had developed a system that allows any user to
agnetic emissions of a
t types of measures, and saving the
sults for their later study.
gation models, several
ansmission systems, etc. The user can check if the
v
Guidelines for limiting exposure to time-varying electric,
agnetic fields. ICNIRP, 1998.
dation K.52., 2000)
Guidance on complying with limits for human
R.
Radiation levels for some
ons.
ra
only appropriate in far-field con he most
common accepted definition far-field in
communications is d = 2D
2
/λ, where D is the largest
dimension in the antenna, λ is the wavelength and
both must be in the same units. However, in emitting
measurements it can be considered that the field is
almost formed from d= λ.
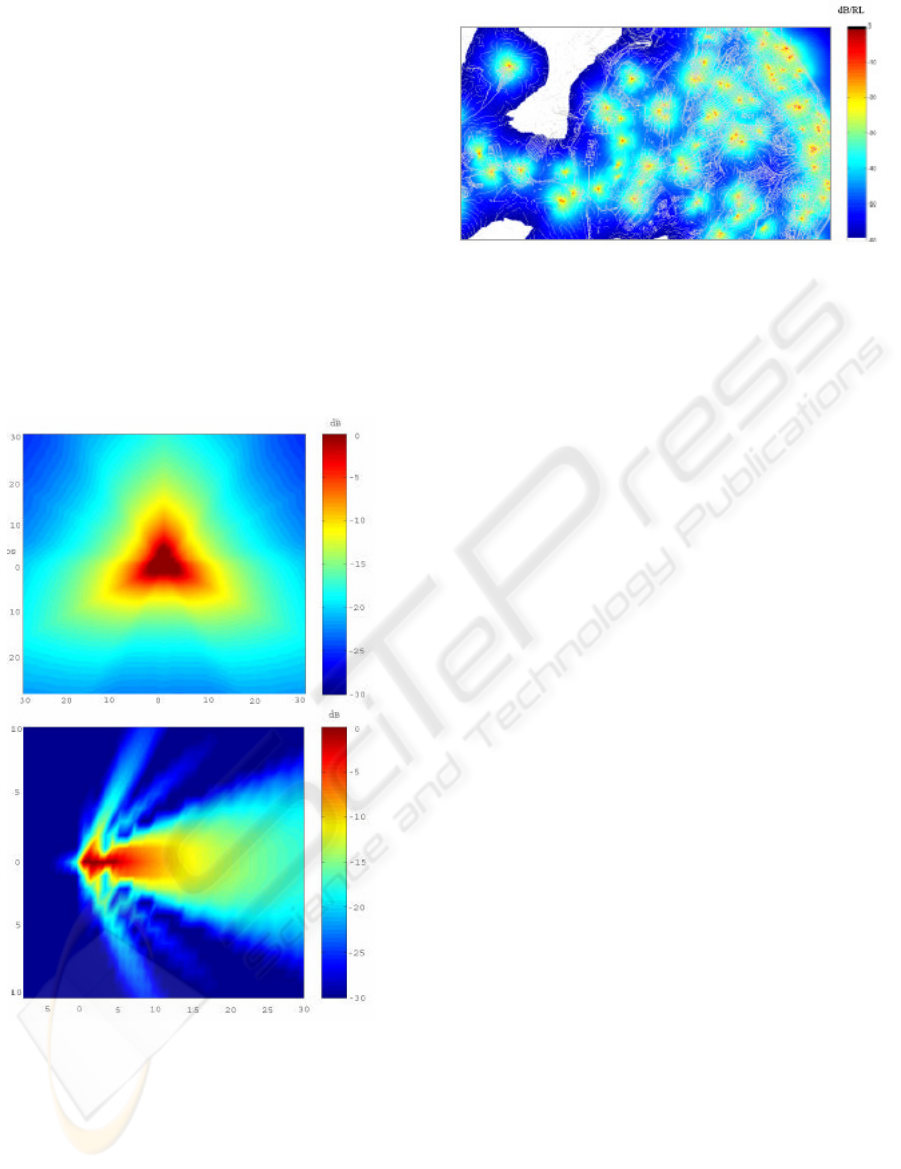
3.4 Results
In fig re 5 the em
3-sect r base sta
the free space expression as propagation model.
Figure 5: Power density levels, in horizontal and vertical
plane, relative to Reference Levels
Considering the application of the before models,
we have been carried out so
d
measurements carry out with the CAE program. The
results are very closed when we adjust the
propagation model.
An area corresponding to a big city with a high
Figure 6: Simulation of emitting levels in a city
4 CONCLUSIONS
make a study of the electrom
interest area.
The program CAE help to the user in the process
of realization of measures. Allowing the user to
make differen
re
In the program MODELEM, the user can do a
simulation of emission levels, including antennas
radiation diagrams, propa
tr
le els obtained in the measure coincide with the
obtained ones in the theoretical simulation
REFERENCES
magnetic and electrom
(ITU-T. Recommen
exposure to Electromagnetic Fields”. ITU-T.
Recommendation K.52. Feb 2000.
Recommended practice for measurements and
computations with respect to human exposure to
Radiofrecuency Electromagnetics Fields, 3 KHz to
300 GHz”.IEEE.1998
V. Ruiz, M. R. Herradon, F. Jiménez. “Remote
Monitoring Distributed Systems”. ICINCO- 2005
Herradon, F. Jimenez, L. Muñoz Aguilera. Simulation
of Electromagnetic
Radiocommunication System. Advances in Systems
Engineering Signal Processing and Communicati
WSEAS press.2002. pp 273-277.
SYSTEM OF MEASURE AND REPRESENTATION OF ELECTROMAGNETIC EMISSIONS
371
