FILLED
Video data based fill level detection of agricultural bulk freight
Fabian Graefe Walter Schumacher
Institut f
¨
ur Regelungstechnik
Technische Universit
¨
at in Braunschweig
Raul Queiroz Feitosa Diogo Menezes Duarte
Department of Electrical Engineering
Catholic University of Rio de Janeiro
Keywords:
machine vision, fill level detection, stereo vision, overload process, automatic overloading.
Abstract:
For automation of a continuous overloading process between two vehicles in motion, two information are
essential. On the one hand there is the relative position between the vehicles to be known. On the other
hand the loading point within the load space of the transport car has to be determined. Often a non optimal
usage of the transport capacity is obtained without moving the overload swivel. In order to optimize the
filling process by moving load point the distribution of the freight with in the load space has to be measured
during the overload process. In this article the Institut f
¨
ur Regelungstechnik of the Technische Universit
¨
at
in Braunschweig introduces the system FILLED for video data based fill level detection of agricultural bulk
freight such as chaffed corn or grass.
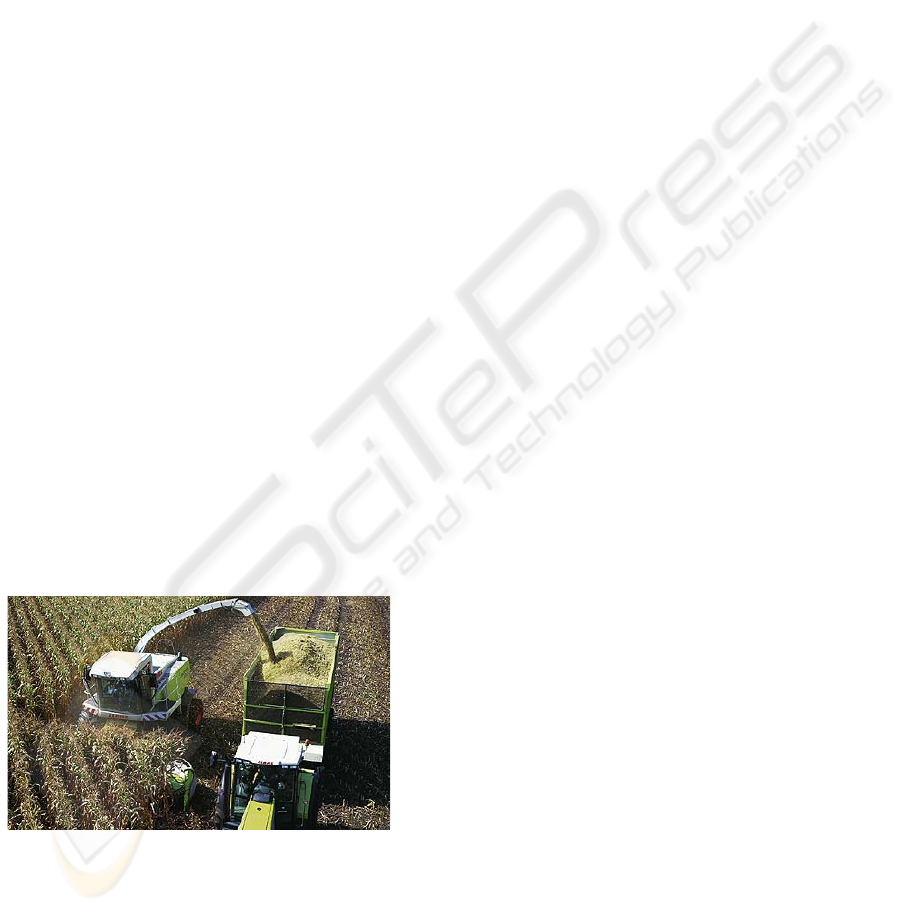
1 INTRODUCTION
Nowadays more and more powerful machines be-
come available in agriculture. Therefore speeds in
harvesting and harvesting tonnage increase. Keeping
the modern fast continuous overloading machines in a
proper relative position during the whole harvest im-
poses a significant stress upon the drivers. In order to
Figure 1: Forage Harvester
disburden the drivers of a harvesting combination of
a forage harvester and a transport unit a cooperation
of the Institut f
¨
ur Landmaschinen und Fluidtechnik
and the Institut f
¨
ur Regelungstechnik of the Technis-
che Universit
¨
at in Braunschweig deals with a system
for automation of this overload process. In this con-
text the Institut f
¨
ur Regelungstechnik is developing
the system FILLED for video based fill level detec-
tion. Most of the fill level sensor systems available
are bound to the storage device. Any modification of
the transport car requires an adaptation of the sensor
systems that imply in additional costs. Usually agri-
cultural bulk freight such as chaffed corn or grass does
not fill the load space utterly without variation of the
load point. For automatically adjusting the load point
it is necessary to know the distribution of the freight
within the load space. Therefore any type of fill level
sensor which provides just one local fill level informa-
tion is of less use. Moreover sensors using ultra sonic
methods are unsuitable due to their sensitivity for air
motion and temperature. Radar based sensors systems
usually encounter problems detecting organic mater-
ial. Tests with laser scanners failed due to the cloud
of spraying freight particles in the air. This work pro-
poses a video based fill sensor system that has the po-
tential to overcome all the mentioned troubles. Cam-
eras provide the possibility to obtain a huge amount
of 2D data in a single shot. The measurement range
can be simply adjusted by tuning of focal length. By
using a second camera 3D information can be com-
puted using well known stereo techniques. Moreover
the fast increasing processing power in addition with
powerful mathematically methods of image process-
ing makes video data based sensor systems become
439
Graefe F., Schumacher W., Queiroz Feitosa R. and Menezes Duarte D. (2005).
FILLED - Video data based fill level detection of agricultural bulk freight.
In Proceedings of the Second International Conference on Informatics in Control, Automation and Robotics - Robotics and Automation, pages 439-442
DOI: 10.5220/0001182704390442
Copyright
c
SciTePress
more and more feasible. This article presents the key
features of an automatic video based fill level mea-
surement system (FILLED) that has been developed
by the Institut f
¨
ur Regelungstechnik of the Technische
Universit
¨
at in Braunschweig. The system computes a
3D-model of the freight content using stereo vision.
In the following the way FILLED derives the fill level
from the image data will be explained. In section 2.1
we will provide a close look at the methods that are
used for image capturing. Section 2.2 will introduce
the means of image segmentation. The usage of stereo
vision will be explained in section 2.3. In the end the
strategy for improving the update rate will be pointed
out in section 2.4. Section 3 will provide concrete in-
formation about the prototype of FILLED.
2 SYSTEM DESCRIPTION
The system FILLED measures the fill level by means
of a stereo vision analysis. A 3D-model of the freight
pile surface and the freig car’s upper rims is calcu-
lated. To be more precise the local height of the
freight pile is detected at a sufficiently high amount of
points all over load area. The car’s rims are used for
determination of the freight car’s coordinate system.
The points measured are related to the car’s coordi-
nate system. FILLED processes data in three steps:
• Image capturing
• Segmentation
• Stereo vision
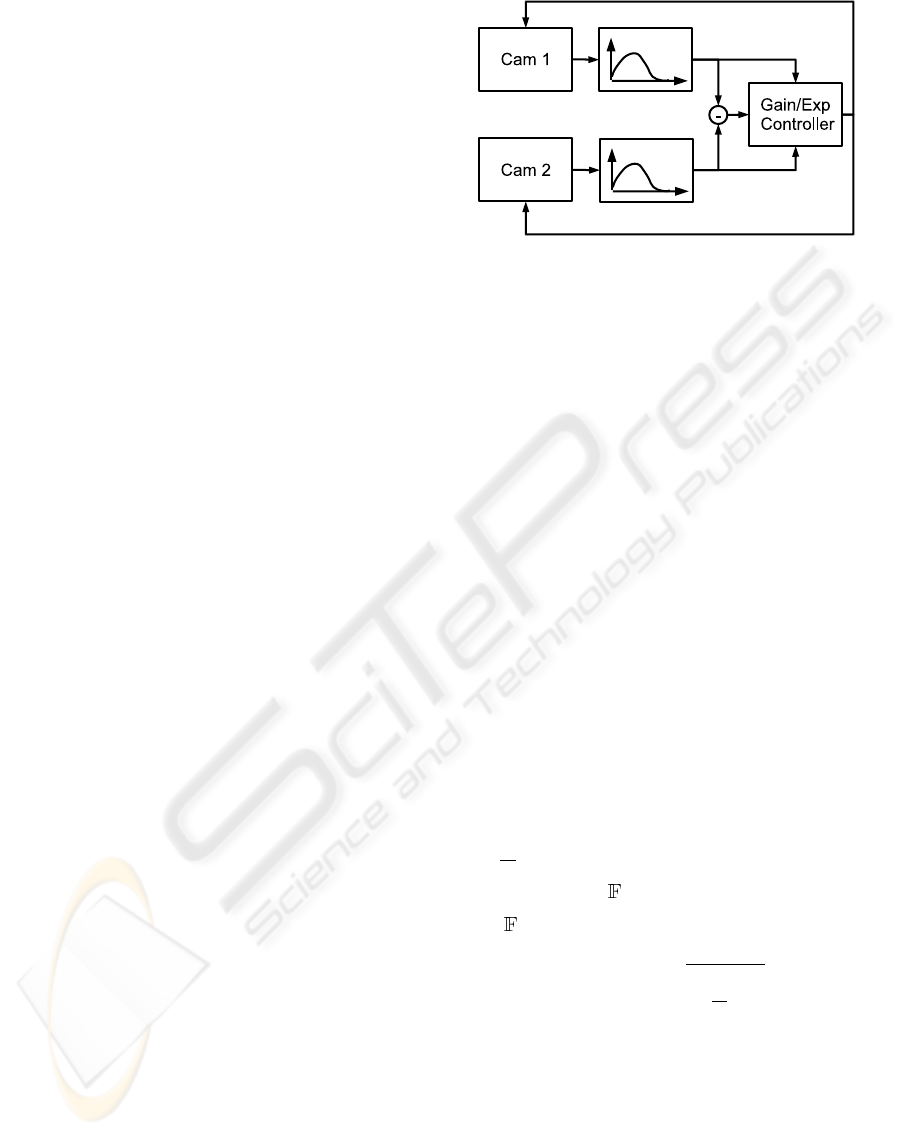
2.1 Image Capturing
The object to be measured is in motion during mea-
surement process. This requires that the images of
each stereo pair are captured simultaneously. A crit-
ical aspect of most stereo systems is the correspon-
dence problem. It consists of finding the projections
of points in 3D space on both cameras as accurately
as possible. To simplify this task the cameras are
geometrically calibrated by using some appropriated
off-line procedure during initialization (Online proce-
dures are thinkable (P.H.S. Torr, 2004)) Before com-
ing into operation a calibration cycle consisting of:
• comparison of both image histograms of one shot
and
• correction of the exposure time and gain are
attained. This procedure is performed once during
initialization. Further the cameras must be calibrated
geometrically by using some appropriated off-line
procedure. It is advisable to repeat this calibration
procedure from time to time.
Figure 2: hardware control structure
2.2 Segmentation
In this step the pixels representing the heap on the
image are identified. The segmentation is executed in
two steps. First the regions showing the freight car are
separated from the rest of the image. The second step
of segmentation locates the image regions containing
the freight heap. With the car’s rims painted red the
borders of the car can be extracted with a color seg-
mentation procedure applied (Will Schroeder, 2003).
In order to reduce the amount of points markes for De
Hough Analysis the remaining datasets are processed
with a canny (Canny, 1986) edge detection procedure.
Using the De Hough transformation on the resulting
bitmap the mapped rims are converted into lines. This
way the limits, the coordinatesystem and thus the in-
terior of the car is defined(Jon Orwant, 2000).
The second step locates the heap on the freight car.
For segregating the heap from the car’s interior the
local frequencies of the textures are analyzed. There-
fore a two dimensional Fourier transformation of a
kernel around a designated pixel P (x, y) is computed.
If F (u, v) is a Fourier coefficient of the transformed
image sample, all points with mean Fourier coeffi-
cient
F
∗
of less than the threshold T
F
within a certain
frequency range ∆
are suppressed.
∆
: {F (u, v) ∈ r
F,min
< r
F
< r
F,max
} (1)
r
F
=
p
(u
2
+ v
2
) (2)
P (x, y) =
(
1
F
∗
> T
F
0 else
(3)
2.3 Stereo Vision
For setting up a 3D model of the payload surface a
stereo vision technique is applied to the image region
covering the freight heap. The stereo vision procedure
can be divided into three steps image pre-processing,
point matching and reconstruction of the points in
space.
ICINCO 2005 - ROBOTICS AND AUTOMATION
440
2.3.1 Pre-Processing
The RGB image is initially converted into gray-scale.
After that an algorithm is applied to compensate non-
uniform illumination and to provide a roughly uni-
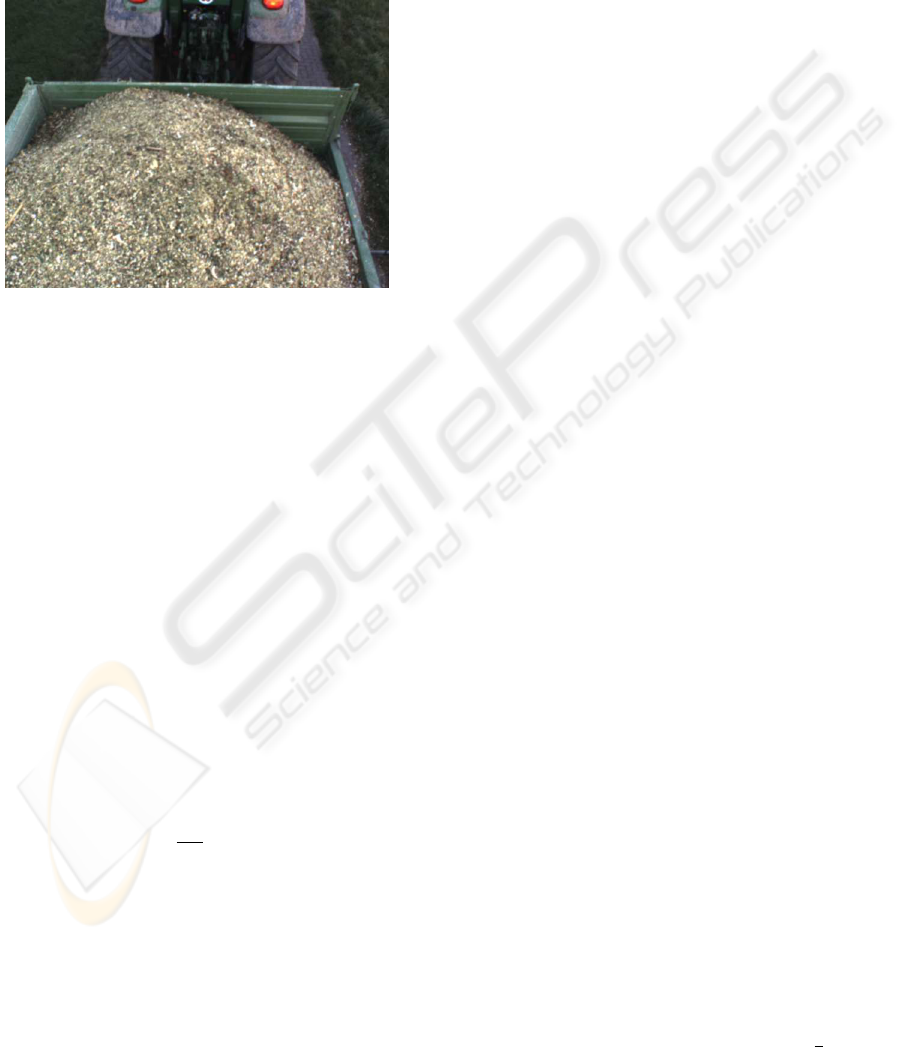
form contrast all over the image. Figure 3 shows
shadows projected from the freight cars walls in the
regions close to the corners of the freight car. It can
Figure 3: freight car being loaded
also be seen that the top of the freight heap is brightly
illuminated. The procedure to compensate for such
effects bases on the fact that the texture information of
the heap is concentrated in higher frequencies, while
natural illumination variation is represented by low
frequencies. By applying a linear Gaussian high pass
filter the effects of varying illumination are elimi-
nated.
f
hp
= h
g hp
∗ f
in
(4)
Where f
hp
, h
g hp
,f
in
and ∗ denote the output of the
high-pass filter, the Gaussian kernel, the input image
and the convolution operator. Now the local contrast
f
lc
is estimated by applying a linear low-pass filter to
the absolute value of f
hp
, according to the following
equation:
f
lc
= h
g lp
∗ |f
hp
| (5)
The local contrast is normalized by dividing every el-
ement of f
hp
by the corresponding value of f
lc
. So
the final normalized image f
n
is obtained by the last
pre-processing operation given by:
f
n
=
(
h
hp
f
lc
f
lc
> 0
0 f
lc
= 0
(6)
2.3.2 Point-Matching
In the second step pairs of corresponding points in the
left and right camera images are located. These points
will be used in the next step to reconstruct the 3D sur-
face model. Points are first selected on the left image
in such a way that they are as uniform distributed as
possible over the heap. These points can be stored
in a 3 × N matrix P
L
, containing in each column
the homogeneous coordinates [x
Li
, y
Li
, 1]
T
of the N
points selected on the left. With the cameras mounted
in such a way that the baseline is much shorter than
the fixation point on the scene conventional correla-
tion performs well. So let w
Li
(resp. w
Rj
) denote
the vector obtained by scanning the window of size
(2n + 1) × (2n + 1) centered at P
Li
= (x
Li
, y
Li
)
(resp. (P
Rj
= (x
Rj
, y
Rj
) ) on the left (resp. right)
image one row at a time. The similarity between the
points at P
Li
and P
Rj
is then given by
c(P
Li
, P
Rj
) = ~w
Li
· ~w
Rj
(7)
where the symbol “·” represents the internal product
operator. The best match P
∗
Ri
of P
Li
on the right im-
age is given by:
P
∗
Ri
= arg max ( ~w
Li
· ~w
Rj
) P
Rj
(8)
To reduce the processing time the search is restrict
to an area A
Li
of size (2m + 1) × (2m + 1) with
m > n on the right image centered at position
(x
Li
, y
Li
). Further improvements can be achived ex-
ploring the epipolar geometry. As (Emanuele Trucco,
1998) states the search for the matching point P
Ri
can
be restricted to the segment of its epipolar line con-
tained in the area A
i
within the right image.
In the third step the object points in 3D space are re-
constructed. (Emanuele Trucco, 1998) proposes an
extended triangulation that provides an optimal ap-
proximated solution for the object points in space.
With the results of the geometry analysis the X and
Y -axis of the car’s coordinate system are identified
parallel to the car’s rims. The Z-axis is a vector per-
pendular to the X and Y -axis.
2.4 Performance Aspects
One basic problem dealing with video data analysis is
the high amount of data which has to be processed. To
keep processing time below an acceptable value the
De Hough algorithm and the regions of interest are
limited to convenient ranges. This is done by assum-
ing that disparities between images of a single camera
in consecutive frames as well between images of both
cameras acquired at the same time are very low.
3 PERFORMANCE EVALUATION
FILLED has been tested with image data taken during
harvesting process. Figure 3 shows a typical image
that was used for testing. The image capture hardware
consists of two cameras each connected with a PCI-
Framegrabberboard. Two progessive scan cameras
(Pacific FAC 9820, IDS), equipped with a
1
2
” CCD
FILLED: Video data based fill level detection of agricultural bulk freight
441
640 × 480, RGB-color, progressivescan sensor have
been implemented. Standard wide angle lenses with a
focal length of 4.8 mm were attached. The De Hough
space has computed with a resolution of ∆ϕ =
π
100
.
The R
DH
axis has been mapped on to 255 values.
Good results for stereovision preprocessing could be
obtained using a 40 × 40 kernel for h
hp
. The match-
ing point procedure has been computed within a range
of 120 × 120 pixels around the designated point P
Li
.
The application will be implemented in C/C++ run-
ning on a standard office PC with a 3GHz Pentium 4
processor using Windows 2000. With the functions
of image segmentation that are already implemented
on the target system we obtain a effective update rate
F
upd
≥ 1Hz. The turnaround time of the modules
of stereo vision still implemented in matlab m-code
falls below 40 seconds. If FILLED is implemented
completely on the target system we expect an overall
update rate of F
upd
≥ 0.1Hz.
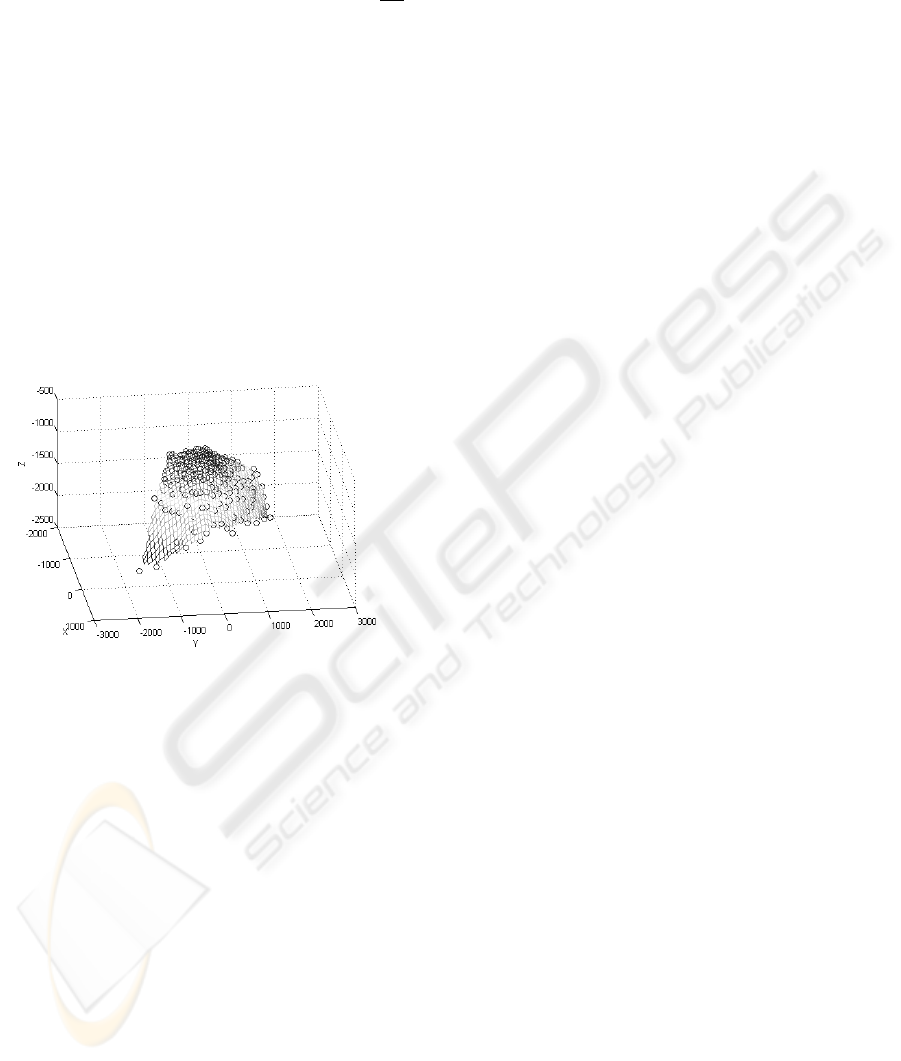
Figure 4: 3D Model of the freight heap
Figure 4 shows the 3D model of the bulk freight
heap. This dataset was derived from the car shown
in figure 3 as the result of the stereovision analysis.
The surface is reconstructed with regard to the camera
coordinate system. The axis are scaled in milimeters.
4 CONCLUSION
This work introduces a novel sensoring approach to
measure the fill level of agricultural bulk freight. We
believe that the general procedure used in the present
FILLED prototype can adequately adapted to work
with most kinds of bulk freight, and that an assign-
ment of FILLED for many types of transport devices
and for different materials would become feasible. A
further ongoing research on shape from X methods
investigates the possibility of using just a single cam-
era instead of a stereo vision combination. Moreover
usage of a calibrated camera system will provide the
possibility to measure the overloaded volume. Al-
though it becomes obvious that this could be a prac-
tical method of fill level measurement, there are still
problems to be solved. With regard to the speed of
filling - in our case the harvester processed aproxi-
mately 150 tonns per hour - an update rate of 0.1Hz
would be hardly enough for controlled loading. How-
ever tests evidenced that it is possible to follow the
filling process. An optimization of the implementa-
tion of the mathematical processes as well as the us-
age of specific hardware for array mathematic could
be an approach to increase the measurement speed.
Due to the fact that no reliable online calibration
method could be implemented yet, the state of the cal-
ibrated optical system must not changed during mea-
surement. This inhibits the usage of autofocus objec-
tives or objectives which provide a variable magnifi-
cation. Using the inline calibration algorithm men-
tioned before requires initialization runs from time to
time to ensure that the epipolar system data are valid.
This means that the overloadprocess has to be inter-
rupted, which is unfavoured for economical reasons.
We think that online calibration methods such as the
eight point algorithm (P.H.S. Torr, 2004) could be a
possible solution for this problem.
ACKNOWLEDGMENT
The authors would like to thank the DFG (German
Research Foundation) for their financial support of
this project.
REFERENCES
Canny, J. (Nov 1986). A Computational Approach to Edge
Detection. IEEE Transactions on Pattern Analysis and
Machine Intellegence, Vol 8, No 6.
Emanuele Trucco, A. V. (1998). Introductory Techniques
for 3-D Computer Vision. Prentice Hall (25. Mrz
1998).
Jon Orwant, Jarkko Hietaniemi, J. M. D. (April 2000). Al-
gorithmen mit Perl. ISBN 3-89721-141-6, 1. Auflage.
P.H.S. Torr, A. F. (2004). Invariant Fitting of Two View
Geometry or In Defiance of the eight point algorithm.
IEEE Transactions on Pattern Analysis and Machine
Intellegence, 26(5), pages 648-651.
Will Schroeder, Ken Martin, B. L. (2003). VTK Toolkit 3rd
Edition An Object-Oriented Approach To 3D Graph-
ics. ISBN 1-930934-12-2, Kitware.
ICINCO 2005 - ROBOTICS AND AUTOMATION
442
