
A GLOVE INTERFACE WITH TACTILE FEELING DISPLAY FOR
HUMANOID ROBOTICS AND VIRTUAL REALITY SYSTEMS
Michele Folgheraiter, Giuseppina Gini
Politecnico di Milano, DEI Electronic and Information Department
Piazza Leonardo Da Vinci 32, Milan
Dario L. Vercesi
Politecnico di Milano, DEI Electronic and Information Department
Piazza Leonardo Da Vinci 32, Milan
Keywords:
Man-Machine Interfaces, Virtual Reality, Haptic Interfaces, Electro-cutaneous Stimulation.
Abstract:
This paper focuses on the study and the experimentation of a glove interface for robotics and virtual reality
applications. The system can acquire the phalanxes position and force of an operator during the execution of
a grasp. We show how it is possible to use and integrate this data in order to permit the user to interact with
a synthetic world. In particular the system we designed can reproduce tactile and force sensation. Electrodes
and actuators are activated according to the information coming from the real world (position and force of the
user’s finger) and from a physical model that represents the virtual object. We also report some psychophysical
experiments we conducted on five subjects, in this case only the electro-tactile stimulator was used in order to
generate a touch sensation.
1 INTRODUCTION
Human-machine interfaces are very important in or-
der to guarantee a good transfer of information from
the human to the machine and vice versa. In many
applications the entity and quality of this informa-
tion exchange can establish the performance and
success of the machine operation (Fahn and Sun,
2000),(J.Adams et al., 2001),(Burdea, 1999).
In robotics, for example, these interfaces are applied
in order to remotely control the manipulation sys-
tem. A good example of tele-manipulated robot is
the ”Robonaut” designed in the NASA Johnson Space
Center’s laboratories (Ambrose et al., 2001). This ro-
bot has a humanoid shape and it is intended for sup-
porting astronauts during EVA (Extra Vehicular Ac-
tivity) activities. In this case, the operator is able to
govern the robot by a glove interface that measures
his arm-hand posture and generates the proper control
signals for the robot’s limbs. In this system, the op-
erator receives two types of feedback from the robot:
the first is a force feedback that allows to calibrate the
applied force during an object manipulation, the sec-
ond is a visual feedback that reproduces the robot en-
vironment. For this purpose an HMD (Head Mounted
Display) is used.
Another interesting system is the Rutgers Master II
developed at the Rutgers University. This haptic inter-
face (Bouzit et al., 2002) permits to flex or extend the
subject fingers, with a maximum force of 16 N, using
four pneumatic actuators. Each actuator is equipped
with a position sensor that allows to control the fin-
gers closure according to a model that represents the
virtual world.
The TENS (Transcutaneous Electric Nerve Stimula-
tion) devices are also very interesting in the the field
of the haptic interfaces. These systems are capable
to generate a touch sensation without recreating the
physical stimulus, like many other mechanical de-
vices; this means high energy efficiency and very
compact devices. Technically, it consists in changing
the membrane potential of some skin receptors with
an electric field applied by electrodes on the subject’s
dermis (Kajimoto et al., 1999). Controlling the cur-
rent injected in the tissue, it is possible to modulate
the receptor nerve activation and so the tactile sensa-
tion perceived by the subject.
Thanks to the bigger dimension of the mechanore-
ceptor nerves ( 10 µm) with respect to the pain re-
ceptor fibers (1 µm), it is possible to evoke the touch
sensation and avoid the pain sensation.
Even if big improvements were done in the last
decades, many haptic devices are still unable to gener-
ate a fully immersive sensation, because they operate
outside the human perceiving system. To solve some
of these issues, we have built a device that combines
353
Folgheraiter M., Gini G. and L. Vercesi D. (2005).
A GLOVE INTERFACE WITH TACTILE FEELING DISPLAY FOR HUMANOID ROBOTICS AND VIRTUAL REALITY SYSTEMS.
In Proceedings of the Second International Conference on Informatics in Control, Automation and Robotics - Robotics and Automation, pages 353-360
DOI: 10.5220/0001166703530360
Copyright
c
SciTePress
visual, touch and force feedback in order to give a
more realistic interaction with the virtual world.
In this paper we will show some results obtained with
our custom built force feedback and touch sense glove
that can be worn and can interact in strict contact with
the human touch system. In particular the glove that
we developed can be used for three main purposes:
1. To Explore the capabilities of TENS (Tran-
scutaneous Electric Nerve Stimulation) stimulation in
combination with a virtual simulation system.
2. To Acquire the grasp positions performed by
a human operator in order to train a neural network
to make a robotic hand execute the same task (Fol-
gheraiter et al., 2004).
3. To Use the glove as an haptic interface to interact
with a virtual world.
We did a first experiment to explore the possibil-
ities offered by the TENS stimulation for the inves-
tigation of a virtual world. Using a special elec-
trode applied at the fingertip, we evoked vibration and
pressure sensations by injecting an impulsive bipha-
sic current into the skin of the subject, according to
the Gate Theory (Melzack and Wall, 1965). We per-
formed different tests changing some stimulation pa-
rameters like the current injected, the stimulation fre-
quency and the duration of the impulse. We also in-
troduced a force feedback in opposition to the fin-
ger movements in order to emulate the virtual object
rigidity.
2 ARCHITECTURE OF THE
VIRTUAL GLOVE
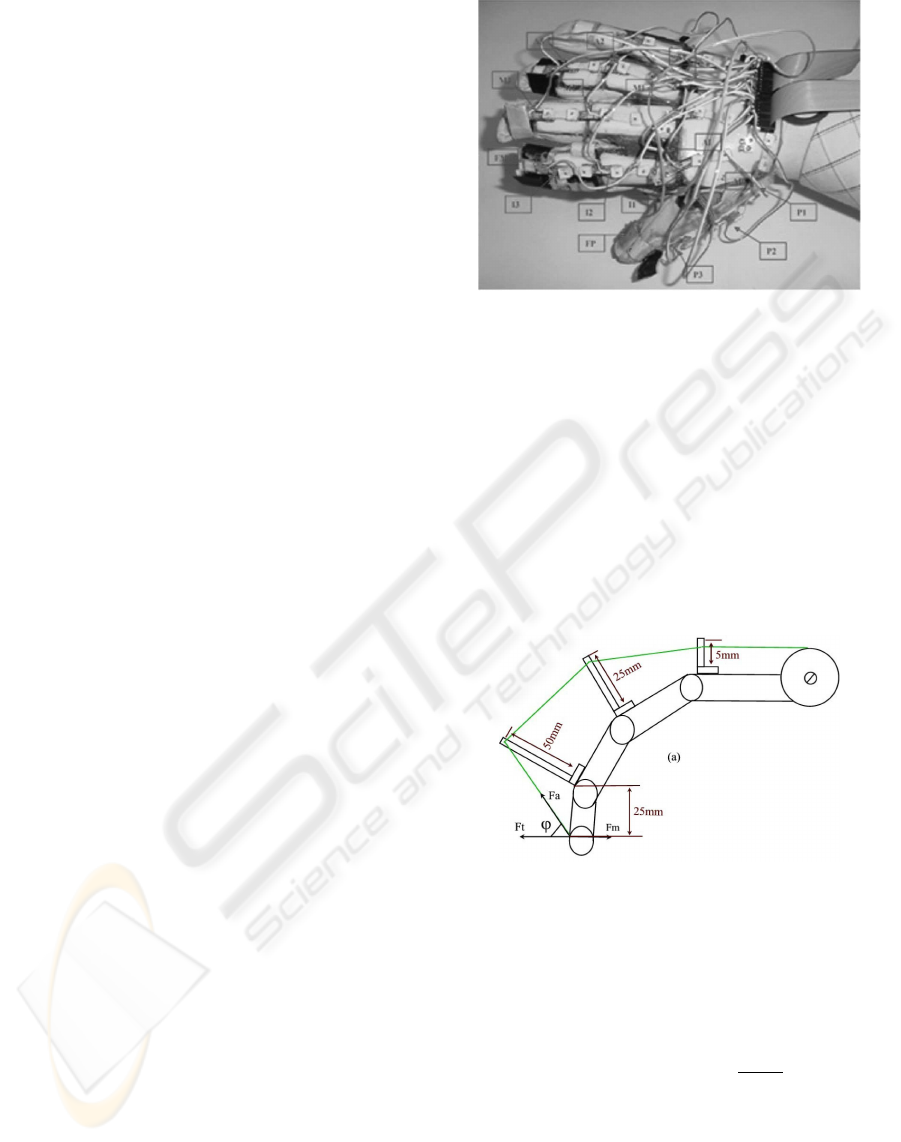
The system is composed by a glove equipped with 14
angular sensors and 2 force sensors (figure ).
Angular sensors measure the joint rotation of each
phalanx for every fingers, except for the little one.
Force sensors are connected in series with the tendons
that permit to transfer the force from the actuator to
the fingertip. We realized them cutting and reshaping
commercial sensors, in particular we used flex sensors
and FSE (Force Sensor Resistor).
Three angular sensors are mounted on each finger
respectively for proximal, middle and distant articular
joints. Two sensors, of the same kind, are mounted
between the thumb and the forefinger to measure ab-
duction and adduction movements.
The glove is also equipped with a light arm-band,
rigidly fixed on it, where we have put the actuator sys-
tem able to bind the finger movement in its dexterous
space.
Figure 1: The Glove.
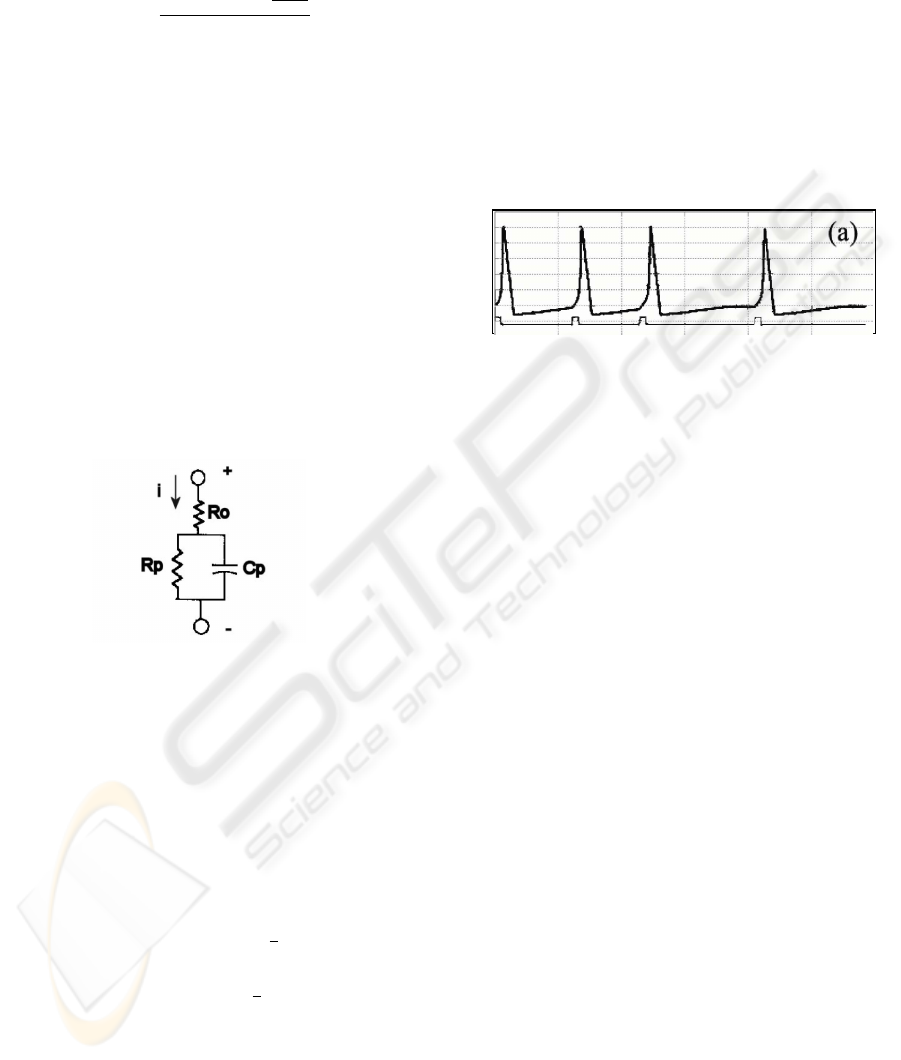
2.1 Force feedback system
The force feedback actuator is composed by a servo
connected to the fingertip through two tendons fixed
to the solid plastic bands of the glove (Figure 2). The
tendons run along the finger length across some pass-
ings. We fixed each tendon so that the servo force
was driven perpendicularly to the movement path of
the finger. In this way we optimized the force trans-
ferred along the tendon to the fingertip.
Figure 2: Schema of the artificial tendons.
The virtual object is modelled by its dynamics
equations. The force generated by the object depends
on its mechanical characteristics, to a first approxima-
tion we can write the model as following:
F
v
(t) = K
e
x(t) + K
d
dx(t)
dt
(1)
Where K
e
is an elastic constant, K
d
is a damping
constant and x(t) is the penetration rate into the object
surface.
To have the equilibrium, the force generated by the
tendon to the fingertip must be equal to the force gen-
erated by the virtual object (F
m
). We implemented
a software to calculate this force in real time; taking
ICINCO 2005 - ROBOTICS AND AUTOMATION
354
into account the mechanical structure of our glove, the
equation 1 can be rewritten as equation 2.
F
a
(t) =
K
e
x(t) + K
d
dx(t)
dt
cosϕ
(2)
Where ϕ is the angle that the tendon forms with the
last phalanx (see figure 2).
2.2 Electro-cutaneous stimulation
system
The electro-cutaneous stimulation of the fingertip is
due to an electrode fixed between the glove and the
user’s finger. The position of the electrode can be ad-
justed to choose the specific zone that we intend to
stimulate. This is also important to avoid an uncom-
fortable sensation caused by a bad contact position.
Furthermore, we can increase the skin-electrode con-
tact quality using a conductive gel.
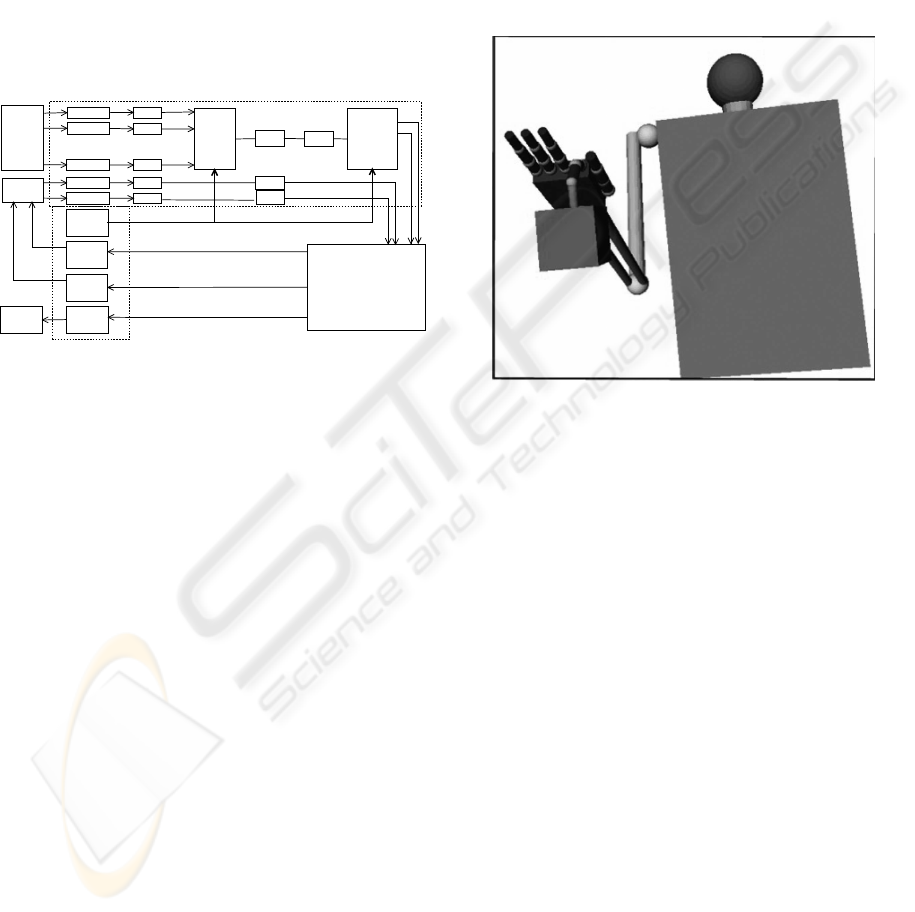
To a first approximation (Kaczmarek and Webster,
1989), we can model the skin-electrode contact as fol-
lowing (figure 3).
Figure 3: Electrode schema and realization.
Where R
0
is the resistance between the electrode
and the conductive gel, R
p
and C
p
are the resis-
tance and the capacity of the the electrode-skin inter-
face. According to previous works and empiric tests
(Kaczmarek and Webster, 1989), R
0
results smaller
than R
p
and can be ignored to a first approximation.
Therefore, if V is the impulse amplitude applied to
the electrode-skin interface, we can write the voltage
value presented on the subject tissue V
pp
as following:
V
pp
(t) = V (1 − e
−
t
τ
) (3)
V
pp
(t) = V e
−
t
τ
(4)
Equations 3 and 4 represent respectively the rising
and falling voltage characteristic.
We can see from the electrode-skin interface re-
sponse that the behavior is not linear. This represents
a problem for the electro-tactile stimulation because,
with fixed voltage at the electrodes, the current in-
jected can vary with time and so the touch sensation
felt by the subject. To avoid this problem, we can
control the current instead of the voltage.
In its turn the voltage V
pp
generates an electric field
into the skin surface that causes a potential on the ex-
ternal membrane of the axon fibre.
In their work (Kajimoto et al., 1999) Kajimoto H. et
al described the equivalent electric membrane model.
They related the potential value of the membrane sur-
face with the corresponding inner value for impulsive
stimulus according to the Hodgkin and Huxley theory
(Hodgkin and Huxley, 1952).
Membrane Voltage (mV)
60
40
20
0
-20
-40
-60
-80
-100
Time (ms)
0
10
20 30 40
50
60
Figure 4: Signal built by membranes of nervous axons ac-
cording to the Gate Theory. This picture has been built by a
Hodgkin-Huxley Model simulator (a).
Electrodes are controlled by a custom built TENS-
board able to generate a generic biphasic wave vary-
ing in frequency (1Hz-5KHz) and intensity (0-5mA)
according to the transcutaneous electrical nerve stim-
ulation theory. The area of the positive pulse is nearly
equal to the area of the negative impulse. This is
important to avoid that the electrolysis phenomena
might cause a permanent tissue damage.
The TENS board is divided into two main blocks.
The first block realizes the wave generator; it works
at low power and can interact with the PCL-812 A/D
board through 4 dedicated channels. An impulsive
digital signal is presented on the gate of a NPN tran-
sistor that performs a first small amplification, this re-
alizes the frequency base of the stimulation wave. A
digital potentiometer (RDAC) varies the amplitude of
the voltage signal. The RDAC is controlled through
the 3 remaining digital channels.
The second part of the board amplifies the signal
thanks to a couple of op-amp (Operational Ampli-
fier) and then elevates it through a voltage transformer
connected to the electrode. The transformer elevates
voltage from 5V to 100V and generates the biphasic
wave.
We completed the board introducing some capac-
itors to decouple the two phases of the signal trans-
formation. The output of the op-amp has been also
stabilized by a Boucherot block.
In this way the board is completely controlled by
the digital channels of the same A/D card used for
sensor measurements, and can send out the real-time
value of the current injected in the finger-tip. We are
A GLOVE INTERFACE WITH TACTILE FEELING DISPLAY FOR HUMANOID ROBOTICS AND VIRTUAL
REALITY SYSTEMS
355
able to control the current injected, making an instan-
taneous control loop (via software), both for safety
and adaptability to different users.
To make different experiments we used two
electro-stimulation channels of the same kind and dif-
ferent kinds of electrodes.
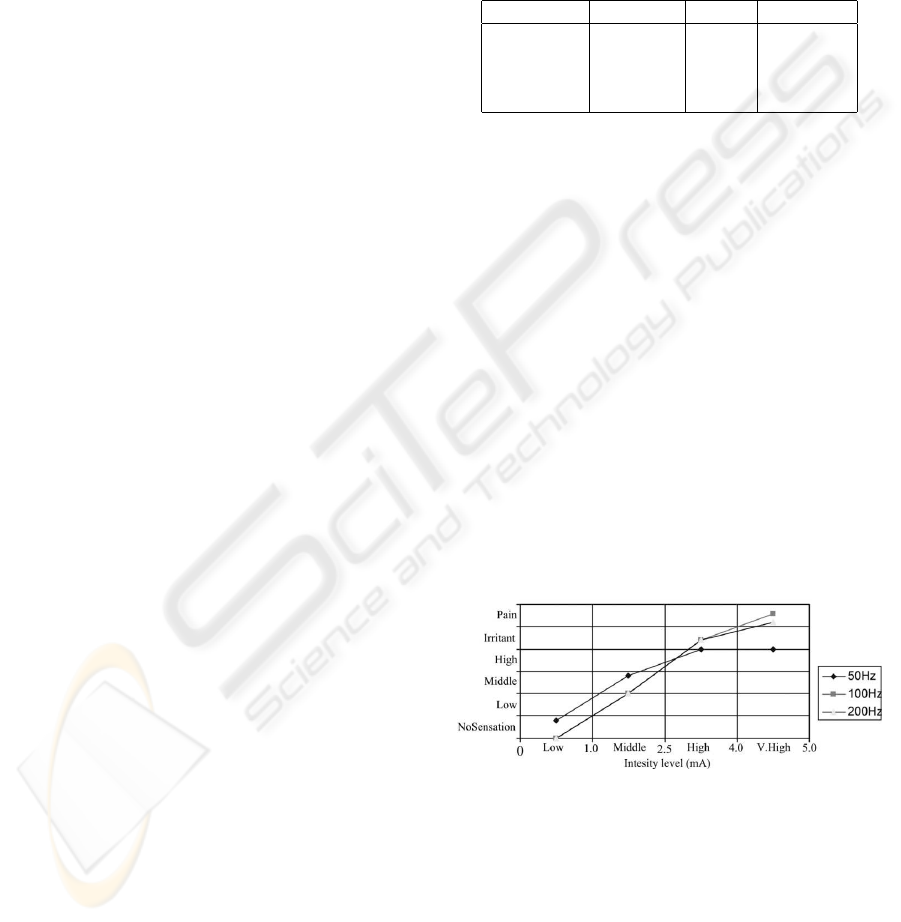
2.3 Acquisition and Control systems
The following schema (figure 5) presents the whole
acquisition and control process. Each block is de-
scribed by a name and its implementation techniques
(hardware/software).
Sensored
Glove
V-A/FM
Tens Card
Sensor_1
Sensor_1
Force_S
COND
P. Board
COND
P. Board
COND
P. Board
Multiplexer
A/D
PCL812
SH
SOFTWARE
Demultiplexer
Virtual Model
Collision Detection
VRML Software
4 bit MUX
HEF4067B
SOFTWARE
Counter
4 Bit
SOFTWARE
Timer
1 Bit
SOFTWARE
RDAC
Control
SOFTWARE
Force
Control
SOFTWARE
Attuator
Servo
SOFTWARE
TENS_1
TENS_1
COND
T. BOARD
COND
T. BOARD
A/D
PCL812
A/D
PCL812
Acquisition System
Control System
Figure 5: The acquisition and control blocks of the entire
process.
All the sensor measurements have been normalized
and multiplexed, using an electronic board and then
broadcasted through a single analogical channel to an
A/D general purpose card (PCL-812) mounted on a
PC executing the xPC-target tool of Matlab. Thanks
to xPC-Target architecture we can build physical in-
terfaces and control levels and execute them on dif-
ferent calculators, T arget and HostP C. Target-PC
plays also the role of implementing a first control loop
to determine and generate the real-time value of in-
jected current. A specific value is assigned by the vir-
tual model according to the object surface characteris-
tics; the control module sends data to the TENS-board
in order to stabilize that value. This is important to
generate similar sensations in different subjects.
Target-Pc is connected, using a RS232 interface,
with a mobile PC that plays the main role in build-
ing the world model. The model is realized through
a VRML file that can be viewed and analyzed by
a proper C++ program with capabilities of collision
detection, based on v-collide algorithm. The virtual
model simulator is composed by two main parts: a
communication module and an external module. The
communication module plays the role of interfacing
Matlab with the external VRML module. The ex-
ternal module implements the graphical engine and
records all the objects into a tree data base that can be
sent and parsed in real-time by the v-collide functions
in order to determine collisions between objects.
The Host-Pc can realize a second control loop
based on angular-sensor measurements, evaluating
collisions and then, through the actuator system, bind-
ing the finger movement and sending the proper
electro-cutaneous stimulation to the finger-tip.
The third and last control loop is made by the
user through a visual interface that shows the virtual
3D model (figure 6) and enables controls on every
process variables.
Figure 6: The VRML model permits the user to have a vi-
sual feedback.
All the software modules, except to the win32 C++
application for 3D model visualization and collision
detection, are built in Simulink and compiled for real-
time execution in Matlab.
3 ELECTRICAL
TRANSCUTANEOUS
STIMULATION EXPERIMENTS
We can divide our experimentation into two main
phases. At first we investigated the role of frequency
and current intensity with an half period pulse width,
then the duty cycle (pulse width) has been varied and
we have recorded the differences felt by the subject.
For each experiment we have prepared a question
set of tested points and a set of possible subject re-
sponses.
3.1 Role played by the stimulation
intensity and frequency
For the first experiment, we prepared seven different
frequency tests (from 5Hz to 400Hz), each of them
ICINCO 2005 - ROBOTICS AND AUTOMATION
356
differentiated in four levels of current intensity (from
low to very high). This means we have a global test
set of 28 values for each subject.
The two sets can be described by equation 5 (the
number values are expressed in Hz) and equation 6.
I
f
= {5, 10, 20, 50, 100, 200, 400} (5)
I
i
= {
Low Middle High V.High
} (6)
Each value of the I
i
set is defined by the correspon-
dent peak current interval as following:
• IǫLow ⇔ i ≤ 1mA
• IǫMiddle ⇔ (i > 1mA) ∧ (i ≤ 2.5mA)
• IǫHigh ⇔ (i > 2.5mA) ∧ (i ≤ 4mA)
• IǫV eryHigh ⇔ i > 4mA
The final question set can be described by the 28
position table described by equation 7.
I = I
f
× I
I
(7)
Each sensation produced by the electrical
mechanoreceptor stimulation has two main compo-
nents: the intensity level and the sensation evoked
in the human mind (Bach-Y-Rita et al., 2003). We
prepared two response sets in order to map either
components. The first set is composed by six possible
intensity response (from NoSesation to Pain). The
second one has seven elements corresponding to
seven possible sensation felt by users. We can write
the two sets as in equation 8 and equation 9.
R
i
= {NoSens., Low, M idd., High, Irrit., P ain}
(8)
R
f
= {B., I., V., T., R., W.} (9)
Where the sensation evoked values in the set are
Beats, Itch, Vibration, Tingle, Rasping and Warm.
To make a common guide for each experimenta-
tion we prepared an explicative table in which we
described every elements of each sets. The final re-
sponse set is described by the 42 position described
by equation10
R = R
f
× R
I
(10)
In this manner the first experiment can be described
as following:
∀fǫI
f
, ∀iǫI
I
⇔ Resp(f, i)ǫR (11)
For each frequency in the frequency set I
f
and for
each intensity level in the intensity set I
I
we note one
response of the response set R.
During the experiment we observed that subjects
felt a starting beat when stimulation started. This beat
could be uncomfortable in many cases. We recorded
subject starting beat sensations at 50Hz and 200Hz for
the middle intensity level.
After the data acquisition we prepared a double en-
tering table where we put the mean and variance of
R
i
elements response. For brevity we present only
the shortest version of this table in which we put the
whole data grouped by intensity levels. Data is shown
in figure7.
Intensity Current Mean Variance
Low 0-1mA 1.14 0.04
Middle 1-2.5mA 2.06 0.02
High 2.5-4mA 3.26 0.06
Very-High 4mA+ 4.09 0.17
Figure 7: Mean and variance values of subject responses.
Values under 1mA (Low) are inappreciable to most
of the subjects. Subjects felt low sensation between
1mA and 2.5mA (Middle). At this level they can
be distracted by other stimuli, like people speaking,
and because of that they forget the current stimula-
tion. This is an important consequence of filter theory.
Values between 2.5mA and 4mA (High) are strongly
felt by the subjects. In this case subjects cannot be
distracted by other external stimulus. Values up to
4mA (Very-High) are considered strong and uncom-
fortable. In some case subjects feel pain. The high
variance present for this data group suggests us to in-
crement the number of elements of I
i
decreasing steps
especially for high values (4mA+).
The graphic in figure 9 shows the subject mean per-
ceived values related to the real intensity of the elec-
trical stimulus. For brevity we present only the 50Hz,
100Hz and 200Hz graphs.
50Hz
100Hz
200Hz
Figure 8: Subject sensations by electric pulse intensity.
As we can see by the graph, the sensation perceived
by the subject grows logarithmical with stimulation
intensity. This supports the Steven’s theory (Darley
et al., 1994) according tp which the sensation felt by
a subject grows following the equation 12.
S = K · I
b
(12)
Where S is the sensation perceived by the subject,
I is the stimulus entity, K and b are two constants that
A GLOVE INTERFACE WITH TACTILE FEELING DISPLAY FOR HUMANOID ROBOTICS AND VIRTUAL
REALITY SYSTEMS
357
depend on each subject. In the transcutaneous stimu-
lation K and b depend also on the impulse frequency.
This is true if we think that the Hodgkin and Huxley
relation (Hodgkin and Huxley, 1952), between gener-
ator potential and axon activation potentials, suggests
a proportionality between frequency of axons poten-
tial and stimulus intensity. We can realize an empiri-
cal calibration of K and b in order to prepare the per-
sonal subject sensation function.
To study the sensations evoked by the electrical
stimulation, we prepared a second double entering ta-
ble in which we described for each f,i couple the R
f
element the subject response.
Here we present a shortest version of this table
where we describe all the results grouped by fre-
quency values. The table is shown in figure 9.
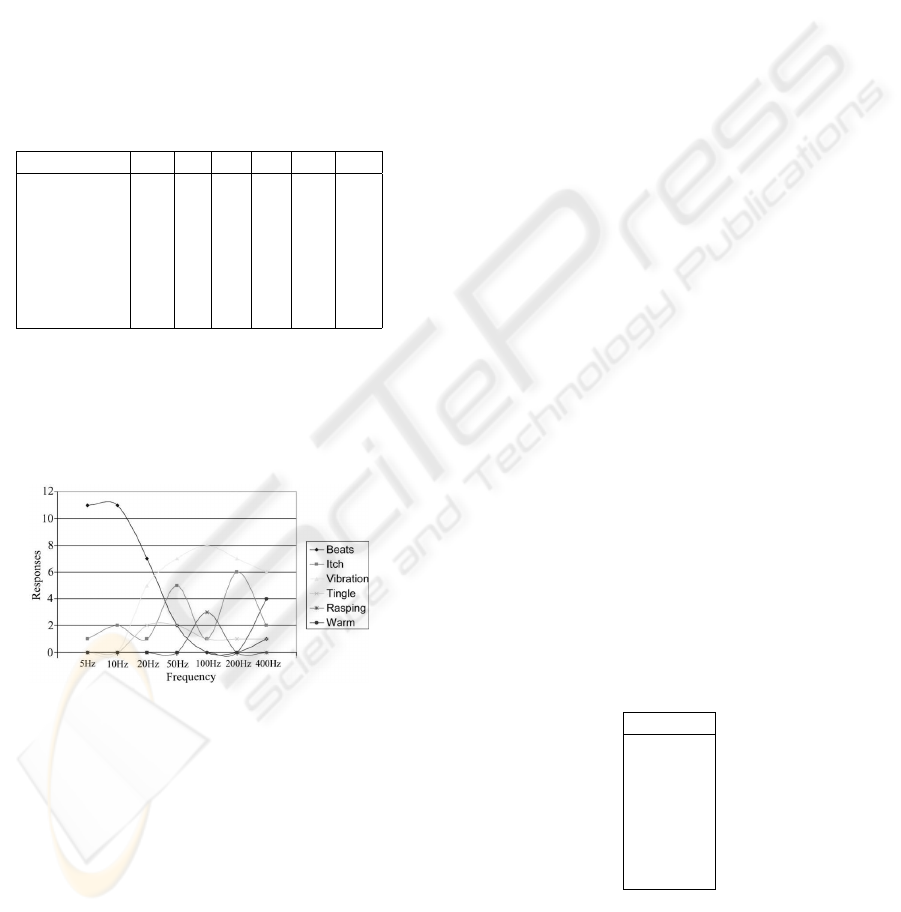
Frequency B. I. V. T. R. W.
5Hz 11 1 0 0 0 0
10Hz 11 2 0 0 0 0
20Hz 7 1 5 2 0 0
50Hz 2 5 7 2 0 0
100Hz 0 1 8 1 3 0
200Hz 0 6 7 1 0 0
400Hz 1 2 6 1 0 4
Figure 9: Subject sensations by frequency values. Beats,
Itch, Vibration, Tingle, Rasping, Warm
From this table we can build a graph related to the
sensations evoked during the experiment (Figure 10).
Beats
Vibration
Itch
Rasping
Tingle
Warm
Figure 10: Data graph of subject sensations by frequency
values.
We can see that at very low frequency (from 5Hz
to 20Hz) subjects feel beats and small pressure sen-
sations. Merkel cells are sensible to that frequency
and seem to be specialized in detection of pressure
and surface deformations. At middle frequency (from
100Hz to 200Hz) a new sensation of vibration was
evoked. Users can’t understand, in many cases, the
period of the impulsive current but can only perceive
a sensation of rapid vibration or grasping object under
the fingertip surface. If we think that grasping sensa-
tion can be related to hard vibration, we can assure
that the 82% of the sensations evoked by a stimulus
of about 100-200Hz can be identified as a vibration
stimulus. This agrees with the former works that sug-
gested that Pacinian Corpuscles are sensible to vibra-
tion and operate at that frequency (Kajimoto et al.,
1999).
The starting beat tests produced no interesting data.
We could only see that starting beat sensation grows
with intensity. This can be connected to the typical
adaptability (Guyton, 1987) of each mechanoreceptor
in the fingertip.
To determine the maximum frequency that the hu-
man mechanoreceptors may perceive, we tried stimu-
lations at 1.2KHz and 5.0KHz. We noted that no sub-
ject can perceive impulses faster than 5.0KHz. This
value can be assumed as a first upper bound.
3.2 Pulse Width Modulation of the
electrical stimulation wave
In the second experiment we tried to demonstrate the
role played by the impulse width of the electrical
stimulation wave. We fixed the frequency at two sig-
nificant values (10Hz - 50Hz) for two intensity levels
and then we asked the subject to describe the differ-
ence perceived varying pulse width from 10% to 90%
of the whole period.
Question sets are described by equation 13, equa-
tion 14 and equation 15.
I
f
= {
10Hz 50Hz
} (13)
I
i
= {
Middle High
} (14)
I
w
= {
10% 90%
} (15)
Where I
f
describes test frequency values, I
i
is the
intensity level set and I
w
is the impulse width values
of the experiment. Response set R
w
is described by
table 1
Table 1: Response set
R
w
Lower
Stronger
Softer
Harder
Faster
Slower
Equal
The Lower and Stronger values mean that the
subject feels the same sensation but perceives some
variation in the intensity level. The Sof ter and
Harder values mean that subject feels the same in-
tensity of the half width impulse but with a less
ICINCO 2005 - ROBOTICS AND AUTOMATION
358

or more clear sensations. The F aster and Slower
values are connected to the perceived sensation of
changed speed. Finally Equal value means that the
subject doesn’t perceive any kind of variation.
The whole experience can be described by equation
16.
∀fǫI
f
, ∀iǫI
i
, ∀aǫI
w
⇔ Resp(f, i, a)ǫR
w
(16)
Results of the data acquisition are described in ta-
ble shown in figure 11, where we grouped data by
impulse width.
w L. St. So. H. F. Sl. E.
10% 11 0 0 4 0 0 5
90% 0 9 8 0 1 0 2
Figure 11: Subject responses about sensation driven by
pulse width modulation. Lower, Strong, Softer, Harder,
Faster, Slower and Equal sensation.
Subjects feel lower sensation (Lower) for small
pulse width (10%) but also a clear sensation was
evoked (Harder). For large impulse width (90%)
the subjects feel stronger sensation (Stronger) but
smoother (Softer) than the first one. We can use pulse
width modulation in order to evoke clear or smooth
tapping sensation based on the same frequency level.
4 HAPTIC USER INTERFACE
The last experiment we made involved the force feed-
back, the cutaneous touch sense and a visual system.
It can be divided into tree main phases. In the first part
we used the force feedback system alone. The PCL-
812 controls the servo angular position every 10ms;
if a touch position is reached, servo reacts by slowing
the finger movement. We can change the servo speed
and touch position in order to simulate hard or soft
surface of every dimensions.
The second experiment involved both force and cu-
taneous feedbacks. We introduced an electrical stimu-
lation (100Hz, middle intensity level) on the fingertip
when the subject reach the virtual object.
The third part of the experiment introduced the vi-
sual and the collision detection systems. We present
to the subject a VRML virtual model of the human
hand and the objects (Figure 6). When the system de-
tects collisions between the hand and the objects, the
force feedback and the cutaneous stimulation are acti-
vated in order to give to the subject a fully immersive
sensation.
For all the experiments we prepared two virtual ob-
jects of different dimension. For each object we tested
two different force opposition values. We can de-
scribe the question set related to the object dimension
through equation17.
I
d
= {
Small Big
} (17)
and the question set related to the object hardness
through equation 18.
I
f
= {
Sof t Hard
} (18)
the resulting question set is composed by the 4 po-
sition table described in equation 19.
I
n
= I
d
× I
f
(19)
Where n is the experimentation number (from 1 to
3). For each part of this experiment, we presented the
virtual object to the subject and then we asked him to
recognize its properties choosing his answers into a
response set of the same kind of I
n
.
Subjects recognized object hardness and dimen-
sions in each phase, but only when we introduced
visual system, they were able to assign a correct
shape interpretation for the touched object. Summa-
rizing, with force feedback system only, subjects feel
a movement opposition force but not a real touch-
ing object sensations. Combining force feedback and
electrical touch system, subjects can determine the
contact position accurately but already they do not
feel a real detectable touching sensation. When the
whole system was tested, subjects easily affirmed that
they were touching an object of the correct shape.
This is an important result if we think that the in-
troduction of the visual system produces a lag into the
frame rate of about 50ms (100ms of V-Collide system
to 10ms of Simulink model), five times higher than
the servo impulse ratio. This lag is due to the algo-
rithm for the collision detection analysis and to the
communications between the two interacting software
tasks.
5 CONCLUSION
In this paper we presented an haptic interface for ap-
plication in virtual reality and for tele-manipulation
systems.
In the first part we described the model, the hard-
ware and the software used. In the second part
we presented three main experiments. The first ex-
periment explores transcutaneous electrical stimula-
tion frequency in order to evoke vibration and pres-
sure sensations. We can determine, by a calibration
process, the K and b parameters of the Steven law
(Darley et al., 1994) to fix the intensity levels of each
subject. Once we found the correct intensity and fre-
quency of stimulations, we explored the pulse width
modulation capabilities.
A GLOVE INTERFACE WITH TACTILE FEELING DISPLAY FOR HUMANOID ROBOTICS AND VIRTUAL
REALITY SYSTEMS
359

In the last part we tested the force feedback, the
touch display and the visualization system in order to
simulate a virtual object with different hardness and
dimensions. Our results demonstrated how integrat-
ing these three kinds of stimulus offered to the subject
a more realistic interaction with the virtual world.
REFERENCES
Ambrose, R., Askew, S., Bluethmann, W., Diftler, M.,
and Lockheed, M. (2001). Humanoids designed to
do work. Proc. IEEE-RAS Humanoids2001 Confer-
ence,Tokyo,Japan, pages 173–180.
Bach-Y-Rita, P., Tyler, M. E., and Kaczmarek, K. A.
(2003). Seeing with the brain. Internationa Journal
of Human-Computer Interaction, 15(2).
Bouzit, M., Popescu, G., Burdea, G., and Boian, R. (2002).
The rutgers master ii-nd force feedback glove. Pro-
ceedings of IEEE VR Haptics Symposium.
Burdea, G. C. (1999). Haptic feedback for virtual reality. In
Proc. Virtual Reality and Prototyping Workshop.
Darley, J. M., Glucksberg, S., and Kinchla, R. A. (1994).
Psicologia. Il Mulino Prentice Hall International.
Fahn, C. S. and Sun, H. (2000). Development of a sensory
data glove. In Proc. ICAT 2000.
Folgheraiter, M., Baragiola, I., and Gini, G.(2004) Teach-
ing grasping to a humanoid hand as a generalization
of human grasping data. Lecture Notes in Computer
Science, 3303 / 2004:139.
Guyton, A. C. (6th Edition, 1987). Textbook of Medical
Physiology. Saunders Company, Philadelphia, PA.
Hodgkin, A. L. and Huxley, A. F. (1952). A quantitative
description of membrane current and its application to
conduction and excitation in nerve. Science.
Adams, J. R., Klowden, D., and Hannaford, B. (2001). Vir-
tual training for a manual assembly task. Haptics-e,
2(2).
Kaczmarek, K. A. and Webster, J. G. (1989). Voltage-
current characteristics of the electrotactile
skin.electrode interface. IEEE Engineering in
Medicine and Biology Society 11TH Annual Interna-
tional Conference.
Kajimoto, H., Kawakami, N., Maeda, T., and Tachi, S.
(1999). Tactile feeling display using functional elec-
trical stimulation. In Proc. ICAT’99.
Melzack, R. and Wall, P. D. (1965). Pain mechanisms. a
new theory. Science, 150(971-9).
ICINCO 2005 - ROBOTICS AND AUTOMATION
360
