
CONFIDENCE BASED ESTIMATION AND DETERIORATION
INDICATION OF ON-LINE MEASUREMENT
Jari Näsi, Aki Sorsa
Control Engineering Laboratory,University of Oulu, P.O. Box 4300, FIN-90014 University of Oulu, Finland
Keywords: Reliability, validation, optimal estimation.
Abstract: In an industrial process, the accuracy and reliability of process creates basics for control system and
ultimately to product uniformity. Measurement results, whether from fast on-line sensors or from sample-
based laboratory analyses, is the key for selecting the method for process control and analysis. Intelligent
and advanced control methods, exploiting measurements, are of no benefit if the measurements cannot be
trusted. This paper presents an estimation method for combining real-time redundant signals, consisting of
sensor data, and analytical measurements. The validation of on-line measurement uses less frequently
updated but more accurate information to validate frequently updated but less accurate on-line
measurements. An estimate of the measured variable is obtained as a weighted average of the on-line
measurements and laboratory analyses. The weighting coefficients are recursively updated in real time when
new analysis and measurement results are available. The calculation of optimal estimate can be used in
several industrial applications for more precise process control. In addition, pre-processed data is used to
calculate a “need for maintenance indicator” to warn the operator for sensor breakdowns, wearing or
deterioration and detect calibration needs. The operator’s workload is reduced in problematic situations
where measurement and validation signals are not convergent, by offering calculated best estimation.
1 INTRODUCTION
The validation means the verification of the
measurement with other information or
measurements. The practical problem is to validate a
continuous measurement using its previous values or
a corresponding laboratory analysis as a reference.
Laboratory analyses are commonly used in process
industry, but the purpose of the use and criticality of
analyses vary. Normally, analyses are used either to
monitor the process, or to validate on-line
measurements. If based solely on laboratory
analysis, process control becomes inefficient
because of the infrequency of analyses. Several
factors make it difficult to validate sensor data and
to calculate confidence levels. The difference
between slight sensor failures and noisy sensor
readings is not easy to verify if the process and time
delay in reference analysis is not known. On the
other hand, laboratory analysis improves control
when it is used to validate and correct on-line
measurements. The calculation of the optimal
estimate has three parts: pre-processing, confidence
level estimation and the calculation of the estimate
(Figure 1).
Applied maximum and minimum limits are
defi
ned by process dynamics, not by analyzers
maximum measuring range. In this way, the
accepted area of the operation becomes more
realistic. Fuzzy limits are used for softening change
between reliable and non-reliable values. Example
data consists redundant sensor data from electrolytic
zinc production process, where analyzer measures
Fe
2+
content in the dissolution reactor. Deterioration
of the measurement device causes drifting and
occasional breakdowns. Measured value is used for
process monitoring, not for control and if working
properly, it gives useful information about process
condition.
340
Näsi J. and Sorsa A. (2005).
CONFIDENCE BASED ESTIMATION AND DETERIORATION INDICATION OF ON-LINE MEASUREMENT.
In Proceedings of the Second International Conference on Informatics in Control, Automation and Robotics - Signal Processing, Systems Modeling and
Control, pages 340-343
DOI: 10.5220/0001163703400343
Copyright
c
SciTePress

Classifier
Bias
correction
Confidence
level
Confidence
level
Confidence
level
based
reasoning
Laboratory
analysis
Continuous
signal
Signal validation
Optimal
estimate
Absolute and
Fuzzy limits
Det eriorat ion
indicator
Classifier
Bias
correction
Confidence
level
Confidence
level
Confidence
level
based
reasoning
Laboratory
analysis
Continuous
signal
Signal validation
Optimal
estimate
Absolute and
Fuzzy limits
Det eriorat ion
indicator
Figure 1: Different steps in the signal processing to the
optimal estimate
The confidence levels are estimated for both the
measurement and laboratory analysis. The
measurement’s confidence level is determined by
two criteria: change between measurements and the
deviation from the laboratory analysis. The
confidence level of the laboratory analysis depends
only on time since the analysis has been done. The
optimal estimate is calculated according to an
algorithm by using the pre-processed measurement,
laboratory analysis and the confidence levels.
Various control methods can be effective in
dealing with uncertain measurements, but
measurement noise and errors effect on their
performance. Outliers constitute a challenging
problem and detecting them is much easier for
human than for a computer. The self-validating
(SEVA) approach provides tools for the single
sensor signal validation (Henry, 1993). The
approach utilizes sensor fault detection and
uncertainty estimation to produce advanced
information about the measurement. Multi-sensor
data fusion can be used, when multiple sensors are
used to measure the same variable (Luo et al., 2002).
Thus a measurement is validated with other sensor
data.
In redundancy-based approaches, duplicate
measurements or a process model is used to generate
a residual vector by comparing the measurements
from multiple sensors or output of the process model
and actual measurements. The residuals can be
examined with many methods to make a decision
about the sensor malfunctioning. Such methods
include multi-sensor data fusion, voting systems,
expert systems, artificial intelligence, fuzzy logic
and neural network approaches (Amadi-Echendu,
1996). Model based fault detection and identification
(FDI) methods are thoroughly discussed in survey
papers by Isermann (1984) and Frank (1990). Voting
systems require three or more measurements of same
variable (Willsky, 1976). The deviating opinion
(measurement) is neglected as the decision is made
based on the majority of similar measurements. The
voting system may include advanced characteristics
as the differentiation between process upsets and
sensor failures may be included in the reasoning
(Stork & Cowalski, 1999).
2 OPTIMAL ESTIMATE
In this paper, the measurement validation problem is
converted into the calculation of an optimal estimate
of the measured variable based on the confidence
levels of the actual and reference measurements. The
calculation of the optimal estimate is divided into
signal validation, confidence level estimation and
calculation of the estimate.
2.1 Absolute and fuzzy limits
Absolute limits define the scale, where process
parameter can vary under normal process conditions.
The upper limit gives the maximum reliable value. If
measurement device gives larger values than this,
they should be ignored and replaced with other
process information. Similarly, smaller values than
minimum should be replaced. The limits can be
defined manually by experts, but they can be also
defined automatically from process data.
Fuzzy limits are used to narrow the area limited
by absolute limits and for softening change between
reliable and non-reliable measurement. Efficient use
of fuzzy limits, combined to the absolute limits and
reference measurement creates basics to the reliable
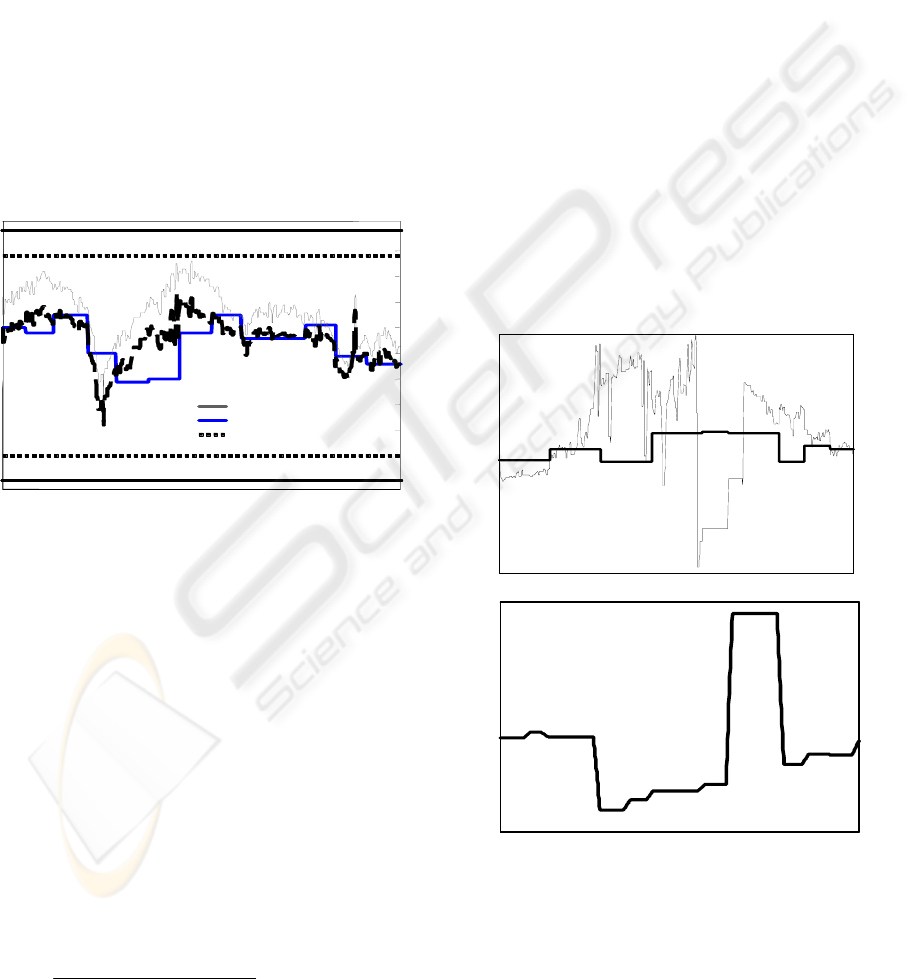
calculation of “optimal” signal (Figure 2).
2.2 Signal validation
After the definition of the absolute and fuzzy limits,
the classifier (Figure 1) detects the outliers and
deviating values and replaces them with an estimate.
If the measured value is inside the fuzzy limits, the
classifier considers it valid. In this case, the weight
of the measurement is 1. In the case of an outlier,
(measured value is beyond the absolute limits) the
weight of the measurement is 0 and the output of the
classifier is either the previous measured value or
the latest reference analysis. If the measurement is
inside the fuzzy zones, the output from the classifier
is a weighted average of the actual measured value
and the reference value. In this fuzzy zone, the
weight of the measurement decreases from 1 to 0.
CONFIDENCE BASED ESTIMATION AND DETERIORATION INDICATION OF ON-LINE MEASUREMENT
341
In the case of a gradual degradation (e.g., a sensor
drift), the faulty signal is not immediately
abandoned but its influence on measurement
estimation is diminished as a function of change and
deviation from the laboratory analysis. This is
achieved by decreasing the relative weight of the
degraded signal. When the degradation strengthens,
monotonic function diminishes its relative weigh.
2.3 Confidence levels and calculated
estimate
As earlier described, the pre-processing provides
practical signal for actual processing. The
confidence levels are calculated for analyzer and
laboratory analysis signals (Figure 2). The optimal
estimate is then calculated using the pre-processed
signals and confidence levels.
A bs o lu te lim it
Fuzzy limit
Measurem ent
Laboratory analysis
E s tim ate
A bs o lu te lim it
Fuzzy limit
Measurem ent
Laboratory analysis
E s tim ate
Figure 2: Limits, on-line measurement, laboratory analysis
and calculated estimate
The confidence level of the measurement is
determined by two criteria: the deviation of the
measurement from the laboratory analysis and
the
change between consecutive measurements. The
confidence level of laboratory analysis depends only
on time. When a new result is available, its
confidence level is 1. The aging of the analysis
decreases the confidence level closer to 0. However,
the laboratory analysis must be trusted (at least a
little) always and therefore its confidence level never
decreases to 0.
In the calculation of an estimate, the pre-processed
signal, laboratory analysis and calculated confidence
levels are used. Estimate is trusted always when its
confidence level is relatively high (the confidence
level of the laboratory analysis is decreased by a
coefficient (1 – C
m
)). The estimate (X
e
) is calculated:
lmm
llmcm
e
CCC
XCCXC
X
)1(
)1(
−+
−+
=
, where
C
m
is confidence level of the measurement
C
l
is confidence level of the laboratory analysis,
X
c
is validated measurement and
X
l
is laboratory analysis.
3 DETERIORATION INDICATOR
Information produced in the calculation of the
optimal estimate is used also for calculation of on-
line deterioration (need for maintenance) indicator.
Pre-processed data sets are combined in the
validation block, where difference between on-line
measurement and laboratory analysis is calculated
and changes in the bias error are turned to the on-
line deterioration indicator. In these cases, drift in
the indicator value shows on-going deterioration in
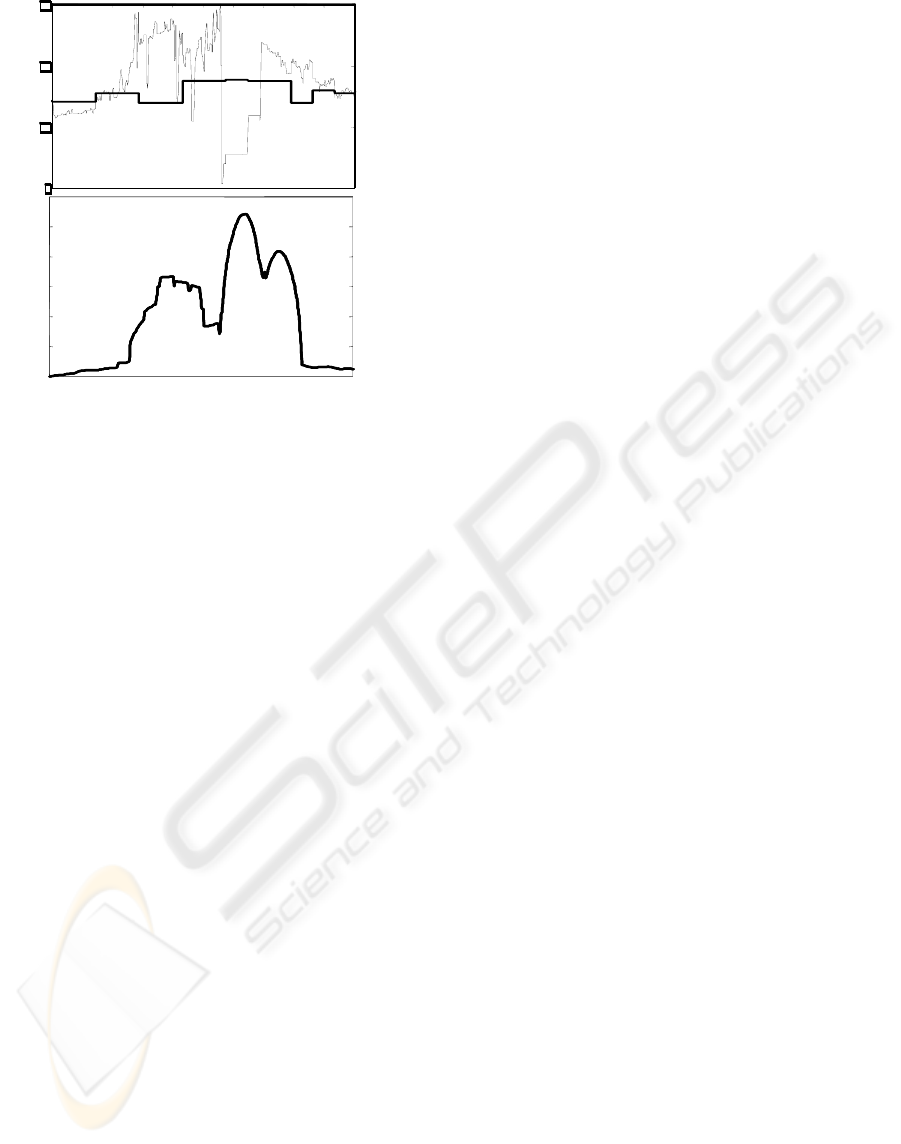
the measuring device (Figure 3).
A more sophisticated way to estimate changes in
the deterioration indicator is to calculate changes in
the measurements standard deviation (Figure 4). As
long as a measuring device works properly, standard
deviation should stay nearly constant.
5
10
15
20
5
10
15
20
5
10
15
20
5
10
15
20
5
10
15
20
5
10
15
20
5
10
15
20
5
10
15
20
Figure 3: Bias error- based deterioration indicator,
calculated from on-line measurement and laboratory
analysis showing deterioration and breakdown. Data set
represents one week time period from real process
ICINCO 2005 - SIGNAL PROCESSING, SYSTEMS MODELING AND CONTROL
342
5
10
15
20
5
10
15
20
5
10
15
20
5
10
15
20
5
10
15
20
5
10
15
20
5
10
15
20
5
10
15
20
5
10
15
20
5
10
15
20
5
10
15
20
5
10
15
20
5
10
15
20
5
10
15
20
5
10
15
20
5
10
15
20
5
10
15
20
5
10
15
20
5
10
15
20
5
10
15
20
5
10
15
20
5
10
15
20
5
10
15
20
5
10
15
20
5
10
15
20
5
10
15
20
5
10
15
20
5
10
15
20
5
10
15
20
5
10
15
20
5
10
15
20
5
10
15
20
Figure 4: Standard deviation- based deterioration indicator
to the same data as in Figure 3
Results from the indicator fall into two
categories: need for calibration and warning for
breakdown — depending on how the application is
adjusted. Beginning deterioration is compensated in
the pre-processing and in the calculation of the
estimate, but after a certain point confidence values
and confidence of the estimate descends. Warnings
may contain information about problems in the
measuring device (on-line analysis is not reliable
and estimate is based mainly to the laboratory
analysis).
4 CONCLUSIONS
Used data validation and estimation combines
information from laboratory analyses and
measurement device to calculate the optimal
estimate of the actual process variable. This
reconstructed data is then brought forward to
operators or used by the controller (the estimate can
be applied as a part of advisory or direct control
strategy depending on the target process).
Used limits in data validation are proven to be
critical, since too strict limits give laboratory
analyses unnecessarily big weight and lose fast and
short-time changes in the process. On the other
hand, limits too wide allow faulty measurement
device readings to be accepted and utilized in further
process control (malfunctions of the measurement
device are not differentiated from process upsets). If
a faulty measurement device is detected
(measurement device readings change more rapidly
than process dynamics will allow or signal is not
inside the area of operation) estimation algorithm
tends to follow laboratory analysis and only when
possible takes advantage from the measurement
device data.
Output of the classifier (weighted estimate of the
measured variable) is generated in the real time and
the admissible range is adjusted as a function of
process conditions. The effects of the failures and
measurements oscillation are taken into account by
diminishing their relative weight. Real data sets have
been collected from an operating plant.
A model of the physical process or expert
knowledge is not needed for successful calculation
of the estimate. Only prominent data period of
measurement device data and analytical
measurements are needed for basis of the process
parameters estimation. The pre-processing
manipulates measurements that are beyond the fuzzy
limits of the variable’s dynamic range and corrects
the static error between measurement device data
and laboratory readings.
The confidence level of the measurement is
determined by the deviation of the measurement
from the laboratory analysis and by change between
individual measurements. Respectively the
confidence level of laboratory analysis is only time-
dependent. The weight coefficients of the on-line
signal and laboratory measurements are adaptively
updated.
REFERENCES
Amadi-Echendu, J.E., 1996. Concepts for Validating
Intelligent Process Measurements. ISA Transactions,
vol. 35, 357-364.
Frank, P.M., 1990. Fault Diagnosis in Dynamic Systems
Using Analytical and Knowledge-based Redundancy –
A Survey and Some New Results. Automatica, vol.
26, no. 3, 459-474.
Henry, M.P. & Clarke, D.W., 1993. The Self-validating
Sensor: Rationale, Definitions and Examples. Control
Engineering Practice, vol. 1, no. 4, 585-610.
Isermann, R., 1984. Process Fault Detection Based on
Modelling and Estimation Methods – A Survey.
Automatica, vol. 20, no. 4, 387-404.
Luo, R.C., Yih, C.-C. & Su, K.L., 2002. Multisensor
Fusion and Integration: Approaches, Applications, and
Future Research Directions. IEEE Sensors Journal,
vol. 2, no. 2, 107-119.
Stork, C.L. & Kowalski, B.R., 1999. Distinguishing
Between Process Upsets and Sensor Malfunctions
Using Sensor Redundancy. Chemometrics and
Intelligent Laboratory Systems, vol. 46, 117-131.
Willsky, A.S., 1976. A Survey of Design Methods for
Failure Detection in Dynamic Systems. Automatica,
vol. 12, 601-611.
CONFIDENCE BASED ESTIMATION AND DETERIORATION INDICATION OF ON-LINE MEASUREMENT
343
