
MODELING OF MOTOR NEURONAL STRUCTURES VIA
TRANSCRANIAL MAGNETIC STIMULATION
Giuseppe d’Aloja, Paolo Lino, Bruno Maione, Alessandro Rizzo
DEE-Dipartimento di Elettrotecnica ed Elettronica – Politecnico di Bari – Via Re David 200 – 70125 Bari Italy
Keywords: Neuronal Modeling, Spiking Neu
rons, Brain Waves, TMS.
Abstract: Transcranial Magnetic Stimulation (TMS) of human motor area can evoke different biological waves in the
epidural space of patients. These waves can evoke different muscle responses according to different types
and amplitudes of stimuli. In this paper we analyze the different types of epidural waves and we propose a
neuronal model for the biological structures involved in the experiments.
1 INTRODUCTION
Human nervous system is something much complex
and its operation is still rather obscure to scientists.
Nevertheless, more and more emerging techniques
are helping scientists in examining the human brain
in detail and making hypotheses on its operation. For
example, the use of transcranial cerebral
stimulations, such as the Transcranial Magnetic
Stimulation (TMS), allows us to understand some
cerebral mechanisms and identify several cerebral
areas. Pioneering studies on brain stimulation
through the intact scalp were carried out in the early
80s (Merton and Morton 1980) by stimulating the
brain through an electric field. This stimulation
technique is called Transcranial Electrical
Stimulation (TES). Unfortunately, it has been found
that TES is quite uncomfortable to the patient,
because only a small fraction of the applied current
flows through the resistance of the skull and scalp
into the brain, while the rest travels between the
electrodes on the surface, causing local pain and
contraction of scalp muscles. The development of
TMS (Barker et al., 1985) overcame these problems
of discomfort by using a magnetic field to carry the
electrical stimulus across the scalp and skull to the
brain. Opposite to the TES, TMS is painless and
lacking in harmful effects to the human nervous
system. TMS has also been exploited with success in
the treatment of mental illness and depression
(Wasserman, 1998). The first magnetic stimulators
were very heavy and they could reach low
stimulation frequencies. Recently, novel stimulators
with lower weight and smaller size have been
designed. The stimulator used in the experiments is
the Magstim 200
®
(Jalinous 1997). The magnetic
stimulation adopted in the experiment is provided by
a 70mm (internal diameter), eight-shaped coil,
placed above the cerebral motor area responsible of
the left hand movements. Different levels of
stimulation have been used, from 20% to 53% of the
maximum stimulator output, using a 3% increasing
step. The experimental data are collected from
patients who have spinal chord stimulators
implanted in the epidural space at C1-C2 vertebras
for the treatment of intractable dorsolumbar pain (V.
Di Lazzaro, 1998). Two different types of data are
available: the recordings from the patient’s epidural
space and the EMG recordings. The former is
important for the understanding of the nature of
brain waves; the latter is important for the
understanding of the effects of the voluntary muscle
contraction on the recorded muscle potentials. In
particular, the effects of voluntary contraction are
important at motoneuronal level, but they do not
influence the corticospinal volleys, as it will be
shown in the following. The paper is structured as
follows: in the next section we analyze the epidural
recordings of the biological waves, and the artifacts
due to the stimulus and the measurement method.
Moreover, we propose a first-attempt linear model.
In the third section we exploit the Izhikevich
nonlinear neuron model to build a model of the
neuronal structure under investigation. In the fourth
section we show the results. Finally, we draw our
conclusions in the fifth section.
45
d’Aloja G., Lino P., Maione B. and Rizzo A. (2005).
MODELING OF MOTOR NEURONAL STRUCTURES VIA TRANSCRANIAL MAGNETIC STIMULATION.
In Proceedings of the Second International Conference on Informatics in Control, Automation and Robotics - Signal Processing, Systems Modeling and
Control, pages 45-51
DOI: 10.5220/0001160500450051
Copyright
c
SciTePress
2 DATA ANALYSIS
The data analyzed in this paper have been collected
in experiments carried out by Prof. V. Di Lazzaro
and co-workers at the Neurological Institute at
Cattolica University in Rome, Italy. The recordings
have been collected from a patient with epidural
electrodes implanted at C1-C2 vertebras level. The
left hand motor area of the patient’s brain has been
stimulated by TMS. Consequently, brain potentials
have been evoked and recorded by a differential
amplifier from the epidural electrodes, and by an
EMG recorder from the First Dorsal Interosseus
muscle (FDI) of the left hand. Experimental data
have been recorded with different amplitudes of
magnetic stimulation and different levels of
voluntary muscle contractions.
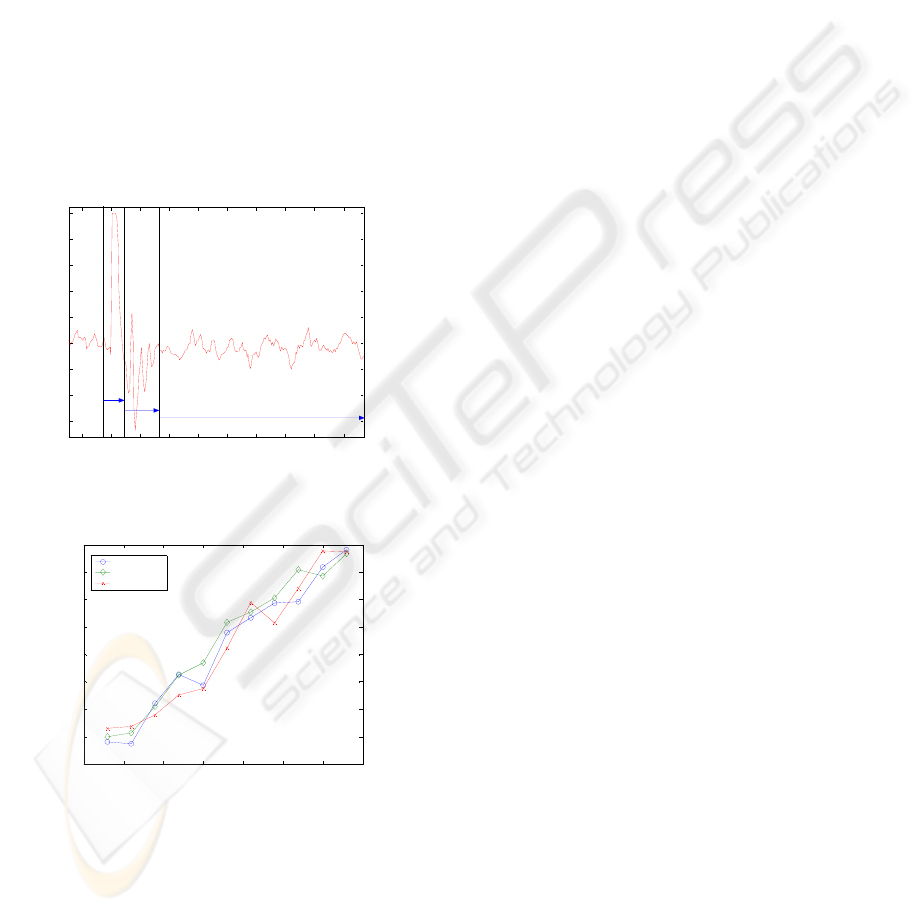
Figure 1 shows a typical recording taken at the
epidural electrodes. Three different zones can be
clearly distinguished:
• Zone one: stimulus artifact;
• Zone two: actual biological waves;
• Zone three: noise.
Biol ic TMS are of two kinds
ve
re is always a saturated peak
particular case of this patient it has been
og al waves evoked by
(Di Lazzaro, 2004). The first one, called D wave
(Direct wave) is supposed to be produced by direct
stimulation of the pyramidal tract axons. The second
one is called I wave (Indirect wave), and is supposed
to be produced by synaptic activation of the
pyramidal neurons of the same tract. With TMS, a D
wave is present only if the stimulus amplitude is
greater than a threshold, whereas I waves are always
present. If a D wave is present, it precedes the I
waves. In the recorded data, I waves are numbered
according to their temporal sequence. The
recordings have been collected using a differential
method; therefore, for each volley recorded, two
peaks (a positive and a negative one) are present .
Figure 2 shows the amplitude of the I1 wa
(computed on the experimental data as the half-
peak-to-peak amplitude) for different voluntary
muscle contraction at different stimulation levels. As
it is seen from Figure 2 the amplitude of the I1 wave
increases linearly with the stimulation level and it is
independent from the voluntary contraction level. In
fact, muscle contraction increases motoneuronal
excitability and has no effect at the corticospinal
level. On the other hand, voluntary contraction
makes the recordings more noisy and lowers the
signal to noise ratio.
In our recordings the
which occurs at the same instant (0.02s) of
application of the magnetic stimulus. This saturated
peak is biologically implausible, and systematically
occurs in every experimental recording. Thus, we
can conclude that this is a stimulus artifact due to
both the electromagnetic coupling and the
displacement current (O’Keffe et al., 2001),
(McLean et al., 1996). To analyze the actual
biological waves we have reconstructed the stimulus
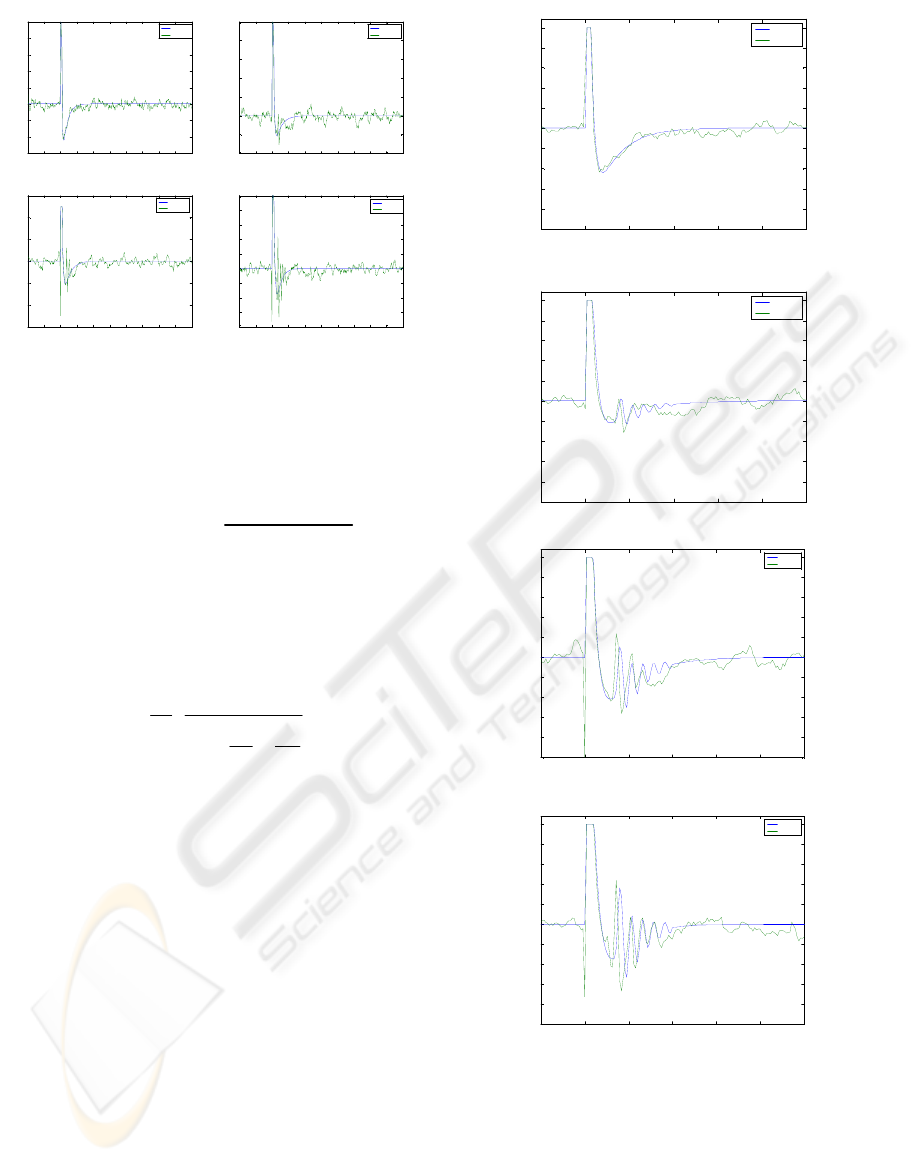
artifact for different stimulation amplitudes. In
particular we have developed 4 different stimulus
artifact models according to the stimulus amplitude.
Figure 3 shows, in clockwise direction from top-left,
the stimulus artifacts from low to high stimulation
intensity. In our modeling, the reconstructed
stimulus artifact is subtracted from the experimental
data to obtain the experimental biological waves to
be modeled. Subsequently, the artifact is added
again to the modeled waves to rebuild the modeled
signal.
For the
found that the amplitudes of subsequent I waves are
well modeled by an exponential decreasing law. As
stated before, the amplitude of I1 wave increases
almost linearly with the stimulus amplitude.
Therefore, a first-attempt model has been carried out
0.015 0.02 0.025 0.03 0.035 0.04 0.045 0.05 0.055
0
5
10
15
20
25
0.06
-15
-10
-5
amplitude (uV)
time (s)
zone 1
zone 2
zone 3
Figure 1: Typical recording taken at the epidural
electrodes
20 25 30 35 40 45 50 55
0
2
4
6
8
10
12
14
16
stimulation level %
amplitude
rest
20% activity
max activity
Figure 2: Amplitude of the first I wave evoked by TMS
for different muscle contractions levels.
ICINCO 2005 - SIGNAL PROCESSING, SYSTEMS MODELING AND CONTROL
46
0.015 0.02 0.025 0.03 0.035 0.04 0.045
-25
-20
-15
-10
-5
0
5
10
15
20
25
Model output and data at 20 % stimulation level
model
data
0 0.01 0.02 0.03 0.04 0. 05 0.06 0.07 0.08 0.09 0.1
-20
-15
-10
-5
0
5
10
15
20
25
time (s)
amplitude (uV)
artifact
data
0 0.01 0.02 0.03 0.04 0. 05 0.06 0.07 0.08 0.09 0.1
-30
-20
-10
0
10
20
30
time (s)
amplitude (uV)
artifact
data
0 0.01 0.02 0.03 0.04 0. 05 0.06 0.07 0.08 0.09 0.1
-10
-5
0
5
10
15
20
25
time(s)
amplitude (uV)
artifact
data
0 0.01 0.02 0.03 0.04 0. 05 0.06 0.07 0.08 0.09 0.1
-15
-10
-5
0
5
10
15
20
25
time (s)
amplitude (uV)
artifact
data
-10
-5
0
5
10
15
20
25
by considering a second order linear system,
described by the following transfer function:
he Laplace transform of the input stimulus, as the
he K parameter changes linearly with the
t
as biologically plausible, and useful, data.
The facts
T
monophasic current produced by the eight-shaped
coil (Kammer et al., 2001), is:
T
stimulation amplitude and simulates the stimulus
increase. In Figures 3 and 4 we show some results
achieved with the linear model described above.
This model gave good results for this experiment bu
is not suitable for experimental data collected in
other patients, nor for other similar experiments
reported in literature (Houlden,1999). In fact, the use
of a linear model implies the periodicity of I waves.
An in-depth analysis on the latency of the I waves
shows that in fact they are not periodic and each
wave has a fixed latency for all the stimulation
levels. We remind that the recordings are the results
of different mechanisms: the stimulus artifact, the
artifact due to the propagation of the nervous
potentials through the fibers and the artifact due to
the differential measurement method. Therefore, the
aspect of the recordings is not entirely due to the
action potentials generating in the fiber, and only
amplitude and latency of I waves can be considered
Therefore, we have developed another model based
on a neuronal network of spiking neurons.
on which we base our hypotheses is that the
potential recorded at the electrodes comes from the
output of a huge number of spinal fibers, and the
2
2
23
1
)(
τ
τ
τ
++
⋅=
s
s
K
si
0.015 0.02 0.025 0.03 0.035 0.04 0.045
-25
-20
-15
Model output and data at 29 % stimulation level
model
data
Figure 3: Reconstructed stimulus artifacts versus
experimental data for different stimulation levels.
bsas
ebsG
rits
+⋅+
⋅⋅=
⋅−
2
1
)(
0.015 0.02 0.025 0.03 0.035 0.04 0.045
-25
-20
-15
-10
-5
0
5
10
15
20
25
Model output and data at 41% s timulat ion level
model
data
0.015 0.02 0.025 0.03 0.035 0.04 0.045
-25
-20
-15
-10
-5
0
5
10
15
20
25
Model output and data at 50% s timulat ion level
model
data
Figure 4: model output and data for different
stimulation level
MODELING OF MOTOR NEURONAL STRUCTURES VIA TRANSCRANIAL MAGNETIC STIMULATION
47
greater the stimulation amplitude is, the higher the
number of stimulated fibers is. This hypothesis is
supported by the biological law of “nothing or all”
which states that neurons produce a fixed voltage
level when they are excited above a threshold. If the
stimulation is under the threshold the action
potential is not generated and, correspondently, a
descending wave at the electrodes is not revealed.
3 NEURONAL MODELS
is section
consists of Izhikevich spiking neurons (Izhikevich,
With th
u← u+d
al, u is a recovery
ory period and
slower
•
to the fluctuations of the
•
The
to: a=0.4 -65, d=6. This choice makes the
)(' ubvau −=
The neuronal network developed in th
2003). It is described by the equation system:
140504.0'
2
Iuvvv +−++=
e reset condition:
If v≥30 mV then v← c
where v is the membrane potenti
variable which considers the refract
the K
+
current activation after the action potential.
The mechanism of iperpolarization is considered by
the c parameter which has the -64 mV value. We can
now analyze the meaning of the parameters.
• a describes the time scale of the recovery
variable u. Smaller values result in
recovery;
b describes the sensitivity of the recovery
variable u
membrane potential v;
c describes the after-spike reset value of the
membrane potential v;
• d describes after-spike reset of the recovery
variable u.
parameters of the neuron model have been fixed
, b=0.26, c=
neuron spiking and with a latency comparable to that
of the experimental recordings.
The experimental recordings cannot reveal the
action potentials of the single neuron activated by
the stimulation, so we have studied the global
behavior of the network, by simulating an
appropriate inducted current at different neuronal
areas, produced by the eight-shaped coil.
The amplitude of each I wave is proportional to the
number of corticospinal neurons transinaptically
activated by the stimulation. The generation of a D
wave is due to the direct stimulation of the
corticospinal neurons for high stimulation levels, as
the inducted current activates the deep brainstem and
activates cortical neurons directly. Nevertheless, for
the generation of the simulated I waves, the number
of neurons actually involved is unknown. We
assumed that each stimulated neuron contributes to
the formation of the I wave with a 1µV spike and
consequently we estimated the number of neurons
involved in the stimulation process.
Based on these considerations, we have simulated a
500 cortical neurons network connected to a 100
corticospinal neurons network. Both networks are
considered within a regular topology. Each
corticospinal neuron is synaptically connected to
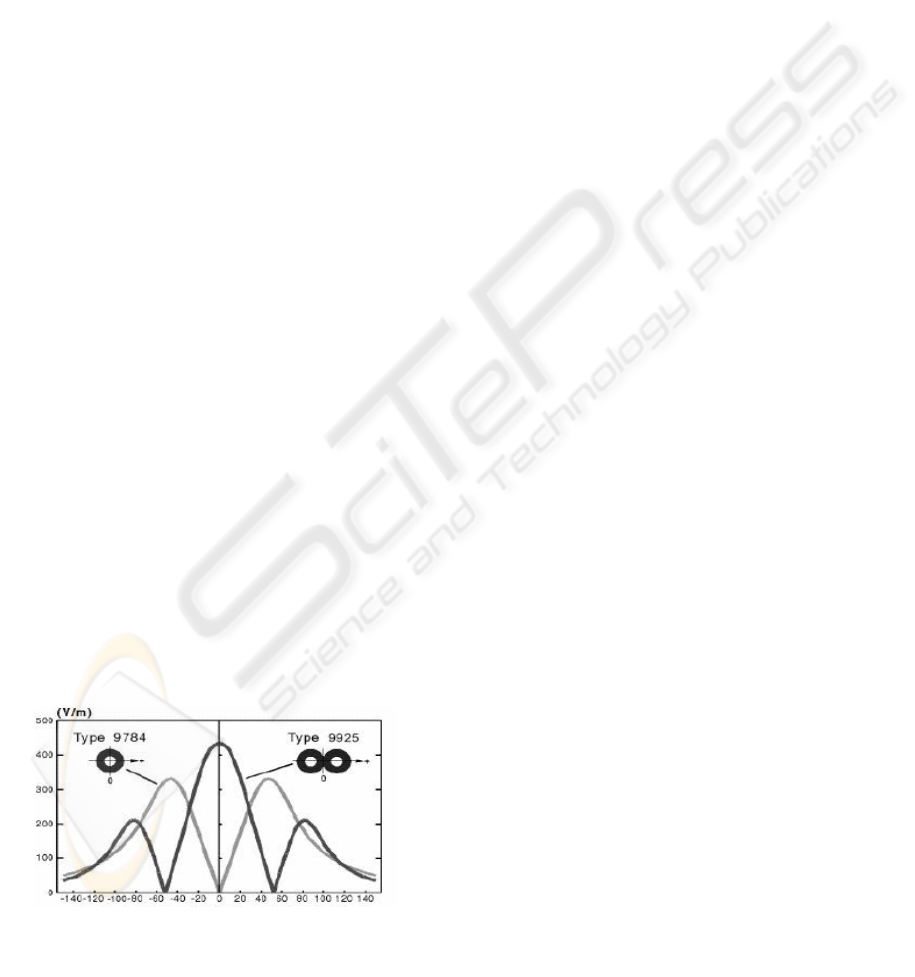
five cortical neurons. As it is illustrated in Figure 5,
an eight-shaped coil induces an electric field with
the highest peaks located in three main areas: one
located immediately below the coil with the
maximum intensity, the other two on the two sides
of the coil, with a peak of intensity which is about a
half of the highest one. The hypothesis made in this
paper is that the electric field mainly stimulates
groups of neurons located under the highest field
peaks (Rosler, 2001 – Sakay). Therefore, an I wave
consists of the sum of the outputs of many neurons
which fires at the same time, because they are
essentially stimulated by the same field. This
hypotesis is supported by the following facts, which
can be observed in the experimental data:
Figure 5: Electric field shape for circular and eight-
shaped stimulation coils
• In these experiments a maximum of three
waves is generated, and there are three
main areas in which a peak of electric field
exists.
• For high intensities, the field peaks are
higher and more spread in space.
Consequently, more neurons are activated
and the correspondent I wave is larger.
• For low intensities, the electric field has
only one peak located under the coil.
Correspondently, only one I wave is
generated for low intensity field.
ICINCO 2005 - SIGNAL PROCESSING, SYSTEMS MODELING AND CONTROL
48
Therefore, the cortical network (and consequently
the corticospinal one) has been partitioned in three
areas, each responsible for the generation of one of
the three I waves. When the stimulation intensity
increases, the number of activated neurons increases
and larger waves are produced. This simulates the
spatial spreading of the stimulus at higher intensity
of stimulation. Therefore, different I waves are
generated because a different current for each
neuronal area is inducted by the magnetic field.
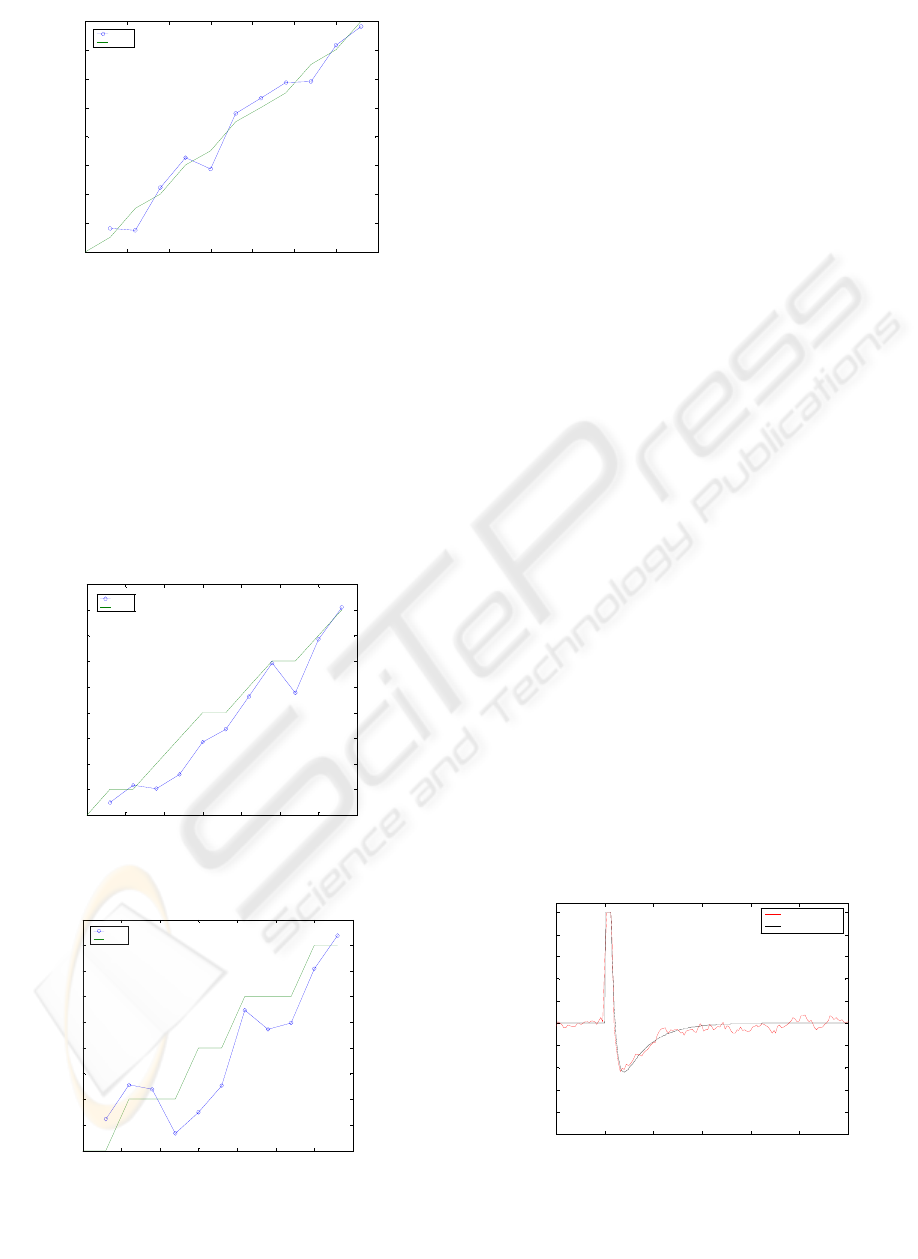
Figures. 6, 7 and 8 show a comparison between the
amplitude of simulated I1, I2 and I3 waves and the
experimental ones, versus the stimulus intensity.
Once amplitudes and latencies have been modeled,
the signal shape must be reconstructed. We already
dealt with the fact that the differential measurement
configuration introduces an artifact in the
measurements, producing a sequence of one positive
and one negative volley for each cerebral I wave.
20 25 30 35 40 45 50 55
0
2
4
6
8
10
12
14
16
stimulation level (%)
amplit ude (uV)
data
model
The propagation velocity of the impulse has been
calculated in about 50 m/s. The propagation delay
for the I1 wave is about 2.2 ms. For I waves, due to
their synaptic nature, an approximately 1 ms delay
due to the synaptic mechanism must be added.
Therefore, a total latency for the I1 wave equal to
3.6 ms has been reckoned, which is coherent with
the distance of 12 cm between stimulation and
recording site.
Figure 6: amplitude of the I1 waves for different
stimulation levels.
Therefore, taking into account the propagation
velocity of the waves and the distance between the
electrodes, the artifact can be reconstructed.
4 RESULTS
A good fitting of the experimental data for all the
stimulation levels has been obtained with the
neuronal structure explained above.
To fit the experimental data we have reproduced the
stimulus artifact, the measure setup and the
propagation artifacts.
Figures 9, 10 and 11 illustrate a comparison between
the output of the model and the experimental data. It
can be clearly noticed that the neuronal network
gives better results than the linear model. It respects
Figure 7: Amplitude of the I2 waves for different
stimulation levels.
20 25 30 35 40 45 50 55
0
1
2
3
4
5
6
7
8
9
stimulation level (%)
amplitude (uV )
data
model
Figure 8: Amplitude of the I3 waves for different
stimulation levels.
20 25 30 35 40 45 50 55
0
0.5
1
1.5
2
2.5
3
3.5
4
4.5
stimulation level %
amplitude (uV)
data
model
0.015 0.02 0.025 0.03 0.035 0.04 0.045
-25
-20
-15
-10
-5
0
5
10
15
20
25
data
model output
Figure 9: Model output and data for a 20% stimulation
level.
MODELING OF MOTOR NEURONAL STRUCTURES VIA TRANSCRANIAL MAGNETIC STIMULATION
49
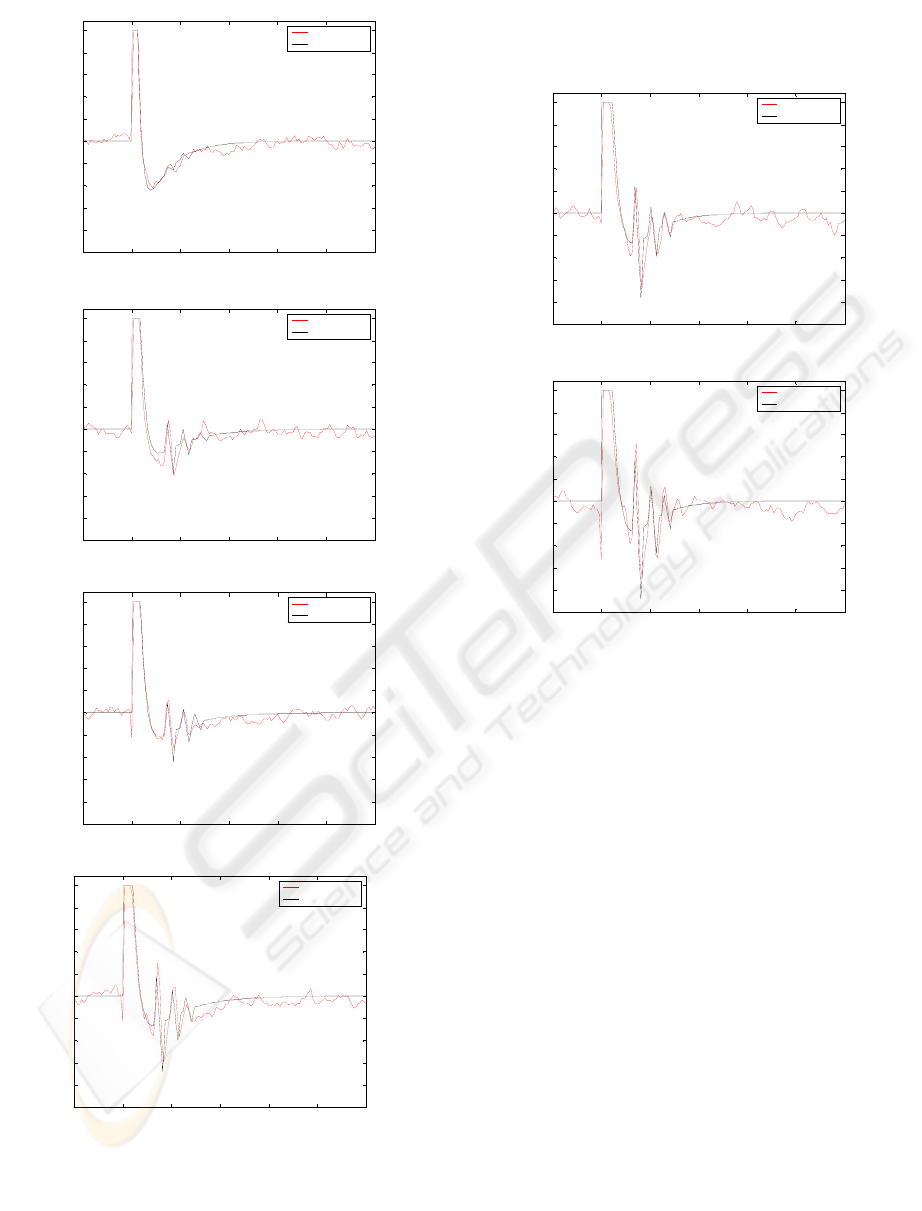
the aperiodicity of the response, taking into account
the different latencies of I waves, and provides a
better fitting for wave amplitudes.
0.015 0.02 0.025 0.03 0.035 0.04 0.045
-25
-20
-15
-10
-5
0
5
10
15
20
25
data
model output
0.015 0.02 0.025 0.03 0.035 0.04 0.045
-25
-20
-15
-10
-5
0
5
10
15
20
25
data
model output
0.015 0.02 0.025 0.03 0.035 0.04 0.045
-25
-20
-15
-10
-5
0
5
10
15
20
25
data
model output
0.015 0.02 0.025 0.03 0.035 0.04 0.045
-25
-20
-15
-10
-5
0
5
10
15
20
25
data
model output
0.015 0.02 0.025 0.03 0.035 0.04 0.045
-25
-20
-15
-10
-5
0
5
10
15
20
25
data
model output
Figure 11: Model output and data for 47%, 53%
stimulation level.
5 CONCLUSIONS
In this paper a model of motor neuronal structures
has been built and validated on the basis of
experimental recordings obtained via Transcranial
Magnetic Stimulation (TMS). With this technique,
the brain of the patient is stimulated by a suitable
magnetic field placed above the cerebral motor area
responsible of the left hand movements. The
stimulation evokes different biological waves in the
brain which are transmitted from the motor cortex,
through the pyramidal neurons via synaptic
connection, to the spinal chord, where signals are
collected by a couple of electrodes implanted in the
epidural space at C1-C2 vertebras level.
0.015 0.02 0.025 0.03 0.035 0.04 0.045
-25
-20
-15
-10
-5
0
5
10
15
20
25
data
model output
After a thorough data analysis phase, the motor
neuronal structure has been modeled by a neural
network based on Izhikevich neurons, for both the
motor cortex and the pyramidal neuron areas.
Moreover, stimulus and measurement artifacts have
been reconstructed and considered in the modeling
phase. The results are fully satisfactory, model
Figure 10: Model output and data for 23%, 32%, 35%,
44% stimulation level.
ICINCO 2005 - SIGNAL PROCESSING, SYSTEMS MODELING AND CONTROL
50

output and experimental recordings match for each
available experiment.
Further research will involve a more accurate
modeling of the motor cortex and its connections
with the pyramidal tracts. At present, an hypothesis
of a five-to-one local connection between cortex and
pyramidal neurons has been made. In the future,
optimization strategies will be considered to find an
adequate connection scheme between cortex and
pyramidal tracts, and with different topologies,
involving also the plasticity mechanism (i.e. time-
variant connections). Moreover, the model is being
validated on several recordings coming from
different patients, with different stimulation
protocols.
ACKNOWLEDGEMENTS
This work is supported by the national research
project MIUR "Innovative Bio-Inspired Strategies
for the Control of Motion Systems", No.:
2003090328, 2003. The authors acknowledge Prof.
Di Lazzaro (Institute of Neurology, Università
Cattolica, Rome, Italy), Prof. Mazzone
(Neurochirurgia CTO, Rome, Italy), Dr. Ghirlanda
(Department of Psychology, University of Bologna,
Italy) and their research groups for having provided
the experimental data and the prior knowledge for an
in-depth data analysis.
REFERENCES
Merton P.A., Morton H.B. (1980). Stimulation of the
cerebral cortex in the intact human subject. Nature
285:227.
Barker A.T., Jalinous R., Freeston I.L. (1985). Non-
invasive magnetic stimulation of human motor cortex,
Lancet , i pp.1106-1107.
Jalinous R. 1997. Guide to Magnetic Stimulation,
Magstim Company
Di LazzaroV., Restuccia D., Oliviero A., Proficue P.,
Ferrara L., Insola A., Mazzone P., Tonali P., Rothwell
J.C. (1998). Effects of volontary contraction on
descending volleys evoked by transcranial stimulation
in conscious humans Journal of Physiology, 508.2,
pp.625-633.
Di LazzaroV., Oliviero A., Pilato F., Saturno E., Di leone
M., Mazzone P., Insola A., Tonali P. A., Rothwell J.
C. (2004). The physiological basis of transcranial
motor cortex stimulation in conscious humans Clinical
Neuropysiology, 115 pp.255-266.
Kammer T., Beck S., Thielscher A., Ulrike Laubis-
Herrmann, Helge Topka. (2001). Motor thresholds in
humans: a transcranial magnetic stimulation study
comparing different pulse waveforms, current
directions and stimulator types Clinical
Neurophysiology 112 250±258.
Houlden D.A et al. (1999, March 1). Spinal Cord-Evoked
Potentials and Muscle Responses Evoked by
Transcranial Magnetic Stimulation in 10 Awake
Human Subjects The Journal of Neuroscience 19(5)
1855-1862
Izhikevich E. M. (2003). Simple Model of Spiking
Neurons IEEE TRANSACTIONS ON NEURAL
NETWORKS, VOL. 14, NO. 6.
Rosler K. M. (2001). Transcranial Magnetic Brain
Stimulation: a Tool to Investigate Central Motor
Pathways. News Phisiol. Sci. Vol. 16 297-302
Katsuyuki Sakay, Yoshikazu Ugawa, Ichiro Kanazawa.
Preferential activation of different I waves by focal
magnetic stimulation with different current direction
TMS PS-10-8.
Derek T. O’Keeffe , Gerard M. Lyons , Alan E. Donnelly ,
Ciaran A. Byrne. (2001). Stimulus artifact removal
using a software-based two-stage peak detection
algorithm Journal of Neuroscience Methods 109
pp.137–145.
McLean L., MScEE, PT, Scott R.N. (1996, December).
Stimulus Artifact Reduction in Evoked Potential
Measurements Arch Phys Med Rehabil Vol 77.
Wassermann E.M. (1998). Risk and safety of repetitive
transcranial magnetic stimulation: report and
suggested guidelines from the international workshop
on the safety of repetitive transcranial magnetic
stimulation, Electroencephalography and Clinical
Neurophysiology, 108: 1-16
MODELING OF MOTOR NEURONAL STRUCTURES VIA TRANSCRANIAL MAGNETIC STIMULATION
51
