
Research on Sales Forecast of New Energy Vehicle:
Based on the Perspective of Government Subsidy
Ruidan He
School of Economic and Management, Shanghai Institute of Technology, Shanghai, China
h2569239765@163com
Keywords: New Energy Vehicle, Government Subsidy, System Dynamics, Sales Forecast.
Abstract: By studying the development status of the new energy vehicle (NEV) industry, establishing a system
dynamics scenario of NEV sales, using Vensim software for scenarioing and simulation, analyzing the impact
of technology innovation, infrastructure and other related variables on the NEV market sales, and simulating
the future development trend of NEVs. This paper concludes that the future sales of NEVs will keep growing,
which is mainly due to the increase of government subsidies and improvement of infrastructure. Finally, based
on the simulation results and combined with the actual situation, reasonable suggestions are made for the
future development of the NEV industry. The suggestions include: improving infrastructure construction;
enhancing the role of policy leadership and strengthening government regulation.
1 INTRODUCTION
In order to improve low-carbon transformation
capacity and create green prosperity, we should
gradually reduce our dependence on coal under the
premise of improving the clean and efficient
utilization of coal power, continuously optimize the
energy structure, increase the proportion of
renewable energy power in the terminal energy
consumption, vigorously develop new energy
technologies, increase the investment in new energy
research, and strongly support the development of
new energy vehicle (NEV) industry. The "NEV
Industry Development Plan (2021-2035)" issued by
the State Council requires the implementation of
preferential tax policies related to NEVs, financial
support for the construction of charging piles as
public facilities, and preferential policies for parking
and charging of NEVs. The country is strongly
supporting the development of the NEV industry, and
the tax incentives and basic measures related to
NEVs are being gradually improved. However,
according to the CCA, as of the end of December
2021, the number of NEVs in China was 7.84 million,
and the number of public charging piles was 1.147
million, with a vehicle-pile ratio of 6.83:1, with an
average of 7 vehicles having one charging pile, which
is still a certain distance from the goal of one vehicle
with one pile. The lack of public charging facilities
makes consumers hesitant about NEVs.
According to the development experience of
NEVs, government investment and support are
necessary to promote the development of NEVs. In
terms of policy evaluation, Ari Kokko studied the
role of national policies in the development of NEV
industry and pointed out that national technical
support and industrial policy support are important
pillars to promote the development of NEV industry
(Liu & Kokko 2012,
Hood & Margetts 1983).
Sierzchula pointed out that charging infrastructure is
more closely related to the adoption of electric
vehicles, and a good infrastructure can lead to a high
adoption rate of electric vehicles (Sierzchula et al.
2014). The results of McKinsey & Company show
that financial subsidy policies play an important role
in promoting and using NEVs. To some extent, the
level of government support affects the future
development trend of NEVs. Based on this, this paper
establishes a system dynamics model of NEV sales,
uses Vensim software for modeling and simulation,
analyzes the impact of technology innovation,
infrastructure and other related variables on NEV
market sales, simulates the future development trend
of NEVs, and provides suggestions for the future
development of the NEV industry.
748
He, R.
Research on Sales Forecast of New Energy Vehicle: Based on the Perspective of Government Subsidy.
DOI: 10.5220/0012043400003620
In Proceedings of the 4th International Conference on Economic Management and Model Engineering (ICEMME 2022), pages 748-752
ISBN: 978-989-758-636-1
Copyright
c
2023 by SCITEPRESS – Science and Technology Publications, Lda. Under CC license (CC BY-NC-ND 4.0)
2 METHOD AND
METHODOLOGY
The development of NEVs is influenced by a
combination of national policies, technological
innovation, infrastructure, economic situation and
other factors, while these factors interact with each
other and influence each other. System Dynamics is
a methodological approach and a combination of
qualitative and quantitative analysis of socio-
economic problems, which was first proposed by
Professor Forrester(Wang 1986). Therefore, this
paper adopts the system dynamics approach and uses
Vensim software to study the impact of national
policies, technological innovation and infrastructure
on the sales of NEVs.
The attractiveness of NEV products is influenced
by the level of technology, that is, technological
innovation is the main influencing factor for the
improvement of NEVs (Liu & Song 2013), which in
turn affects innovation capacity and ultimately acts
on the level of technology. It is worth mentioning that
government R&D investment can stimulate
enterprises' R&D enthusiasm on the one hand, but on
the other hand, it can also lead to enterprises'
dependence on government subsidies and innovation
inertia, which reduces the innovation capacity and
affects the improvement of technology level (
Cai
2022
). Consumer purchasing is influenced by many
factors, which are summarized in this paper by
product attractiveness (Zhou & Liu 2021). Product
attractiveness is mainly determined by a combination
of the level of infrastructure development (vehicle-
to-pile ratio) and the level of technology.
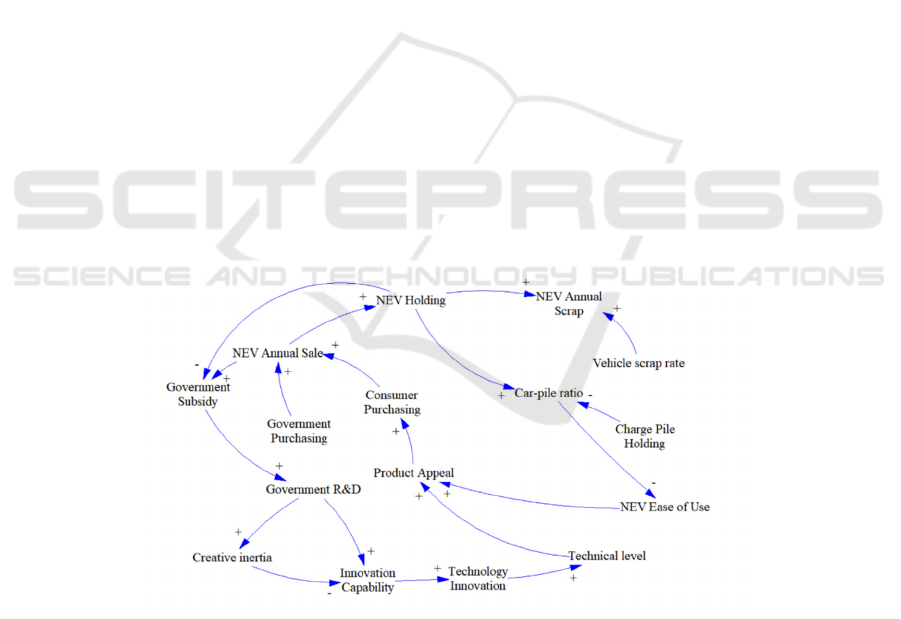
2.1 Feedback Loops and Cause-Effect
Loop Diagrams of Model
This paper studies the construction of a systematic
feedback between technological innovation,
infrastructure and the NEV industry, which mainly
includes the following feedback loops.
1. consumer purchasing → NEV Annual Sale →
NEV Holding → vehicle-pile ratio →NEV Ease of
Use → Product Appeal
2. Government subsidy → government R&D →
innovation capacity → technology innovation →
technical level → product appeal → consumer
purchasing → NEV Annual Sale→ NEV holding
3. government subsidy → government R&D →
Creative inertia → innovation capability →
technology innovation → technical level → product
appeal → consumer purchasing → NEV Annual Sale
→ NEV Holding
Based on this, the study constructs a causal loop
diagram between technological innovation,
infrastructure and the NEV industry, as shown in
Figure 1.
Figure1: Cause-and-effect loop of technological innovation, infrastructure and the NEV industry.
2.2 Determining System Boundaries of
Model
Based on the clarification of the problem, the system
scenario needs to establish the system behavior
boundary and the time boundary. In determining the
system behavior boundary, this paper is to study the
influence of government subsidies and infrastructure
construction on the sales of NEVs. Considering the
development of the NEV industry and the reasonable
time for the predictable development of new
Research on Sales Forecast of New Energy Vehicle: Based on the Perspective of Government Subsidy
749
technologies, the scenario simulation time is set from
2015 to 2025.
2.3 Scenario Assumptions
Due to the complexity of the evolution of the NEV
industry, not all factors can be taken into account, so
assumptions need to be established to discard
irrelevant factors and highlight the problem under
study. For the sales forecasting scenario of NEVs,
this paper will be based on the following three
assumptions.
1. consumer demand is sufficient and market
supply capacity is strong. That is, the manufacturers
of NEVs can roughly meet the purchase demand of
consumers and achieve a balance between supply and
demand in the market.
2. In the forecast time frame, China's
macroeconomic conditions are good, with no major
changes or economic policy turns at present. From a
long-term perspective, some uncertain influences
(e.g., the new crown outbreak in early 2020) will not
be taken into account.
3. Since this paper is based on a government
subsidy perspective study, only public charging stake
holdings are considered when considering charging
stake holdings. Given the availability of data and the
limited space, this paper studies the key influencing
factors and certain secondary factors (e.g.,
government investment in regulatory mechanisms)
will not be considered.
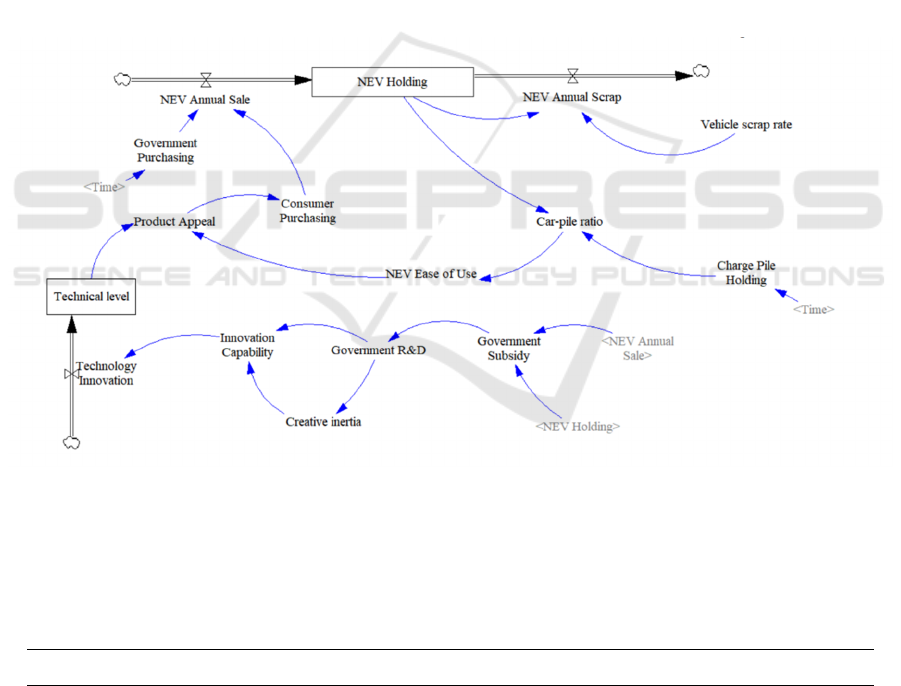
2.4 System Dynamics Flow Diagram of
Model
Based on the above causal loop diagram and the
system boundary of the scenario, the system
dynamics flow diagram of technological innovation,
infrastructure and NEV industry was constructed by
Vensim software, as shown in Figure 2.
Figure2: System dynamics flow diagram of the NEV, technology innovation and infrastructure.
The data in this simulation study were compiled
from the CAAM, CBIRI, and data from the China
Public Charging Pile Industry Research Report by
Ariadne Consulting. The formulae of the main
variables in the scenario are shown in Table 1.
Table 1: Main variable equations of the scenario.
No. Equation of variables
Unit
1 Product appeal = technical level * 0.91 + NEV Ease of Use * 0.43 dmnl
2 Creative inertia= LN ("government R&D") dmnl
3 Technical level= INTEG (technology innovation,1.02) dmnl
ICEMME 2022 - The International Conference on Economic Management and Model Engineering
750
4
Government subsidy=IF THEN ELSE (NEV holding<=500, NEV Annual
Sale *0.5, IF THEN ELSE (NEV holding>500:AND: NEV holding
<=1000, NEV Annual Sale *0.3, NEV Annual Sale *0.1)
million
5 NEV Holding = INTEG (NEV Annual Sale - NEV Annual Scrap,15) million units
6 NEV Annual Scrap = NEV holding * vehicle scrap rate million units
7 NEV Annual Sale = government purchasing + consumer purchasing
million units
8 Vehicle-pile ratio = NEV holding /charge pile holding
dmnl
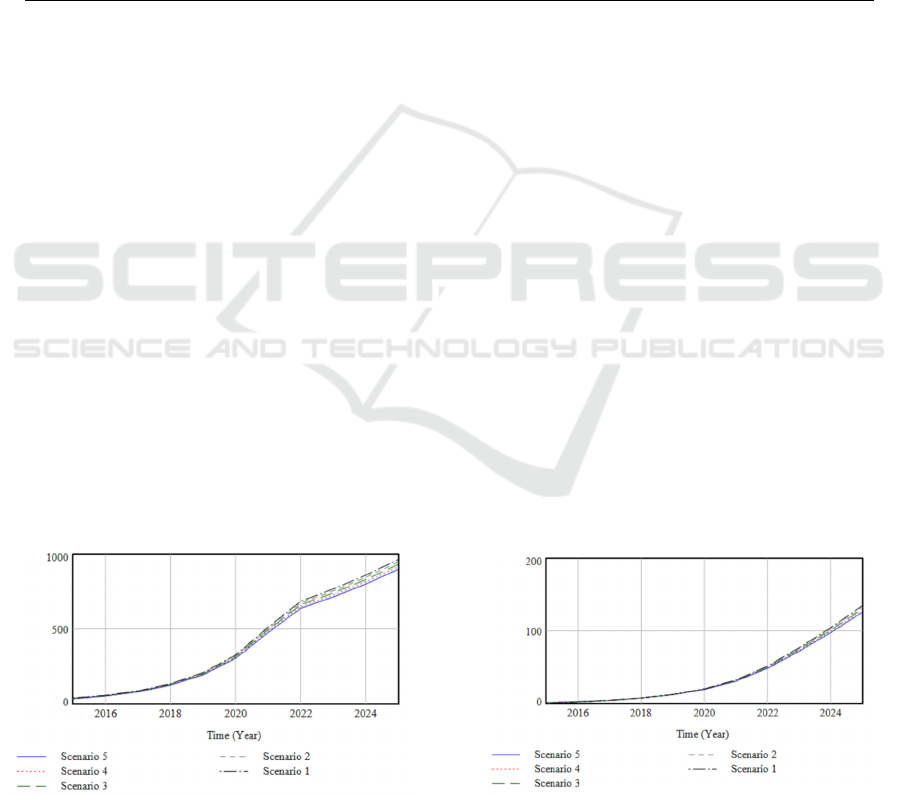
3 SIMULATION ANALYSIS OF
THE SCENARIO
3.1 Stability Check of the Scenario
The system dynamics model of technology
innovation, infrastructure and NEV industry
constructed in this study is suitable for stability
testing and simulation analysis because the portrayal
and fitting of technology innovation, infrastructure
and NEV industry are basically in line with the actual
situation. In this paper, the simulation time is 10
years, and the initial values of NEV ownership for
models 1, 2, 3, 4 and 5 are assumed to be 50,000,
10,0000, 15,0000, 20,0000 and 250,000,
respectively. As can be seen from Figures 3 and 4,
increasing or decreasing the initial values of the
variables within 10 years, although the annual sales
and annual scrapping of NEVs do not increase at the
same rate, they still generally maintain an upward
trend, so this study is consistent with the
requirements of the stability test.
3.2 Simulation Analysis of the Scenario
The simulation study in this paper uses Vensim
software, and the model is simulated in annual steps
with a simulation period of 10 years. This paper sets
up three different combinations of government
subsidies to study the impact of government subsidies
on the sales of NEVs. The initial value of government
subsidies in scenario 1 is 3000 RMB when the
ownership of NEVs is less than 5 million, 1500 RMB
when the ownership of NEVs is more than 5 million
and less than 10 million, and 500 RMB when the
ownership of NEVs is more than 10 million,
Scenarios 2 and 3 increase the amount of government
subsidies in turn. From Figure 5, we can see that the
higher the government subsidy, the higher the annual
sales of NEVs, therefore, the government should
increase the amount of government subsidy.
Figure 3: Annual sales trend of NEVs. Figure 4: Trend of annual scrapping volume of NEVs.
Research on Sales Forecast of New Energy Vehicle: Based on the Perspective of Government Subsidy
751

Figure 5: Trends in annual sales of NEVs when changing
government subsidies.
Figure 6: Trends in annual sales of NEVs when improving
infrastructure.
In this paper, three different charging pile
retention table functions are set to study the impact of
infrastructure construction on NEV sales. On the
basis of the original scenario, scenario 2 increases the
retention of charging piles, and scenario 3 is to
increase the retention of charging piles on the basis
of scenario 2. From Figure 6, we can see that with the
increase of the retention of charging piles, the
vehicle-pile ratio is decreasing and the annual sales
of NEVs are increasing.
4 CONCLUSIONS
First, although the development of an industry cannot
rely on government support, the current lack of
technology and infrastructure of NEVs, if the
government increases the subsidies for NEVs, it will
increase consumer demand for NEVs, thus
promoting the increase of NEV sales. It is suggested
that the price authorities of the local governments
promoting NEVs can formulate reasonable charging
policies according to the actual situation, so that the
cost of using NEVs is lower than that of traditional
vehicles, thus increasing consumers' willingness to
buy NEVs.
Secondly, from the simulation analysis, it can be
seen that the sales of NEVs increase as the number of
charging piles increases, i.e., the infrastructure
continues to improve. Therefore, in terms of service
platform, it is suggested that the government should
make use of the existing technology to actively
develop the "Internet+Charging Infrastructure"
platform to help the owners of NEVs to achieve
charging navigation and fee settlement, so that
consumers can feel the convenience of using NEVs
and further increase the sales of NEVs.
ACKNOWLEDGMENTS
The researchers would like to express their gratitude
to the anonymous reviewers for their efforts to
improve the quality of this paper.
REFERENCES
Cai, J., Jia, L., Wu, C., Shou, Y. (2022). R&D capital
investment in new energy vehicle enterprises: the
different moderating roles of financial redundancy and
government subsidies. Journal of Management
Engineering, 36:11-24.
Hood, C.C., Margetts, H. Z.,1983. Exploring Government's
Toolshed. Macmillan Education UK, London.
Liu, L., Song, F. (2013). The NEV technology innovation
policy at home and abroad. Science Management
Research, 31: 66-70.
Liu, Y Q, Kokko A. (2012). NEV technology in China.
Chinese Management Studies, 6: 78-91.
Sierzchula, W., Bakker, S., Maat, K., Wee, B. (2014). The
influence of financial incentives and other socio-
economic factors on electric vehicle adoption. Energy
Policy,68: 183-194.
Wang, Y.,1986. Systems engineering. Machinery Industry
Press, Beijing.
Zhou, Z., Liu, M. (2021). The impact of double credit type
industrial policy on new energy vehicle industry: A
modeling based on firms' policy adaptation behavior.
Science and Technology Management Research,41:47-
57.
ICEMME 2022 - The International Conference on Economic Management and Model Engineering
752
