
Modelling the Design of University Competitiveness
Dmytro H. Lukianenko
a
, Andriy V. Matviychuk
b
, Liubov I. Lukianenko
c
and Iryna V. Dvornyk
d
Kyiv National Economic University named after Vadym Hetman, 54/1 Peremogy Ave., Kyiv, 03680, Ukraine
Keywords:
Globalization, Competitiveness, Universities, Intellectual Capital, Innovations, Digital Transformation.
Abstract:
In the post-industrial knowledge economy, the key role in the generation and dissemination of innovations is
played by universities, where global intellectual capital is concentrated. Today, universities are becoming the
drivers of digital transformation of science, business, countries and society as a whole. In the latest paradigm
of development, based on the generalization of modern theoretical trends, the scientific and practical problems
as well as prospects for the development of universities are highlighted and the prerequisites, imperatives and
factors of their competitiveness are revealed. The research also focuses on modelling of university competi-
tiveness parameters with the clustering of countries on the basis of Kohonen maps and assessment of the level
of significance of normalized parameters. The organizational design of a competitive model of the university
as well as key factors of its success in the system of open science, education and innovation are proposed.
1 INTRODUCTION
In the global highly competitive educational environ-
ment, under the influence of ultra-dynamic digital-
ization, traditional models and organizational struc-
tures of universities are being devalued. Innovative
network-type models are becoming relevant, and the
choice of breakthrough, catch-up or adaptation strate-
gies depends primarily on the competitive status of
the university in the global market of educational ser-
vices.
The global transformation of university education
raises new challenges for state authorities in the field
of education and university administrations to ensure
their competitiveness in the international market of
educational services. In the context of increasing the
efficiency of the university management process in
modern globalization conditions, the tasks of assess-
ing its international competitiveness arise.
This problem has received close attention in scien-
tific research in recent years. Many publications are
focused on the analysis of generally accepted methods
for assessing the competitiveness of universities and
their ranking, comparing these methods, key indica-
a
https://orcid.org/0000-0002-3475-2126
b
https://orcid.org/0000-0002-8911-5677
c
https://orcid.org/0000-0001-6997-1575
d
https://orcid.org/0000-0002-2558-9654
tors, modelling principles and identifying their weak-
nesses.
Avralev and Efimova (Avralev and Efimova, 2015)
have conducted a survey of students over the years,
which showed that place in the university rankings is
an increasingly important criterion for students when
choosing a university. At the same time, most re-
searchers criticize the widely used rating systems.
Thus, Sayed (Sayed, 2019) demonstrates that accord-
ing to some of the world’s leading ranking systems,
a university may be at the top of the ranking, while
in others it may not be ranked at all. Many re-
searchers note (Anowar et al., 2015; Marginson and
van der Wende, 2016) that most of the global univer-
sity rankings focus primarily on research, while at the
same time not paying enough attention to the qual-
ity of teaching, student competences and learning out-
comes, social responsibility, etc.
At the same time, most scientists agree that the
main criteria that determine the competitiveness of
universities are research and teaching (Dimitrova and
Dimitrova, 2017; Sayed, 2019; Taylor and Braddock,
2008; Tee, 2016). In addition, some authors empha-
size the importance of other criteria, such as interna-
tional cooperation with university research networks,
involving foreign teachers and students, increasing
international citation (Avralev and Efimova, 2013;
Chl
´
adkov
´
a et al., 2021; Deem et al., 2008), qual-
ity of pedagogical staff (Chl
´
adkov
´
a et al., 2021), so-
204
Lukianenko, D., Matviychuk, A., Lukianenko, L. and Dvornyk, I.
Modelling the Design of University Competitiveness.
DOI: 10.5220/0011933200003432
In Proceedings of 10th International Conference on Monitoring, Modeling Management of Emergent Economy (M3E2 2022), pages 204-214
ISBN: 978-989-758-640-8; ISSN: 2975-9234
Copyright
c
2023 by SCITEPRESS – Science and Technology Publications, Lda. Under CC license (CC BY-NC-ND 4.0)

cial and environmental responsibility (Lukman et al.,
2010), digitization of all university functioning pro-
cesses (Kucherova et al., 2021; Lukianenko et al.,
2020; Sannikova et al., 2021), expenditure on higher
education per student (Satsyk, 2014), employability
of graduates (Jur
´
a
ˇ
skov
´
a et al., 2015b,a). The im-
portance of cooperation with business to improve the
competencies and employability of students and, as
a result, the competitiveness of the university, is em-
phasized in the papers (Jur
´
a
ˇ
skov
´
a et al., 2015b; Lukia-
nenko et al., 2020; Stoimenova, 2019; Teixeira et al.,
2020).
As can be seen from the above review, all these
works are aimed either at the analysis and criticism of
known rating systems, or at the study of factors that
affect the competitiveness of universities, or, at most,
at the creation of own methods for calculating univer-
sity ratings, which are based on the simplest statistical
methods.
There are works in which advanced artificial intel-
ligence technologies are used to analyze and rank uni-
versities according to certain areas of activity. For ex-
ample, in (Kucherova et al., 2021) developed a fuzzy
logic model for assessment and ranking of universi-
ties’ websites by criterion of usability.
However, the analysis of developments in this di-
rection did not allow to identify studies on the mod-
eling of university competitiveness based on cutting-
edge artificial intelligence technologies, moreover,
which would not be based in the rating on the expertly
set weights of the evaluation criteria.
2 MODELING METHOD
Solving the task of evaluating the international com-
petitiveness of universities is associated with a num-
ber of specific problems, because competitiveness
does not have generally accepted evaluation indica-
tor, units or measurement scales. This is a subjec-
tive category that depends on many factors affecting
it. Moreover, the set of these factors and the degree
of influence of each of them are also not determined
by any objective circumstances and can be chosen by
analysts and researchers depending on their own un-
derstanding of the essence of the category “competi-
tiveness of universities”, the development of the ed-
ucational process, their own priorities, etc. All this
imposes a significant imprint of subjectivism on the
formation of methods of their evaluation.
It is possible to reduce the dependence on the sub-
jective opinions of individual experts with the use of
special modeling methods capable of revealing regu-
larities in the structure of an array of heterogeneous
data, when there are no predetermined values of the
resulting indicator, such as for the international com-
petitiveness of universities.
Under such conditions, the clustering approach is
the most appropriate means of searching for hidden
regularities in sets of explanatory variables. The main
feature of this approach is that with its application,
objects that belong to one cluster are more similar to
each other than to objects that are included in other
clusters. As a result, it becomes possible to form
fairly homogeneous groups of researched objects that
are characterized by similar properties.
There is a wide range of cluster analysis methods:
K-means (Hartigan and Wong, 1979), K-medoids
(Kaufman and Rousseeuw, 1990), Principal Com-
ponent Analysis (Jolliffe, 2002), Spectral Clustering
(Von Luxburg, 2007), Dendrogram Method (Sokal
and Rohlf, 1962), Dendrite Method (Cali
´
nski and
Harabasz, 1974), Self-Organizing Maps – SOM (Ko-
honen, 1982, 2001), Density-Based Spatial Cluster-
ing of Applications with Noise – DBSCAN (Schubert
et al., 2017), Hierarchical DBSCAN – HDBSCAN
(Campello et al., 2013), Ordering Points to Identify
the Clustering Structure – OPTICS (Ankerst et al.,
1999), Uniform Manifold Approximation and Projec-
tion – UMAP (McInnes and Healy, 2018), Balanced
Iterative Reducing and Clustering Using Hierarchies
– BIRCH (Zhang et al., 1996), etc.
Each of these methods has its advantages and ar-
eas of application and tasks, where it reveals itself
in the best way. Experimental studies on compara-
tive analysis of the effectiveness of various cluster-
ing methods are described, in particular, in scientific
works (Kobets and Novak, 2021; Kobets and Yat-
senko, 2019; Subasi, 2020; Velykoivanenko and Ko-
rchynskyi, 2022).
Taking into account the capabilities of each of the
mentioned methods and the specifics of this study,
the Kohonen self-organizing maps toolkit was used
to cluster countries by the level of competitiveness of
universities, which, in addition to forming homoge-
neous groups of researched objects, provide a con-
venient tool for visual analysis of clustering results.
In particular, in contrast to other clustering methods,
the location of an object on the Kohonen map im-
mediately indicates to the analyst how developed the
investigated property is compared to others, because
the best and worst objects according to the analyzed
indicator are located in opposite corners of the self-
organizing map.
The result of constructing the Kohonen map is
a visual representation of a two-dimensional lattice
of neurons that reflect the organizational structure of
the countries of the world, forming clusters in which
Modelling the Design of University Competitiveness
205

countries are similar to each other according to the
group of indicators of evaluating the competitiveness
of universities (figure 1).
The Kohonen self-organizing algorithm is a clus-
tering method that reduces the dimension of multidi-
mensional data vectors. It can be used to visualize
clusters and to detect nonlinear patterns in input data
structures. The main feature of such neural networks
is unsupervised learning, when information about the
desired network response is not needed to correctly
set the parameters. In this study, self-organizing maps
are used to summarize a complex set of data and clus-
tering of countries by indicators that have the greatest
impact on the international competitiveness of univer-
sities.
Thus, each neuron of the Kohonen layer receives
information about the research object in the form of a
vector x, which consists of n explanatory variables (in
our case, these are the characteristics that determine
the competitiveness of universities). When a new data
vector arrives at the input layer of the network, all
neurons of the self-organization map participate in the
competition to be the winner. As a result of such a
competition, the winner is the neuron
o = argmin
x − w
j
(1)
that is more similar to the input data vector than oth-
ers, usually by Euclidean distance:
x − w
j
=
s
n
∑
i=1
x
i
− w
j
i
2
, j = 1, K (2)
where x is a vector of input data consisting of indi-
cators {x
1
, . . . , x
i
, . . . , x
n
} that describe the objects un-
der study; x
j
is the vector of parameters of j
th
neu-
ron of the Kohonen map, which consists of elements
{w
j
1
, . . . , w
j
i
, . . . , w
j
n
}; K is the number of neurons of
the Kohonen map.
After determining the neuron-winner, we adjust
the vector of its parameters and its neighbors accord-
ing to the input vector:
w
j
(t + 1) = w
j
(t)+
α(t) · h
o j
(t) ·
x(t) − w
j
(t)
, j = 1, K (3)
where α(t) is the rate of learning (0 < α(t) ≤ 1),
which decreases with each learning epoch t; h
o j
(t) is
the strength of mutual influence for any pair of neu-
rons o and j, determined as a function (usually Gaus-
sian) of the distance between them on the map topol-
ogy:
h
o j
(t) = exp
−
∥r
o
− r
j
∥
2
2 · σ
2
(t)
(4)
where r
o
, r
j
are the two-dimensional vectors of coor-
dinates of geometric location of the neuron-winner o
and the j
th
neuron on the map; σ(t) is the effective
width of the topological neighborhood (a specially
chosen function of time that monotonically decreases
in the learning process).
In the process of self-organization of the Kohonen
map, the topological neighborhood narrows. This is
caused by a gradual decrease in the width of the func-
tion σ(t). The neuron-winner is located in the center
of the topological neighborhood. It affects neighbor-
ing neurons, but this effect decreases with increasing
distance to them according to (4). As a result, closely
located map nodes acquire similar characteristics.
The result of the learning process will be the
tuning of parameters of the Kohonen layer neurons,
which will correspond to different examples from the
training set. Thus, the self-organization of the struc-
ture of the Kohonen map is carried out, which ac-
quires the ability to combine multidimensional data
vectors in a cluster by identifying similar statisti-
cal characteristics in them. As a result, the ini-
tial high-dimensional space is projected onto a two-
dimensional map. Since self-organization maps are
characterized by the generalization property, they can
recognize input examples on which they have not pre-
viously been tuned – the new input data vector corre-
sponds to the map element to which it is mapped.
3 COLLECTION OF DATA FOR
MODELING
In order to correctly identify regularities in the de-
velopment of the scientific and educational sphere, it
is necessary to select the key properties that charac-
terize the processes under study, taking into account
the task. That is, it is necessary not only to choose
the maximum possible set of characteristics of the ob-
jects of study, but to form a set of those features that
describe the most significant aspects of activity in the
context of the analysis. In this case, the selected fea-
tures will make it possible to group the studied ob-
jects or processes according to their similarity. That
is, if the task of analyzing the competitiveness of uni-
versities is being solved, then it is necessary to deter-
mine a set of characteristics of countries that will in-
fluence this indicator. And as a result of clustering the
countries of the world according to these characteris-
tics, we will get a number of clusters, each of which
will group countries with a similar level of interna-
tional competitiveness of universities (since they will
have fairly close values of the characteristics that de-
termine this competitiveness).
Therefore, we will conduct an analysis of publicly
available databases that contain information on indi-
M3E2 2022 - International Conference on Monitoring, Modeling Management of Emergent Economy
206

`
universities according to certain areas of activity. For
example, in (Kucherova et al., 2021) developed a fuzzy
logic model for assessment and ranking of universities'
websites by criterion of usability.
However, the analysis of developments in this
direction did not allow to identify studies on the
modeling of university competitiveness based on cutting-
edge artificial intelligence technologies, moreover,
which would not be based in the rating on the expertly set
weights of the evaluation criteria.
2 MODELING METHOD
Solving the task of evaluating the international
competitiveness of universities is associated with a
number of specific problems, because competitiveness
does not have generally accepted evaluation indicator,
units or measurement scales. This is a subjective category
that depends on many factors affecting it. Moreover, the
set of these factors and the degree of influence of each of
them are also not determined by any objective
circumstances and can be chosen by analysts and
researchers depending on their own understanding of the
essence of the category “competitiveness of
universities”, the development of the educational
process, their own priorities, etc. All this imposes a
significant imprint of subjectivism on the formation of
methods of their evaluation.
It is possible to reduce the dependence on the
subjective opinions of individual experts with the use of
special modeling methods capable of revealing
regularities in the structure of an array of heterogeneous
data, when there are no predetermined values of the
resulting indicator, such as for the international
competitiveness of universities.
Under such conditions, the clustering approach is the
most appropriate means of searching for hidden
regularities in sets of explanatory variables. The main
feature of this approach is that with its application,
objects that belong to one cluster are more similar to each
other than to objects that are included in other clusters.
As a result, it becomes possible to form fairly
homogeneous groups of researched objects that are
characterized by similar properties.
There is a wide range of cluster analysis methods: K-
means (Hartigan and Wong, 1979), K-medoids
(Kaufman and Rousseeuw, 1990), Principal Component
Analysis (Jolliffe, 2002), Spectral Clustering (Von
Luxburg, 2007), Dendrogram Method (Sokal and Rohlf,
1962), Dendrite Method (Caliński and Harabasz, 1974),
Self-Organizing Maps – SOM (Kohonen, 1982;
Kohonen, 2001), Density-Based Spatial Clustering of
Applications with Noise – DBSCAN (Schubert et al.,
2017), Hierarchical DBSCAN – HDBSCAN (Campello
et al., 2013), Ordering Points to Identify the Clustering
Structure – OPTICS (Ankerst et al., 1999), Uniform
Manifold Approximation and Projection – UMAP
(McInnes and Healy, 2018), Balanced Iterative Reducing
and Clustering Using Hierarchies – BIRCH (Zhang et al.,
1996), etc.
Each of these methods has its advantages and areas of
application and tasks, where it reveals itself in the best
way. Experimental studies on comparative analysis of the
effectiveness of various clustering methods are
described, in particular, in scientific works (Kobets and
Novak, 2021; Kobets and Yatsenko, 2019; Subasi, 2020;
Velykoivanenko and Korchynskyi, 2022).
Taking into account the capabilities of each of the
mentioned methods and the specifics of this study, the
Kohonen self-organizing maps toolkit was used to cluster
countries by the level of competitiveness of universities,
which, in addition to forming homogeneous groups of
researched objects, provide a convenient tool for visual
analysis of clustering results. In particular, in contrast to
other clustering methods, the location of an object on the
Kohonen map immediately indicates to the analyst how
developed the investigated property is compared to
others, because the best and worst objects according to
the analyzed indicator are located in opposite corners of
the self-organizing map.
The result of constructing the Kohonen map is a
visual representation of a two-dimensional lattice of
neurons that reflect the organizational structure of the
countries of the world, forming clusters in which
countries are similar to each other according to the group
of indicators of evaluating the competitiveness of
universities (see figure 1).
Figure 1: Visual representation of clusters on the self-organizing map (Matviychuk et al., 2019).
Neurons
Kohonen layer (self-organizing map)
Input layer
Clusters
Figure 1: Visual representation of clusters on the self-organizing map (Matviychuk et al., 2019).
cators that can influence the level of competitiveness
of universities.
Thus, the World Bank’s “World Development In-
dicators” database contains the ranking of the world’s
countries by the level of “Government expenditure on
education, total (% of GDP)” indicator (The World
Bank, 2022). The indicator is calculated annually
(for 266 countries) based on data from national statis-
tics and international organizations, including data
from the UN. Information on individual countries has
been available in this database since 1970, in the last
decade the data is presented quite fully, but only un-
til 2018 (later data by countries is much less). Other
indicators presented in this database are much poorer
and less related to higher education.
In the Human Development Reports of UNDP
(United Nations Development Programme, 2022)
there are data for 195 countries for 2021 according to
the indicators: “Human Development Index (HDI)”
(both in general and by male and female sexes, in ad-
dition, by this indicator also shows the dynamics and
increases in dynamics since 1990), “Government ex-
penditure on education, % of GDP”, “High-skill to
low-skill ratio”, “Research and development expendi-
ture, % of GDP” (during 2014-2018), “Ratio of edu-
cation and health expenditure to military expenditure”
(during 2010-2017), “Foreign direct investment, net
inflows, % of GDP”, “International student mobility,
% of total tertiary enrollment”, indicators of employ-
ment and unemployment both in general and among
young people, migrants, population by age group, etc.
The Global Competitiveness Index from the
World Economic Forum for 2019 (World Economic
Forum, 2019) can also be informative in assessing the
international competitiveness of the country’s univer-
sities. On this resource, this index is given for 141
countries. Later, in 2020, the Global Competitiveness
Index has been paused.
Another resource with information on competi-
tiveness is the annual reports of the European Com-
mission (European Commission, 2022), in particu-
lar in the areas of: “Competitiveness & Innovation”,
which contains separate reports and the following sec-
tions: “Global Innovation Index”, “Global Attractive-
ness Index”, “Global Talent Competitiveness Index”,
“Elcano Global Presence Index”, “Innovation Output
Indicator”; “Learning & Research”, which presents
reports: “European Skills Index”, “European Lifelong
Learning Indicators (ELLI-Index)”, “Higher Educa-
tion Rankings”, “Composite Learning Index”.
The work “Global Talent Competitiveness Index:
2019” (Lanvin and Monteiro, 2019) contains inte-
grated assessments and ranking places of countries for
a number of top-level indices, as well as for basic in-
dicators.
To assess the competitiveness of world universi-
ties, the resource (UNIVERSITAS 21, 2021) can be
useful, which provides fairly detailed country-level
aggregated information on the research and educa-
tional activities of universities in 50 countries for
2020. Here are the indicators grouped into four gen-
eralized categories – “Resources”, “Environment”,
“Connectivity”, “Output”. Each of these categories
consists of a set of basic indices, all of which are listed
in the header of the table 1.
In addition, we add to the database the overall
competitiveness score and rank number in the general
list (these indicators will not be taken into account
Modelling the Design of University Competitiveness
207

Table 1: Indicators of evaluation of international competitiveness of countries’ universities.
OVERALL
RANKING
RESOURCES
2020 SCORES
ENVIRONMENT
2020 SCORES
CONNECTIVITY
2020 SCORES
OUTPUT
2020 SCORES
Country
Rank 2020
Rank 2019
Score 2020
Score 2019
Government expenditure on tertiary
education as a percentage of GDP
Total expenditure on tertiary
education as a percentage of GDP
Total expenditure per student USD PPP
Expenditure in tertiary institutions
for R&D as a percent of GDP
Expenditure in tertiary institutions
for R&D per head of population
Proportion of female students
Proportion of female academic staff
Data quality
Qualitative index of environment
WEF Survey
Proportion of international students
Proportion of articles with international collaborators
Webometrics VISIBILITY index divided by population
Rating of knowledge transfer
between university and companies
Percentage of university research
publications co-authored with industry
Total number of documents produced
by higher education institutions
Total documents produced per head of population
Average impact of articles
Weighted Shanghai ranking scores for
universities per head of population
Shanghai scores for best three universities
Tertiary enrollment rates
Percentage of population aged 24-64
with a tertiary qualification
Number of researchers in the nation per head of population
Unemployment rate of the tertiary
educated compared with school leavers
Argentina 40 38 46 45,1 56,7 48,4 13,8 13,4 4,7 100 97,1 100 67,8 51,3 9,1 52,4 7 54,1 19,5 2,1 6,2 45,9 2,6 13,1 90 61,6 14,9 30,9
Australia 9 8 82,2 80,9 37,7 70,6 42,9 64 51,2 100 91,3 100 98,1 81,9 78,9 72,8 56 68,1 41,4 15,9 85,3 84,3 76,8 39,3 100 79 55 32,6
Austria 12 12 79,3 77,2 81,9 64,8 48,7 68,6 63,7 100 84,7 100 72 68,3 63,1 86,9 54 84,8 100 3,3 49,4 86 57 22 85,1 56,5 62,5 31,3
Belgium 13 13 75,6 73,6 63,8 55,4 48,3 53 45 100 97,1 100 75,8 82,2 31,8 89,3 28,4 82,5 78,8 4,8 56,6 94,2 51,4 31,4 79,7 70,2 59,9 39,1
Brazil 41 40 45,6 44,1 49,9 66,5 37,9 n.a. n.a. 100 91,4 88,6 63,8 41,8 0,9 43,8 6,9 40,3 26,2 11,6 7,5 45,3 3,8 21,2 51,3 31,8 10,7 39,7
Bulgaria 45 44 42,7 41,8 32,3 40,3 17,8 4,3 1,6 100 97,9 93,2 53,1 54,7 16,8 57,5 10,9 46 44,3 0,8 14,6 55,2 3,3 2,7 71,2 38,1 25,8 45,2
Canada 7 6 83,2 81,9 62,5 86,8 62,9 63,6 53 100 88,6 90,9 73,3 87,1 47,4 68,8 69,2 86,3 59 17,2 62,6 82 44 42,9 88,2 100 51,8 33,7
Chile 31 32 54,3 51,3 48,4 100 22,3 14,8 6 100 85,1 100 81,4 54,8 1,4 81,6 14,3 62,3 28,3 2,2 16,1 63,4 8,2 11,8 88,5 43,5 6,1 30,2
China 26 27 56,8 54,7 42,5 50,7 20 15 4,4 100 n.a. 88,6 76,6 73 1,3 34,1 8,4 65,9 32 70,7 6,8 59,3 7,5 39,6 49,1 16,7 15 n.a.
Croatia 43 43 43,6 42,1 49,9 36,8 18 24,9 11,2 100 97,8 93,2 47,3 47 1,6 58,3 11 35,5 50,8 0,9 30,4 52,9 17,2 8 66,5 39,2 22,6 31,2
Czech Rep. 29 26 54,8 55,2 36,3 35,1 26,6 34,4 22,2 100 76,9 100 69,3 61,1 46,1 62 29,3 53,6 55,7 2,9 37 62,8 22 14,7 64,1 41,9 44,7 40,4
Denmark 3 5 85,7 82,5 80,4 62,7 44,9 100 91,4 100 88,6 95,5 67,4 80,6 39,5 85,3 47,5 89,2 85,2 4,3 100 97,1 83,3 38,8 80,6 65,7 95,7 21
Finland 8 9 82,8 80,4 80,8 61,9 46,6 68,5 54,6 100 100 100 81,6 93,8 30 82,3 64,7 90 77 2,9 70,8 86 72,2 23,9 88,2 78,1 81,3 41,3
France 17 17 68,6 67,6 57 53,6 43 44,3 35 100 87,9 100 73,1 69,6 37,4 77,7 23,8 70,3 68,8 13,5 28,2 75,6 28,9 40,6 65,6 63,7 53,8 39,8
Germany 16 16 70,5 69,6 51,3 44,9 46,3 51,2 46 97 78,6 100 61,6 86,8 30,8 67,8 38,6 87,9 76 21 34,2 79,1 32,9 39,7 70,2 50,2 61 37
Greece 37 37 47,4 47 35,1 26 10,9 31,8 15,5 97,1 68,6 93,2 26,9 49,2 12,5 68,7 35,2 43,7 61,5 2,5 31,2 73,3 21 14,1 100 54,8 38,2 36
Hong Kong 14 15 72,7 70,2 50,1 55,6 64,7 39,8 43,3 100 n.a. 90,9 97,2 76,7 42 54,3 48,2 82,5 35,8 3,5 63,7 95,9 54,9 26,3 74,3 50,9 41,4 41,4
Hungary 33 35 51,3 48,5 34,7 39,7 30 17,6 8,8 100 80,5 100 51,6 47 36,6 70,9 22,1 58,6 82,8 1,6 22,3 69,2 14,4 10,7 48,5 43,4 35,4 54,6
India 49 49 39,6 38,8 54,8 59,1 13 2,4 0,3 96,2 81,2 90,9 58,1 74,6 0,5 27,2 0,9 57,8 19 14,9 1,5 47,1 0,6 12,5 27,4 18,3 2,6 12,6
Indonesia 50 50 35 33,5 25,7 25 7,9 4,6 1 100 86,2 100 64,7 71,6 0,3 23,6 4,4 72,5 31,4 3,1 1,6 45,3 0 0 36,4 20,5 2,6 26,4
Iran 47 48 42,2 39,2 50,2 51,9 15 n.a. n.a. 92,1 62,2 81,8 67 52,8 1,6 33,7 5,1 52,1 10,6 7,3 12 51,7 5 15,2 69,6 36,9 8,1 n.a.
Ireland 19 19 66 64,7 28,7 29,6 35,2 25,2 33,7 100 90 100 68,6 87,6 32,6 75,1 60,1 88,2 63 2,4 64,8 80,8 47,6 18,7 77,8 81,1 49,8 36,8
Israel 18 18 67,4 67,3 39,4 52,1 29,6 50,9 34,6 100 n.a. 95,5 73,3 74,9 10,6 66,3 34,6 91,1 49,5 3,2 48,5 77,9 51,5 30,6 63,4 88 100 34,6
Italy 30 30 54,5 53,4 28,6 33 30,8 32,1 22,5 100 74,2 100 63,8 60 19,5 62,9 18 60,5 54,2 15,7 34,9 77,3 29,4 24,6 61,9 33,4 27,8 35,6
Japan 20 20 61,9 61,7 21,2 51,2 51 37,6 28,9 95,4 56,8 100 83,2 70,8 15,7 39 18,9 57 78 17,2 18,4 50,6 14,5 42,9 63,6 89,7 64,3 34,5
Korea 24 23 58 57,4 32,7 64,4 27,8 37,7 25,7 83,4 70,2 100 58 56,3 8,3 37,9 14,8 62,6 61,4 12,4 32,3 56,4 24,1 24,8 94,3 84,7 91,1 25,2
Malaysia 27 28 56,1 54,5 56,5 75,1 39,4 48 22,9 100 100 95,5 78,6 83,7 29,6 59,5 7,5 79,4 16,3 3,6 15,1 55,8 5,8 14 43,7 37,7 28,6 21,6
Mexico 48 47 41,7 41,1 47,2 50,5 19,5 12,7 4,1 100 n.a. 95,5 82,4 48,5 2,1 53 3,8 52,9 19,5 3 3,2 42,4 0,8 11,1 40,2 31,1 3 20,7
Netherlands 10 10 81,6 80,2 59,8 62,7 51,8 58,3 54,3 100 91,7 100 79,3 88 40,4 82,5 47,5 96,7 85,4 9 70,7 97,7 59,4 37,5 85 66,2 60,7 34,7
New Zealand 14 14 72,7 71,5 44,1 64,5 39,7 33,6 21,4 100 99,7 100 89,7 86,5 72 77,3 55,8 76,1 46,4 2,2 59,5 79,1 64,6 18,4 82 67,9 49,1 33,9
Norway 11 11 80,5 77,8 89,9 70,7 58,4 68,8 74,8 100 92,6 100 66,9 85,9 11,6 80,8 58,9 81 61,8 3,1 78,2 87,2 63 28,1 82 75,3 78,5 32,2
Poland 32 31 52,6 52,2 48,4 43,9 23,8 33,3 17,2 100 90 100 81,9 58,3 15,1 42,3 17,3 60,4 32,3 6,4 22,8 58,1 7,3 14,1 67,8 53,4 30,6 49,1
Portugal 25 25 57,6 56,8 39,4 42,6 29,3 55,3 31 100 88,6 100 60,9 71,7 23,5 71,9 33,9 64,5 41,5 3,6 47,2 66,9 26,7 18,7 63,9 43,1 52 33,7
Romania 44 45 43 41,7 32,9 42,8 28,9 5,2 2,4 100 100 95,5 76 45,2 17,7 36,6 10,2 54 32,1 2,3 15,9 50,6 2,7 5,9 48,2 29,6 10,8 45,8
Russia 35 35 49,1 48,5 37,3 42,5 22,5 9,8 4,6 100 100 100 70,2 60,1 15 36,2 8,4 43,9 20,1 8,8 8,3 47,7 2,9 21,7 81,9 97,9 34,6 47,7
Saudi Arabia 22 22 59,3 59,3 100 77,7 53,1 n.a. n.a. 96,3 81,7 79,5 50,5 69,3 17,1 100 3,9 68,9 29,6 3,1 12,7 76,7 7,8 24,8 69,7 41,2 n.a. 9,4
Serbia 42 41 44,2 43,4 55,8 48,7 17,4 32,9 8,8 100 93,1 90,9 42,3 52,9 16,3 62,1 8,5 52,1 23,7 1,1 20,5 53,5 9,3 7,4 66,5 37,2 25,2 28,7
Singapore 4 7 84,5 81,3 50,1 53,7 100 63,4 100 100 74,1 95,5 82 94 100 87,7 36,7 91,7 38,6 2,8 66,5 94,8 41,4 26,5 84,8 86,5 81,6 30,6
Slovakia 38 33 47,2 49,6 35,8 37 30,3 21,2 11,9 100 91,5 100 64,2 44,8 25,3 57,7 16,8 35,6 64,4 1 24,2 63,4 4,7 2,9 46,6 42,5 33,9 46,4
Slovenia 28 29 55,4 53,6 44,5 38,3 29,9 20,3 12,6 100 85,1 100 63,7 65,3 14,3 71,1 25,1 63,1 53,6 0,7 48,8 67,4 31,4 7,4 78,6 56,1 54,2 35,9
SAR 34 34 49,7 48,7 37,4 49,9 28,9 26,2 6,1 100 n.a. 88,6 86,7 45,3 11,9 68,6 3,7 54,8 36,9 3,7 8,6 69,8 5,8 18,6 22,4 12,4 6 100
Spain 23 24 58,6 57,3 41,6 45,9 33,5 32 21,6 100 86,9 100 69,9 59,5 11,9 61,6 30,7 57 46,2 12,7 37 65,7 29,9 22 88,9 64,4 34,8 39,7
Sweden 5 4 84,3 82,9 71,2 59,7 64,6 83,2 73,7 100 89,7 100 75,2 76,9 24,8 86,8 59,6 83,1 86,2 6,3 83,5 89,5 82,5 38,8 67 74,7 92 24,4
Switzerland 2 2 90,1 88,6 64,9 51,7 75,4 88 97,6 99,4 71 100 69,5 100 65,2 91,3 79,7 100 76,9 5,8 91,7 100 100 44,2 59,6 75,6 63,7 30,4
Taiwan 21 21 60,5 60,5 33,5 51,8 32,8 29,3 26,2 100 72 93,2 86,9 72,3 16,2 45,4 44,3 80 38,3 5,1 29,1 55,2 20,3 19,7 84,5 84,5 76,1 25
Thailand 46 46 42,3 41,2 32,1 34,8 13,7 13,7 4,2 100 100 95,5 71,9 60,1 4,8 57,8 10,2 65,5 34,7 2,1 4,3 53,5 1,8 11,3 49,3 28,1 14,7 18,2
Turkey 39 42 46,3 43,3 71,1 70,5 27,9 31,5 14,8 92 88 100 44,9 51,3 5,5 30,6 7,6 57,4 16,6 7,2 11,9 44,2 4,1 11,2 94,7 35,9 16,8 23,2
Ukraine 36 38 47,8 45,1 76,4 63,9 10,8 3,2 0,5 100 n.a. 90,9 60,6 62,4 11,6 41,2 8 45,8 60,4 1,3 4,2 33,1 0 0 83,4 84,4 12 58,3
UK 6 3 83,6 84,5 28,2 64,7 63,1 38,8 29,7 100 89,5 100 89,5 75,5 65,8 72,1 63,7 82,1 68,9 31,1 63,1 86 58,1 73,7 60 79,1 53,1 34,4
USA 1 1 100 100 42,6 91,2 80,1 35,7 37,7 100 98,2 100 100 90,8 19 45 100 92,3 58,4 100 41,2 78,5 43,4 100 88,2 81,9 51,6 48,7
M3E2 2022 - International Conference on Monitoring, Modeling Management of Emergent Economy
208
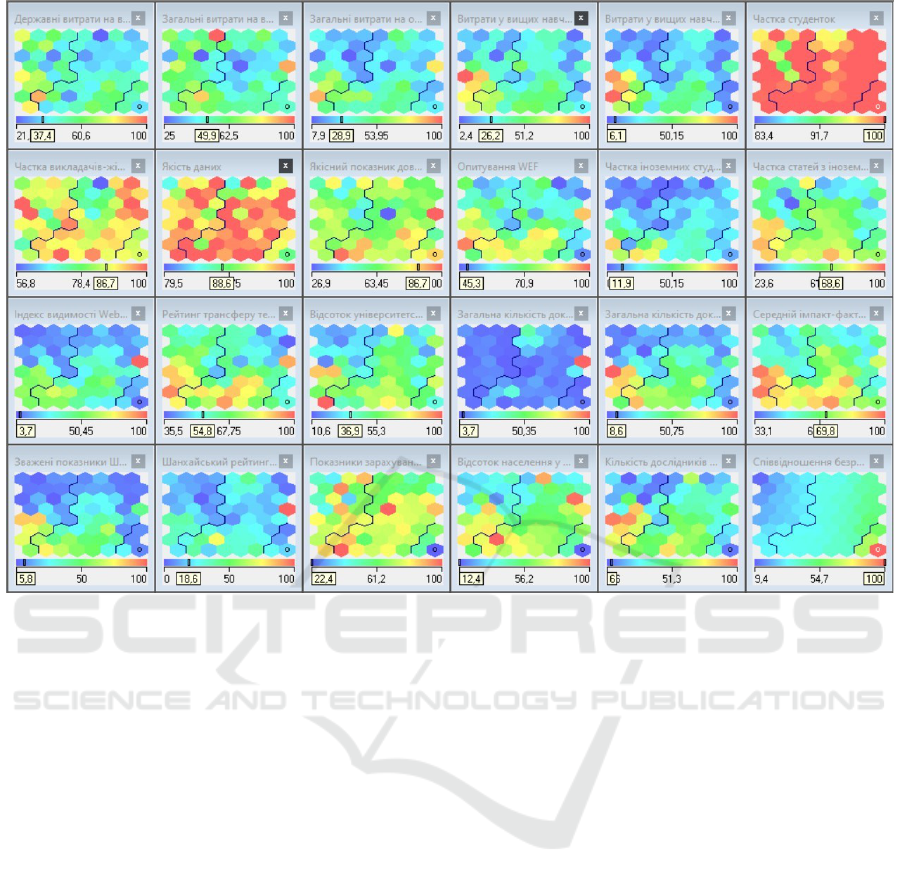
Figure 2: Kohonen topological maps for all indicators of university competitiveness assessment.
when clustering countries, but will serve as a refer-
ence when analyzing clusters).
To carry out clustering based on Kohonen maps,
it is necessary to avoid gaps in the data. Since there
are only 50 countries in this database, moreover, the
scores for each individual indicator for different coun-
tries are quite close to each other, so we will not divide
countries into groups and replace the blanks with the
corresponding average values for all countries. This
will not lead to distortions of the clustering results,
since the percentage of gaps in this database is very
small.
4 MODELING THE UNIVERSITY
COMPETITIVENESS
The construction of Kohonen self-organizing maps in
our study was carried out using the analytical plat-
form Deductor Studio Academic. In the process of
constructing a map, the task of finding its optimal di-
mension (number of neurons) arises, which is imple-
mented experimentally on the basis of statistical data.
The dimension of the self-organizing map was chosen
from various options according to the mean weighted
quantization error criterion, which reflects the aver-
age distance between the data vector given to the map
inputs and neurons’ parameters.
A hexagonal lattice of neurons with dimensions of
8 by 8 was determined as the most adequate structure
of a self-organizing map for this task according to a
given set of indicators (table 1). Self-organization oc-
curs over 1500 learning epochs.The map parameters
are initialized with small random variables. Gaussian
(4) was chosen as a function of the neighborhood of
neurons. Since all indicators for assessing the com-
petitiveness of universities are already presented on
an identical scale from 0 to 100, none of them will
have a decisive influence on the clustering process.
Therefore, it was decided to build Kohonen maps on
the original data without processing them. As a re-
sult of the process of self-organization, the countries
from the table 1 were distributed among three clus-
ters, which can be seen in figure 2.
As can be seen from the topological maps for all
indicators in figure 2, for the vast majority of them
there is no clear demarcation of their levels between
clusters. That is, their low, medium and high values
are evenly distributed throughout the map, which, to-
gether with the low levels of significance of many in-
dicators (figure 3), does not contribute to the quality
of the countries segmentation process.
Modelling the Design of University Competitiveness
209

`
Indicator
Significance of the indicator
Cluster 1 Cluster 2 Cluster 3 In all
Proportion of female
students
Data quality
Total expenditure per
student USD PPP
Total expenditure on
tertiary education as a
percentage of GDP
Proportion of
international students
Proportion of female
academic staff
Proportion of articles
with international
collaborators
Given the low significance of a large number of
indicators selected for the study, a series of experiments
was conducted on the construction of Kohonen maps on
different sets of input variables, when various
combinations of the least influential factors were
alternately removed. However, each time the same low
quality of the distribution of countries by the levels of
university competitiveness evaluation indicators
remained. For example, for all clustering options,
Bulgaria, South Africa, Poland, the Russian Federation,
Romania, Slovakia, Hungary, and Croatia were located
next to Ukraine on Kohonen map, but the United States
was also a neighbor in this cluster. Of course, such
segmentation of countries cannot be considered
acceptable.
Therefore, it was decided to apply z-score
standardization to process the initial values of the
variables. As a result of forming a map on the full set of
standardized explanatory variables, 5 clusters were
obtained (see figure 4).
Figure 3: Levels of significance of a number of indicators for evaluating the competitiveness of universities.
Given the low significance of a large number of
indicators selected for the study, a series of experi-
ments was conducted on the construction of Koho-
nen maps on different sets of input variables, when
various combinations of the least influential factors
were alternately removed. However, each time the
same low quality of the distribution of countries by
the levels of university competitiveness evaluation in-
dicators remained. For example, for all clustering
options, Bulgaria, South Africa, Poland, the Russian
Federation, Romania, Slovakia, Hungary, and Croatia
were located next to Ukraine on Kohonen map, but
the United States was also a neighbor in this cluster.
Of course, such segmentation of countries cannot be
considered acceptable.
Therefore, it was decided to apply z-score stan-
dardization to process the initial values of the vari-
ables. As a result of forming a map on the full set
of standardized explanatory variables, 5 clusters were
obtained (figure 4).
Figure 4 shows that the levels of indicators change
when crossing from cluster to cluster, which indi-
cates a successful delimitation of countries based on
a given set of explanatory variables. Ukraine got to
the upper right corner of the Kohonen map next to
Argentina, Bulgaria, Poland, the Russian Federation,
Serbia, Turkey, Croatia, and Chile. Somewhat lower
in the same cluster were Brazil, India, Indonesia, Iran,
China, Malaysia, Mexico, South Africa, Romania,
Slovakia, and Thailand.
Austria, Denmark, the Netherlands, Norway, Sin-
gapore, Finland, Switzerland, Sweden are located in
the opposite corner of the map from Ukraine (bottom
left). The United States and Great Britain were lo-
cated in the upper left corner of the map. They are
surrounded by Australia, Hong Kong, Israel, Canada,
M3E2 2022 - International Conference on Monitoring, Modeling Management of Emergent Economy
210

Figure 4: Kohonen topological maps according to the normalized indicators of university competitiveness assessment.
and Taiwan.
It should be noted that since, in accordance with
the given task, polar objects are located on the Ko-
honen map in opposite corners, this self-organization
of countries indicates that the competitiveness of
Ukrainian universities is currently quite far from the
competitiveness of universities in developed coun-
tries.
The analysis of the characteristics of the univer-
sities of the countries of the most developed cluster
makes it possible to determine the priority areas of de-
velopment and tasks that must be solved in order to in-
crease the international competitiveness of Ukrainian
universities.
Research and generalization of traditional, en-
trepreneurial, innovative and creative models of uni-
versities, their selection depending on objective en-
dogenous and exogenous conditions and imperatives
of the development of Ukrainian higher education
made it possible to substantiate the most adaptive
competitive model of the university, which is shown
in figure 5.
Critically important in the proposed model is the
development of strategic partnership in the triangle
“science – business – education”, public-private part-
nership and consolidated social responsibility.
`
Figure 5: Competitive model of the university.
CONCLUSIONS
The global transformation of university education raises
new challenges for state authorities in the field of
education and university administrations to ensure their
competitiveness in the international market of
educational services. In the context of increasing the
efficiency of the university management process in
modern globalization conditions, the tasks of assessing
its international competitiveness arise.
In today’s world, the ways of innovative behavior of
corporations, universities and other organizations must
take into account the need to act in conditions of political,
market and social turbulence, which necessitates the
constant generation of non-standard ideas, strategic
concepts, models and behaviors.
This research is aimed at developing a new
methodological approach to the study of such a poorly
formalized indicator as the competitiveness of
universities. Since competitiveness does not have
generally accepted evaluation indicator, units or
measurement scales, etc., it was decided to apply the
clustering approach for searching of hidden regularities
in the set of explanatory variables.
Accordingly, the article carried out a thorough
analysis of existing approaches to evaluating the
competitiveness of universities and identified unresolved
problems in this sphere. In addition, various methods of
clustering, their advantages and features were analyzed,
and the most appropriate method for solving the problem
was chosen.
The use of the Kohonen self-organizing map toolkit
was justified, which, in addition to forming
homogeneous groups of researched objects, provide a
convenient tool for visual analysis of clustering results.
In addition, the methodology of self-organizing maps
provides an analytical tool for searching the indicators
which are lagging the most, so that management actions
can be focused on increasing the competitiveness of
Ukrainian universities in the global market of educational
services.
As a result of the conducted research, a competitive
model of the university was formed during the analysis
of the competitive advantages of the universities of the
countries included in the most competitive cluster.
REFERENCES
Ankerst, M., Breunig, M., Kriegel, H.-P., and Sander, J. (1999).
OPTICS: Ordering points to identify the clustering
structure. ACM SIGMOD Record, 28(2):49-60.
http://dx.doi.org/10.1145/304182.304187.
Anowar, F., Helal, M.A., Afroj, S., Sultana, S., Sarker, F., and
Mamun, K.A. (2015). A Critical Review on World
University Ranking in Terms of Top Four Ranking
Systems. In K. Elleithy and T. Sobh (Eds.), Lecture Notes
Intelligence concentration
(professors, researchers,
students)
Academic quality
and integrity
Diversified
financial system
Innovation
management
Integration of
research and
teaching
Entrepreneurial
motivation and
behavior
Developed digital
infrastructure
Creative
thinking and
culture
Efficient
research and
development
Figure 5: Competitive model of the university.
5 CONCLUSIONS
The global transformation of university education
raises new challenges for state authorities in the field
of education and university administrations to ensure
their competitiveness in the international market of
educational services. In the context of increasing the
Modelling the Design of University Competitiveness
211

efficiency of the university management process in
modern globalization conditions, the tasks of assess-
ing its international competitiveness arise.
In today’s world, the ways of innovative behavior
of corporations, universities and other organizations
must take into account the need to act in conditions of
political, market and social turbulence, which neces-
sitates the constant generation of non-standard ideas,
strategic concepts, models and behaviors.
This research is aimed at developing a new
methodological approach to the study of such a poorly
formalized indicator as the competitiveness of univer-
sities. Since competitiveness does not have generally
accepted evaluation indicator, units or measurement
scales, etc., it was decided to apply the clustering ap-
proach for searching of hidden regularities in the set
of explanatory variables.
Accordingly, the article carried out a thorough
analysis of existing approaches to evaluating the com-
petitiveness of universities and identified unresolved
problems in this sphere. In addition, various methods
of clustering, their advantages and features were an-
alyzed, and the most appropriate method for solving
the problem was chosen.
The use of the Kohonen self-organizing map
toolkit was justified, which, in addition to forming
homogeneous groups of researched objects, provide
a convenient tool for visual analysis of clustering re-
sults.
In addition, the methodology of self-organizing
maps provides an analytical tool for searching the in-
dicators which are lagging the most, so that manage-
ment actions can be focused on increasing the com-
petitiveness of Ukrainian universities in the global
market of educational services.
As a result of the conducted research, a compet-
itive model of the university was formed during the
analysis of the competitive advantages of the universi-
ties of the countries included in the most competitive
cluster.
REFERENCES
Ankerst, M., Breunig, M. M., Kriegel, H.-P., and Sander,
J. (1999). OPTICS: Ordering Points to Identify the
Clustering Structure. In Proceedings of the 1999 ACM
SIGMOD International Conference on Management
of Data, SIGMOD ’99, page 49–60, New York, NY,
USA. Association for Computing Machinery. https:
//doi.org/10.1145/304182.304187.
Anowar, F., Helal, M. A., Afroj, S., Sultana, S., Sarker,
F., and Mamun, K. A. (2015). A Critical Review
on World University Ranking in Terms of Top Four
Ranking Systems. In Elleithy, K. and Sobh, T., editors,
New Trends in Networking, Computing, E-learning,
Systems Sciences, and Engineering, pages 559–566,
Cham. Springer International Publishing. https://doi.
org/10.1007/978-3-319-06764-3 72.
Avralev, N. and Efimova, I. (2015). University Rank-
ings as a Tool for Assessing the Quality of Educa-
tion in the Context of Globalization. Asian Social
Science, 11(10):292–298. https://doi.org/10.5539/ass.
v11n10p292.
Avralev, N. V. and Efimova, I. N. (2013). University Rank-
ings as a Tool to Enhance Competitiveness, Cluster-
ing and Transnational Governance of Higher Educa-
tion in the Context of Globalization. Middle-East
Journal of Scientific Research, 16(3):357–361. https:
//www.idosi.org/mejsr/mejsr16(3)13/7.pdf.
Cali
´
nski, T. and Harabasz, J. (1974). A dendrite
method for cluster analysis. Communications
in Statistics, 3(1):1–27. https://doi.org/10.1080/
03610927408827101.
Campello, R. J. G. B., Moulavi, D., and Sander, J. (2013).
Density-based clustering based on hierarchical den-
sity estimates. In Pei, J., Tseng, V. S., Cao, L., Mo-
toda, H., and Xu, G., editors, Advances in Knowl-
edge Discovery and Data Mining, pages 160–172,
Berlin, Heidelberg. Springer Berlin Heidelberg. https:
//doi.org/10.1007/978-3-642-37456-2 14..
Chl
´
adkov
´
a, H., Sk
´
ypalov
´
a, R., and Bla
ˇ
skov
´
a, V. (2021).
Strengthening the university competitiveness in the
Czech Republic. Tuning Journal for Higher Educa-
tion, 9(1):127–155.
Deem, R., Mok, K. H., and Lucas, L. (2008). Trans-
forming higher education in whose image? explor-
ing the concept of the ‘world-class’ university in eu-
rope and asia. Higher Education Policy, 21(1):83–97.
https://doi.org/10.1057/palgrave.hep.8300179.
Dimitrova, G. and Dimitrova, T. (2017). Competitiveness
of the universities: measurement capabilities. Trakia
Journal of Sciences, 15(1):311–316. https://doi.org/
10.15547/tjs.2017.s.01.055.
European Commission (2022). Statistical Au-
dits. https://knowledge4policy.ec.europa.eu/
composite-indicators/statistical-audits en.
Hartigan, J. A. and Wong, M. A. (1979). Algorithm AS
136: A K-Means Clustering Algorithm. Journal of the
Royal Statistical Society. Series C (Applied Statistics),
28(1):100–108. https://doi.org/10.2307/2346830.
Jolliffe, I. T. (2002). Principal Component Analysis.
Springer Series in Statistics. Springer, 2nd edition.
https://link.springer.com/book/10.1007/b98835.
Jur
´
a
ˇ
skov
´
a, O., Ju
ˇ
r
´
ıkov
´
a, M., and Kocourek, J. (2015a).
Brand Building of a University as an Integral Part of
the Educational Process. The Turkish Online Journal
of Educational Technology,(Special Issue for INTE
2015):100–105. http://tojet.net/special/2015 9 1.pdf.
Jur
´
a
ˇ
skov
´
a, O., Ju
ˇ
r
´
ıkov
´
a, M., and Kocourek, J. (2015b). In-
novation of Educational Process as a Factor of En-
hancing Competitiveness. The Turkish Online Jour-
nal of Educational Technology,(Special Issue 2 for
INTE 2015):301–305. http://www.tojet.net/special/
2015 7 2.pdf.
M3E2 2022 - International Conference on Monitoring, Modeling Management of Emergent Economy
212

Kaufman, L. and Rousseeuw, P. J. (1990). Partitioning
Around Medoids (Program PAM), chapter 2, pages
68–125. Wiley Series in Probability and Statistics.
John Wiley & Sons, Ltd. https://doi.org/10.1002/
9780470316801.ch2.
Kobets, V. and Novak, O. (2021). EU countries clustering
for the state of food security using machine learning
techniques. Neiro-Nechitki Tekhnolohii Modelyuvan-
nya v Ekonomitsi, 2021(10):86–118.
Kobets, V. and Yatsenko, V. (2019). Influence of the
Fourth industrial revolution on divergence and con-
vergence of economic inequality for various coun-
tries. Neiro-Nechitki Tekhnolohii Modelyuvannya v
Ekonomitsi,2019(8):124–146.
Kohonen, T. (1982). Self-organized formation of topolog-
ically correct feature maps. Biological Cybernetics,
43(1):59–69. https://doi.org/10.1007/BF00337288.
Kohonen, T. (2001). Self-organizing maps, volume 30 of
Springer Series in Information Sciences. Springer
Berlin, Heidelberg, 3 edition. https://doi.org/10.1007/
978-3-642-56927-2.
Kucherova, H., Honcharenko, Y., Ocheretin, D., and Bil-
ska, O. (2021). Fuzzy logic model of usability of
websites of higher education institutions in the con-
text of digitalization of educational services. Neiro-
Nechitki Tekhnolohii Modelyuvannya v Ekonomitsi,
2021(10):119–135.
Lanvin, B. and Monteiro, F. (2019). Global Talent Com-
petitiveness Index 2019. INSEAD. https://nonews.co/
wp-content/uploads/2019/06/GTCI2019.pdf.
Lukianenko, D., Lukianenko, O., Mozghalli, O., Dvornyk,
I., and Oriekhov, M. (2020). Digital imperative of uni-
versity activities transformation. Financial and credit
activity: problems of theory and practice, 4(35):449–
458. https://doi.org/10.18371/fcaptp.v4i35.222478.
Lukianenko, D. and Strelchenko, I. (2021). Neuromodeling
of features of crisis contagion on financial markets be-
tween countries with different levels of economic de-
velopment. Neiro-Nechitki Tekhnolohii Modelyuvan-
nya v Ekonomitsi, 2021(10):136–163.
Lukman, R., Krajnc, D., and Glavi
ˇ
c, P. (2010). Uni-
versity ranking using research, educational and en-
vironmental indicators. Journal of Cleaner Produc-
tion, 18(7):619–628. https://doi.org/10.1016/j.jclepro.
2009.09.015.
Marginson, S. and van der Wende, M. (2016). To Rank
or To Be Ranked: The Impact of Global Rankings in
Higher Education. Journal of Studies in International
Education, 11(3-4):306–329. https://doi.org/10.1177/
1028315307303544.
Matviychuk, A., Lukianenko, O., and Miroshnychenko,
I. (2019). Neuro-fuzzy model of country’s invest-
ment potential assessment. Fuzzy economic review,
24(2):65–88. https://doi.org/10.25102/fer.2019.02.04.
McInnes, L. and Healy, J. (2018). UMAP: Uniform Mani-
fold Approximation and Projection for Dimension Re-
duction. https://doi.org/10.48550/arXiv.1802.03426.
Sannikova, I., Prikhodko, E., and Muhitdinov, A. (2021).
Assessment of the universities impact on global com-
petitiveness based on rankings. E3S Web Conferences,
296:08009.
Satsyk, V. (2014). Global Competitiveness of Universi-
ties: Key Determinants and Strategies (International
and Ukrainian cases). In Int. Conf. “The Education
and Science and their Role in Social and Industrial
Progress of Society”, 12-15 June 2014, Kyiv, Ukraine.
https://www.academia.edu/10233950.
Sayed, O. H. (2019). Critical Treatise on Univer-
sity Ranking Systems. Open Journal of Social
Sciences, 07(12):39–51. https://doi.org/10.4236/jss.
2019.712004.
Schubert, E., Sander, J., Ester, M., Kriegel, H., and Xu, X.
(2017). DBSCAN revisited, revisited: Why and how
you should (still) use DBSCAN. ACM Transactions
on Database Systems, 42(3):1–21. https://doi.org/10.
1145/3068335.
Sokal, R. and Rohlf, F. (1962). The comparison of den-
drograms by objective methods. Taxon, 11:33–40.
https://doi.org/10.2307/1217208.
Stoimenova, B. (2019). Regional innovation systems and
university competitiveness. International Journal of
Innovation, 7(2):227–239. https://doi.org/10.5585/iji.
v7i2.353.
Subasi, A. (2020). Clustering examples. In Practical
Machine Learning for Data Analysis Using Python,
pages 465–511. Elsevier. https://doi.org/10.1016/
b978-0-12-821379-7.00007-2.
Taylor, P. and Braddock, R. (2008). International Uni-
versity Ranking Systems and the Idea of Univer-
sity Excellence. Journal of Higher Education Policy
and Management, 29(3):245–260. https://doi.org/10.
1080/13600800701457855.
Tee, K. F. (2016). Suitability of performance indicators and
benchmarking practices in UK universities. Bench-
marking: An International Journal, 23(3):584–600.
https://doi.org/10.1108/BIJ-07-2014-0069.
Teixeira, A., Oliveira, A., Daniel, A., Preto, M., Br
´
as, G.,
and Rodrigues, C. (2020). The Impact of Universi-
ties on Regional Competitiveness: A Review of the
Main Theoretical and Methodological Approaches. In
Daniel, A., Teixeira, A., and Preto, M., editors, Exam-
ining the Role of Entrepreneurial Universities in Re-
gional Development, pages 67–92. IGI Global. https:
//doi.org/10.4018/978-1-7998-0174-0.ch004.
The World Bank (2022). World Development Indica-
tors. https://data.worldbank.org/indicator/SE.XPD.
TOTL.GD.ZS.
United Nations Development Programme (2022). Human
Development Reports. http://hdr.undp.org/en/content/
download-data.
UNIVERSITAS 21 (2021). Rankings Raw Data 2020.
https://universitas21.com/media/966.
Velykoivanenko, H. and Korchynskyi, V. (2022). Appli-
cation of Clustering in the Dimensionality Reduction
Algorithms for Separation of Financial Status of Com-
mercial Banks in Ukraine. Universal Journal of Ac-
counting and Finance, 10(1):148–160. https://doi.org/
10.13189/ujaf.2022.100116.
Modelling the Design of University Competitiveness
213

Von Luxburg, U. (2007). A tutorial on spectral clustering.
Statistics and computing, 17(4):395–416. https://doi.
org/10.1007/s11222-007-9033-z.
World Economic Forum (2019). Global Compet-
itiveness Index 4.0. http://reports.weforum.
org/global-competitiveness-report-2019/
competitiveness-rankings/.
Zhang, T., Ramakrishnan, R., and Livny, M. (1996).
BIRCH: an efficient data clustering method for very
large databases. In Proceedings of the 1996 ACM
SIGMOD international conference on Management of
data, page 103–114. ACM. https://doi.org/10.1145/
233269.233324.
M3E2 2022 - International Conference on Monitoring, Modeling Management of Emergent Economy
214
