
Nonlinear Analysis of the Dynamics of Sales of Electric Automobiles in
the Chinese Market
Serhii Kurkula
1 a
, Nataliia Maksyshko
1 b
, Dmytro Ocheretin
1 c
and Serhii Cheverda
1 d
1
Zaporizhzhia National University, 66 Zhukovskogo Str., Zaporizhzhia, 69600, Ukraine
Keywords:
Electric Car Market, Dynamics of Sales Volumes, Time Series, Normalized Hurst Range Method, Phase
Analysis, Method of Recurrence Plots.
Abstract:
The article is devoted to the research of the dynamics of sales of electric automobiles in the Chinese market
using non-linear analysis tools. The relevance of the work is due, on the one hand, to the sharp development
of the electric vehicle segment in the global automobile market, in which China’s market share was 45% of
sales in 2020. On the other hand, the use of different approaches to forecasting the sales of electric vehicles
leads to unsatisfactory results. The article analyzes the nature of the properties of the dynamics of sales of
electric automobiles in the Chinese market using non-linear analysis tools. The initial data for the analysis
is the time series of monthly sales volumes from January 2016 to June 2022 of the leading manufacturers of
electric vehicles. For the research, three methods of nonlinear dynamics were used: the Hurst normalized
range method, phase analysis, and the recurrence plots method. The calculations were carried out in the R
software environment. As a result of applying the Hurst normalized range method, the fractal nature of time
series, the property of trend stability, and the presence of long-term memory were revealed. The use of phase
analysis made it possible to reveal cyclicity in dynamics, to evaluate the characteristics of attractors (quasi-
cycles) and their features for each agent on the market. The construction of recurrence plots, their topological
and quantitative analysis confirmed the deterministic nature of the dynamics. The results of the research can
be used to select relevant forecasting methods and their parameters.
1 INTRODUCTION
The policy of developed countries regarding the trans-
formation of the fuel and energy market indicates
that transport (one of the main consumers of energy)
has begun to move rapidly towards reducing the con-
sumption of fossil fuels. The most important indica-
tor of change in this process has been an increase in
the production of electric vehicles, which is increas-
ing amid high expectations of pent-up demand.
The main reasons that favor the increasing popu-
larity of electric vehicles in the world can be divided
into three groups. The first group includes legislative
factors: sales are stimulated in different countries by
various methods. The most popular of them: subsi-
dies or discounts when buying the automobile free
parking spaces (as opposed to paid spaces for cars
with internal combustion engines), free charging of
a
https://orcid.org/0000-0003-0717-0291
b
https://orcid.org/0000-0002-0473-7195
c
https://orcid.org/0000-0001-6705-6381
d
https://orcid.org/0000-0003-2161-037X
cars in specially designated places. The second group
of factors is concern for the environment: govern-
ments encourage citizens to buy automobiles that do
not produce carbon dioxide during operation, and so-
cially responsible citizens tend to buy such automo-
biles. The third group of factors includes energy se-
curity: the price of oil and gasoline depends on the
global market. The number of countries that produce
and export them is small; a large number of countries
may suffer as a result of unpredictable phenomena in
the oil market or supply disruptions. In contrast, elec-
tricity generation is more diversified in terms of its
generation capacity.
Competition in the field of electric transport gives
rise to new technologies, enterprises, business mod-
els, and, finally, new markets. Today, at the stage of
formation of the global market for electric vehicles,
the total volume of investments in the production of
electric vehicles and the creation of an infrastructure
for it is rapidly increasing all over the world. The se-
quence of decisions that will be made during this pe-
riod is laid the foundation for the future architecture
Kurkula, S., Maksyshko, N., Ocheretin, D. and Cheverda, S.
Nonlinear Analysis of the Dynamics of Sales of Electric Automobiles in the Chinese Market.
DOI: 10.5220/0011932500003432
In Proceedings of 10th International Conference on Monitoring, Modeling Management of Emergent Economy (M3E2 2022), pages 185-195
ISBN: 978-989-758-640-8; ISSN: 2975-9234
Copyright
c
2023 by SCITEPRESS – Science and Technology Publications, Lda. Under CC license (CC BY-NC-ND 4.0)
185

of the global market: from educational and produc-
tion standards, the organization of urban infrastruc-
ture to new business models and market regulation
conditions.
The automotive market is an object that is de-
veloping quite actively, and the importance of the
transport business for the global economy and the
economies of individual countries is constantly grow-
ing. According to Bloomberg rating agency estimates
by 2040 (in less than 20 years) electric automobile
sales will account for 2/3 of the global automotive
market (McKerracher and Wagner, 2021). Therefore,
the study of the nature of the dynamics of the electric
vehicle market is of significant scientific and practical
interest.
The global market for electric vehicles is devel-
oping, so it is necessary to determine the models for
its development. Based on the statistical analysis of
the electric vehicle market, it can be revealed that
China is today the main player in electric vehicle
sales and market penetration. In particular, in 2013,
China achieved phenomenal growth in vehicle sales
specifically in the segment of battery electric vehicles
(BEV) and hybrid vehicles (PHEV). For six consecu-
tive years from 2012 to 2017, the annual growth rate
of the market volume is at least 45 per cent (Jin and
He, 2019). And in 2020, according to the Interna-
tional Energy Agency (Paoli et al., 2022), the Chinese
market accounted for almost 45 per cent of global
sales. Thus, the study of the development dynamics
of the electric vehicle market in China is necessary
as a basis for further research in the markets of other
countries.
2 RELATED WORKS
Zhang et al. (Zhang et al., 2017) presents Singular
Spectral Analysis (SSA) as a one-dimensional time
series model and Vector Autoregressive Model (VAR)
as a multivariate model that displays the sales volume
of automobiles with electric and hybrid engines in
China. Empirical calculation results show that SSA
satisfactorily indicates the market trend. The VAR
model, which contains exogenous parameters related
to the market, according to the authors, can signifi-
cantly improve the accuracy of the results when used
to build forecasts.
The price of charging the automobile is important
for owners during its operation. Zhang et al. (Zhang
et al., 2018) proposes a pricing model for public-
private partnership projects of automobile charging
infrastructure in China, which is based on the use of
the system dynamics (SD) method. In paper (Dhakal
and Min, 2021), based on predictive data on the num-
ber of automobiles, a simulation of the spread of elec-
tric vehicles is presented using the example of France
and Germany.
Articles (Zhu and Du, 2018; Ensslen et al., 2019)
are devoted to predicting the dynamics of the distri-
bution of electric vehicles within the European Union.
For this, logistic models are used, in particular, the lo-
gistic and Bass diffusion model (Zhu and Du, 2018),
which is used in (Ensslen et al., 2019) to predict the
number of cars used in Beijing.
An overview of the methods that are used to pre-
dict the penetration of electric vehicles into the pas-
senger vehicle market is presented in (Jochem et al.,
2018). Two groups of models are distinguished:
econometric models with disaggregated data (such
as discrete choice) and simulation models based on
agents. Some methods have been found to have a
stronger methodological basis, while others require
complex datasets or can be more flexibly combined
with other methods. Despite the absence of a domi-
nant method, Jochem et al. (Jochem et al., 2018) jus-
tify the advantage of hybrid approaches and managed
data that take into account micro and macro aspects,
which allows obtaining more accurate results.
In (Rietmann et al., 2020), using a logistic growth
model, a long-term forecast of stocks of electric ve-
hicles in 26 countries on five continents is provided.
The findings show that in 2032, 30 per cent of the
global vehicle fleet will be electric vehicles. However,
the results obtained by the authors also demonstrate
significant differences between countries, which may
be due to differences in government support.
Electric vehicle sales are influenced by many fac-
tors (especially in China) and there are not many sales
forecasting models available. In particular, Wan et al.
(Wan et al., 2021) used decomposition and integration
procedures based on the TEI@I methodology. So, in
the forecasting model, principal component regres-
sion analysis (PCR) was used to work with a linear
relationship. Then a BP neural network and a sup-
port vector machine (SVM) were used to work with
non-linear dependence. In the last step, all models
were integrated together. The Granger causality test
and the degree of gray correlation are used to quan-
tify the factors that affect EV sales through consumer
network data analysis. On the example of two auto-
mobile models, it was found that the PCR-BP models
and the PCR-SVM models have better predictive per-
formance than one model. According to the authors,
this approach is more suitable for making decisions
about forecasting markets for similar products.
Dingab and Li (Dingab and Li, 2021) proposes to
use the modified gray model as a promising tool for
M3E2 2022 - International Conference on Monitoring, Modeling Management of Emergent Economy
186

predicting sales of electric vehicles.
The use of different approaches to forecasting the
sales of electric vehicles indicates that the quality of
the results is not satisfactory. A common feature of
almost all almost all forecasting methods that are pre-
sented in the review is that they provide for the sub-
ordination of volume dynamics to a linear paradigm.
However, today it is a recognized fact that the dy-
namics of most markets does not obey the law of nor-
mal distribution, and therefore their modeling by tra-
ditional methods leads to significantly unsatisfactory
results. The linear paradigm has been replaced by
a nonlinear paradigm (Peters, 1994), which is based
on the recognition of the fractal nature of the market
and is actively developed for analysis and modeling,
including in (Perepelitsa and Maksyshko, 2012) and
(Maksyshko et al., 2020). This statement is based on
such features of time series (TS) of indicators charac-
terizing financial markets: the lack of independence
of levels, the presence of long-term memory, and oth-
ers (Derbentsev et al., 2019; Kmytiuk and Majore,
2021). The use of statistical methods for their re-
search and further forecasting (as the ultimate goal
of the analysis) turns out to be inadequate. Therefore,
there is a need to use new, different from statistical,
methods of analysis.
The purpose of this research is to diagnose the na-
ture and properties of the dynamics of sales of elec-
tric vehicles in the Chinese market using non-linear
analysis tools for further use in choosing a relevant
forecasting method.
3 MATERIALS
The object of analysis of this research is the sales vol-
umes of cars, which are contained in the reports of
the China Association of Automobile Manufacturers
(CAAM, 2022) and published by the online publica-
tion “Chinese Cars” (Chi, 2022).
An analysis of the structure of the electric vehicle
market in China revealed that in the period from Jan-
uary 2016 to June 2022, 37.5 per cent of the electric
vehicle market belongs to five automakers, namely:
BYD, Mercedes-Benz, Roewe, Geely, Chery. Most
of these companies are representatives of the Chinese
automotive industry, which is due, in particular, to
state support for manufacturers of this type of trans-
port (Qian et al., 2019). Let’s characterize these com-
panies in more detail.
BYD is the only automobile manufacturer that has
mastered batteries, electric motors, and vehicle con-
trol technologies. BYD was founded in 1995 as a pio-
neer in the battery technology industry. Its stated goal
is to change the world by creating a complete zero-
emission ecosystem that runs on clean energy and re-
duces dependence on oil. BYD’s innovative products
are leaders in many sectors, including battery electric
vehicles, buses, medium and heavy duty trucks and
forklifts. In 2003, the company entered the automo-
tive business, and in 2005, the first BYD brand au-
tomobile went on sale (BYD North America, 2022).
The company holds 16 per cent of the electric vehicle
market in China.
Mercedes-Benz is a world-famous automaker that
in recent years has been investing more resources in
its advanced research and design capabilities in China
as the new center of gravity for the auto industry (Shi-
rouzu, 2021). The company holds 9 per cent of the
electric vehicle market in China.
Roewe is owned by the Shanghai Automotive In-
dustry Corporation (SAIC) and is one of the few Chi-
nese luxury brands that actually manufacture mod-
ernized copies of older Rover models (Roewe, 2022).
The company holds 6 per cent of the electric vehicle
market in China.
Geely Auto Group is a leading automobile man-
ufacturer that was founded in 1997 as a subsidiary
of Zhejiang Geely Holding Group. For the past five
years, the company has maintained its position as the
best-selling Chinese brand (Geely, 2022). The com-
pany holds 4 per cent of the electric vehicle market in
China.
Chery was founded in 1997 under the patronage
of state-owned companies and holdings, as well as
smaller investors. In 2006, Ukraine was one of the
first countries to introduce the assembly of automo-
biles of this brand outside China. In 2012, in pursuit
of a globalization strategy, Chery and Jaguar Land
Rover Motors jointly invested in the establishment of
Chery Jaguar Land Rover Motors Co., Ltd., which
is China’s first Sino-British automobile joint venture
(Chery, 2022). The company holds 3 per cent of the
electric vehicle market in China.
Thus, we will analyze the nature of the dynamics
of the behavior of agents of the electric car market
in China on the basis of time series (TS) of monthly
sales volumes of automobile companies (manufactur-
ers) BYD, Chery, Geely, Mercedes-Benz and Roewe.
These automakers were selected based on the fact that
they are among the top 9 most popular electric mobile
brands in terms of sales for the period from January
2016 to June 2022 (Chi, 2022) and have sufficient
data for analysis for this period. When analyzing the
dynamics, we will identify the sales volumes of elec-
tric vehicles with the volume of demand for them.
Nonlinear Analysis of the Dynamics of Sales of Electric Automobiles in the Chinese Market
187

4 METHODOLOGY
To identify the nonlinear (chaotic) behavior of eco-
nomic data, various methods of time series analysis
are used (Faggini, 2014). In particular, tests for deter-
ministic chaos have been developed for this purpose,
which allow one to study the main features of chaotic
phenomena: nonlinearity, a fractal attractor, and sen-
sitivity to initial conditions.
In this research, to diagnose the nature and proper-
ties of the dynamics of sales of electric vehicles in the
Chinese market, we will use three tools for analyzing
nonlinear dynamics, namely: traditional R/S-analysis
– the Hurst normalized range method, phase analysis
and recurrence analysis.
For the purpose of a general assessment of the
fractal properties of time series, we use the Hurst nor-
malized range algorithm for analysis (Peters, 1994).
It is known that if the system gives the Hurst statistics
for a sufficiently long period, then this indicates the
result of interrelated events. As is known, a measure
of the mutual connection of events is the correlation
coefficient. The influence of the present on the future
can be represented by the following correlation:
C = 2
2H−1
− 1, (1)
where C – measure of correlation,
H – Hurst exponent.
The range of the Hurst exponent (H) is the interval
[0; 1]. The indicator value allows classifying all time
series into three groups:
1) H = 0,5;
2) 0 ≤ H < 0,5;
3) 0,5 < H ≤ 1.
The value H = 0,5 indicates a random time series:
the events are random and not correlated (C = 0 ac-
cording to (1)). The present does not affect the future.
If H ∈ (0,5; 1], then the considered time series is
persistent or trend-resistant and is characterized by
the effect of long-term memory. Events are the more
correlated, the closer the value is to 1 (correspond-
ingly, C also approaches 1 or 100 per cent correlation
according to (1)).
The value H ∈ [0; 0,5) corresponds to antipersis-
tent or ergodic time series. In a loose definition, an-
tipersistence means reverting to the mean or, in other
terminology, reversing (alternating positive and nega-
tive increments) more often than in a random process.
Thus, the Hurst exponent (H) is decisive in diagnos-
ing the nature of the development of a system or pro-
cess.
To check the validity of the results on the presence
of long-term memory based on the value of the Hurst
exponent (H), we will use a test for random mixing of
the levels of the time series.
Phase analysis is one of the effective methods for
obtaining information about the nature of the dynam-
ics of the system under consideration (Perepelitsa and
Maksyshko, 2012). To the time series (X = (x(t), t =
1, n)) that characterizes the dynamics of demand in
the market of electric vehicles, we will apply such
a presentation method, which can be used to return
from the observed state of the system to its previous
state. This “return” is implemented by the method of
time delays and is produced by constructing a phase
trajectory (phase portrait) of dimension ρ:
Φ
ρ
(X) =
(x(t), x(t + 1), ..., x(t + ρ − 1)), t = 1, n
,
(2)
which is a set of points called “ρ-history”. For any
time series, the list of all its M-histories determines
the corresponding set of points in the pseudo-phase
(or lag) space. In this case, when using the terms
“phase portrait” or “phase trajectory” it means that
the neighboring points of the set (2) are connected by
segments of a straight or curved line for clarity.
Thus, the graphic representation of the system on
the phase plane (or in the phase space), along the co-
ordinate axes of which the values of the variables of
the system (TS levels) are plotted, is called the phase
portrait of the system. The behavior of phase points in
time, which is described by the phase trajectory and
the set of such phase trajectories for any initial con-
ditions form a phase portrait. A phase portrait is a
mathematical method for representing the behavior of
a system and a geometric representation of individual
movements, and also displays the state of equilibrium,
periodic and chaotic movement of a phase point, the
logic of the system’s behavior and its dependence on
external and internal influences.
Objective information about the nature of the be-
havior of a dynamic process can be obtained by ob-
serving the time series X, based on the Takens theo-
rem (Takens, 1981): if the system generating the time
series is m-dimensional and inequality ρ ≥ 2m + 1 is
satisfied, then in the general case, phase trajectories
reflect the dynamics of the system under study. There
is a dipheomorphism between the phase trajectories
and the true data generated by the system. This result
allows one to draw conclusions about the behavior of
the system based on observational data, and, more-
over, to obtain information to predict this behavior.
Analysis of the phase portrait makes it possible to
determine the type and characteristic features of the
dynamics of a particular system. To deepen such an
analysis, Eckmann et al. (Eckmann et al., 1987) pro-
posed in 1987 a new diagnostic tool, the recurrence
plot.
M3E2 2022 - International Conference on Monitoring, Modeling Management of Emergent Economy
188

The recurrence plot is a projection of the ρ-
dimensional pseudo-phase space onto the surface. Let
point x
i
-correspond to the point of the phase trajec-
tory (2), which describes a dynamical system in m-
dimensional space at times t = i, for i = 1, ..., n. Then
the recurrence plot is an array of points, where non-
zero elements with coordinates (i, j) correspond to the
case when the distance between x
i
and x
j
is less then
γ:
RP
i, j
= θ
γ −
x
i
− x
j
,
x
i
, x
j
∈ R
m
, i, j = 1, ..., n,
(3)
where γ – size of the point x
i
,
x
i
− x
j
– distance between points,
θ(·) – Heaviside function.
For the practical reconstruction of the attractor for
a given time series, it is necessary to determine the
values of the parameters: ρ – the embedding dimen-
sion of the time series, d – the time lag of the time
series (Rotshtein and Katelnikov, 2014).
To determine the time lag of the time series, the
function (S) – the adjusted mutual information func-
tion (AMI) was used for the time series under re-
search, which takes into account non-linear correla-
tions (Hegger and Kantz, 1999):
S = −
∑
i j
p
i j
(Φ
ρ
(X)) · ln
p
i j
(Φ
ρ
(X))
p
i
p
j
, (4)
where p
i j
(Φ
ρ
(X)) – joint probability that an obser-
vation falls into the i-th interval and the observation
time d later falls into the j-th;
p
i
– the probability to find a time series value in
the i-th interval;
p
j
– the probability to find a time series value in
the j-th interval.
To calculate the optimal time lag of the time se-
ries (d), we will use the tseriesChaos library of the R
environment.
To determine the embedding dimension of the
time series, the false nearest neighbor method given
in (Kennel et al., 1992) was used. This method is
based on the assumption that at the next iterations the
neighboring points of the phase trajectory remain suf-
ficiently close. But if the nearest points move away
from one another, then they are called false nearest
neighbors. The task of the method is to choose such a
dimension of the time series (ρ), in which the propor-
tion of points that have false neighbors is minimized.
Based on the calculated parameters of the embed-
ding dimension and time lag, recurrence diagrams
of time series are built. The analysis of the statisti-
cal characteristics of the recurrence diagram makes
it possible to determine the measures of complexity
of the structure of the recurrence diagrams (Wallot,
2017):
• percent recurrence (%REC),
• percent determinism (%DET),
• average (ADL) and maximum (MDL) diagonal
lines lengths of the recurrence diagram.
The construction and determination of the statis-
tical characteristics of recurrence diagrams will be
implemented in the R environment using the tseri-
esChaos and nonlinearTseries libraries.
Based on the analysis of the statistical character-
istics of the recurrence diagram, it is possible to de-
termine the presence of homogeneous processes with
independent random values; processes with slowly
changing parameters; periodic and oscillating pro-
cesses that correspond to nonlinear systems. Thus, the
analysis of the recurrence surface makes it possible to
evaluate the characteristics of a non-linear object on
relatively short time series, which makes it possible
to make prompt decisions regarding the control of the
object.
5 RESULTS
The analysis of the behavior of Chinese electric auto-
mobiles market agents was carried out on the basis of
monthly sales data from January 2016 to June 2022
of five automobile companies (BYD, Chery, Geely,
Mercedes-Benz, Roewe) (figure 1).
Time series of sales of electric vehicles in the Chi-
nese market denoted by X
k
= (x(t), t = 1, n), k = 1, 5
where n is the length of the time series, k is the index
assigned to the corresponding manufacturer (in or-
der of priority): BYD, Chery, Geely, Mercedes-Benz,
Roewe.
Table 1 shows the results of the Hurst exponent
calculations (H) for these time series and the value of
the Hurst exponent (H
mixing
) obtained after applying
the mixing test.
Table 1: The value of the Hurst exponent for the series of
dynamics of sales volumes of electric automobiles of man-
ufacturing companies for the period from January 2016 to
June 2022.
Manufacturer (TS) H H
mixing
BYD (X
1
) 0,84655 0,56659
Chery (X
2
) 0,82696 0,58156
Geely (X
3
) 0,81668 0,57214
Mercedes-Benz (X
4
) 0,86762 0,54563
Roewe (X
5
) 0,87330 0,59666
According to table 1, we can conclude that all time
series of sales volumes (demand for electric automo-
biles) of all manufacturers have signs of persistence,
Nonlinear Analysis of the Dynamics of Sales of Electric Automobiles in the Chinese Market
189

Figure 1: Number of sales of electric vehicles in the Chinese market from January 2016 to June 2022.
that is, they have a long-term memory. This is evi-
denced by the following:
a) the value of the Hurst exponents for all time se-
ries are in the interval H ∈ [0, 817; 0,873], which
corresponds to the area of black noise;
b) the results of the mixing test
(H
mixing
∈ [0, 546; 0, 597]) confirm the signif-
icance of the time series structure: its violations
lead to the complete destruction of the trace of
long-term memory.
The presence of significant Hurst statistics for the
time series of sales of electric vehicles is explained by
the following reasoning.
The change in the volume of demand for electric
vehicles is based on an increase in the overall demand
for vehicles, the perception of buyers of a certain ex-
pediency to follow the trend in energy security (in-
creased charging stations), legislative incentives and
social responsibility (concern for the environment).
The demand for electric vehicles is partly determined
by fundamental information such as the state of the
energy market, public discussion of environmental is-
sues, current economic circumstances, expectations,
and so on. This information is often useful in mak-
ing decisions when purchasing a type of vehicle. Of
great importance in this belongs to the marketing ac-
tivities of manufacturing companies, the volume and
quality of their offers on the market. Another impor-
tant component of demand volumes is the extent to
which buyers are able to pay for a new and usually
more expensive product (an electric car). This “sen-
sory component” is also analyzed, and as a result, a
certain range of demand volume is formed around the
existing one. This combination of information and
thoughts results in displacement of volumes. If buy-
ers see that the trend is in line with their positive ex-
pectations for a particular electric vehicle, they start
buying like others. Yesterday’s activity has an im-
pact on today – the market remains mindful of yes-
terday’s trend. The bias will change when demand
reaches the upper limit of some actual value. At this
point, the offset will change. The interesting thing is
that the “range” of demand does not remain constant,
but changes. New information regarding a particular
electric vehicle (innovations and shortcomings) or the
market as a whole can change this range and cause a
sharp increase in sales volumes of the manufacturer
(in particular, the introduction of breakthrough inno-
vations) or a negative turn in the market situation, or
for an individual seller (in particular, in case of defi-
ciencies, and so on).
Let’s proceed to the consideration of the results
of the phase analysis of time series X
k
, k = 1, 5 of
M3E2 2022 - International Conference on Monitoring, Modeling Management of Emergent Economy
190

sales of electric vehicles in the Chinese market. Fig-
ure 2 shows phase portraits in a two-dimensional
pseudo-phase (lag) space Φ
2
(X
k
) =
{
(x(t), x(t + 1))
}
,
k = 1, 5.
A more detailed analysis of phase portraits makes
it possible to identify the following individual fea-
tures.
In the dynamics of sales of the automobile com-
pany BYD (Figure 2a)), at the beginning of the ob-
servation period for the first 5 years (from January
2016 to February 2021), almost stable quasi-cycles
of length 7 were observed, which indicates the pres-
ence of long-term memory in them (confirmed by the
value H ≈ 0,85). However, since February 2021, the
dynamics has changed dramatically in the direction
of increasing sales volumes and almost no cyclicity
when moving along the bisector of the coordinate an-
gle. This indicates an increase in the memory depth
of the time series.
The dynamics of sales of automobile companies
Chery and Gelly (Figure 2b), c)) are characterized
by shorter quasi-cycles (length 4 or 5), and there is
an increase in the amplitude of these quasi-cycles
in the final interval of the time series (from Febru-
ary 2021 to June 2022), but no significant movement
along the bisector of the coordinate angle is observed.
The dynamics is characterized by less trend resis-
tance, which is confirmed by the values H ≈ 0,83)
and H ≈ 0,82) for the respective manufacturers.
The dynamics of sales of automobile companies
Mercedes-Benz and Roewe (Figure 2d), e)) is char-
acterized by the presence of the longest quasi-cycles
(length 9), their slow movement along the bisector of
the coordinate angle (increase in volumes) and an in-
crease in amplitude. This is evidence that the dynam-
ics of sales volumes of these manufacturers is charac-
terized by the greatest trend resistance (confirmed by
the value of the Hurst exponent H ≈ 0,87) for both
companies).
Thus, the analysis of phase portraits Φ
2
(X
k
) in a
two-dimensional pseudo-phase (lag) space makes it
possible to identify the characteristic features of the
dynamics of sales volumes of each agent in the Chi-
nese electric car market.
At the first stage, using the tseriesChaos library
of the R environment, the values of the embedding
dimension (ρ) and the time lag (d) of the considered
time series were calculated (table 2).
At the second stage, using the tseriesChaos and
nonlinearTseries libraries in the R environment, re-
currence plots were constructed (figure 3a)-f)) and
their statistical characteristics were determined (ta-
ble 3).
The topology of the recurrence plots for electric
Table 2: The value of the embedding dimension (ρ) and
time lag (d) for the series of dynamics of sales volumes
of electric automobiles of manufacturing companies for the
period from January 2016 to June 2022.
Manufacturer (TS)
The embedding
dimension (ρ)
The time
lag (d)
BYD (X
1
) 5 9
Chery (X
2
) 4 3
Geely (X
3
) 4 3
Mercedes-Benz (X
4
) 4 1
Roewe (X
5
) 6 2
Table 3: Statistical characteristics of recurrence plots of
electric automobiles sales in China from January 2016 to
June 2022.
Manufacturer (TS) %REC %DET ADL MDL
BYD (X
1
) 2,381 100 0 42
Chery (X
2
) 1,429 100 0 70
Geely (X
3
) 1,429 100 0 70
Mercedes-Benz (X
4
) 1,333 100 0 75
Roewe (X
5
) 1,471 100 0 68
automobiles sales in China shows abrupt changes in
the dynamics of the system that generates the time se-
ries and causes white areas or bands to appear. On
the recurrence plots, there is a gradual change in the
parameters of the behavior of the agents of the auto-
mobile market, and there is also a drift of the attrac-
tor (white lower and upper corners of the diagram,
crosses). The absence of short diagonal stripes on the
recurrence plots indicates the absence of a stochas-
tic process and the non-return of the trajectory to the
same region of the phase space in different time peri-
ods.
The determinism of the behavior of companies in
the automobile market is confirmed by the calculated
statistical characteristics of recurrence plots, which
are shown in table 3.
The value of the %REC indicator for all time se-
ries falls within the interval from 1% to 5%, which
indicates the regular behavior of the time series.
The measure of determinism (%DET) of the re-
currence plot characterizes the level of system pre-
dictability. Diagonal structures show the time during
which a segment of the trajectory comes very close to
another segment of the trajectory. For all five recur-
rence plots, the level of predictability is 100%. Note
that this measure does not determine the real deter-
minism of the process.
The average diagonal lines lengths (ADL) char-
acterizes the average time during which two sections
of the trajectory pass close to each other, and can be
considered as the average predictability time of the
system. An interesting fact is that, according to the
Nonlinear Analysis of the Dynamics of Sales of Electric Automobiles in the Chinese Market
191

(a)
(b)
(c)
(d)
(e)
Figure 2: Phase portraits in a two-dimensional pseudo-phase space Φ
2
(X
k
) =
{
(x(t), x(t + 1))
}
, k = 1, 5 for time series
X
k
, k = 1, 5 from January 2016 to June 2022: a) BYD, b) Chery, c) Gelly, d) Mercedes-Benz, e) Roewe.
calculation results, the smallest average predictability
time of time series is 0.
The maximum diagonal lines lengths (MDL) char-
acterizes the length of the trend. The shortest trend is
in the BYD time series (42 points), and the longest is
in Mercedes-Benz (75 points).
6 CONCLUSION
The research analyzes the nature and properties of the
dynamics of sales of electric automobiles in the Chi-
nese market using non-linear analysis tools.
The initial data for the analysis is the time series
M3E2 2022 - International Conference on Monitoring, Modeling Management of Emergent Economy
192
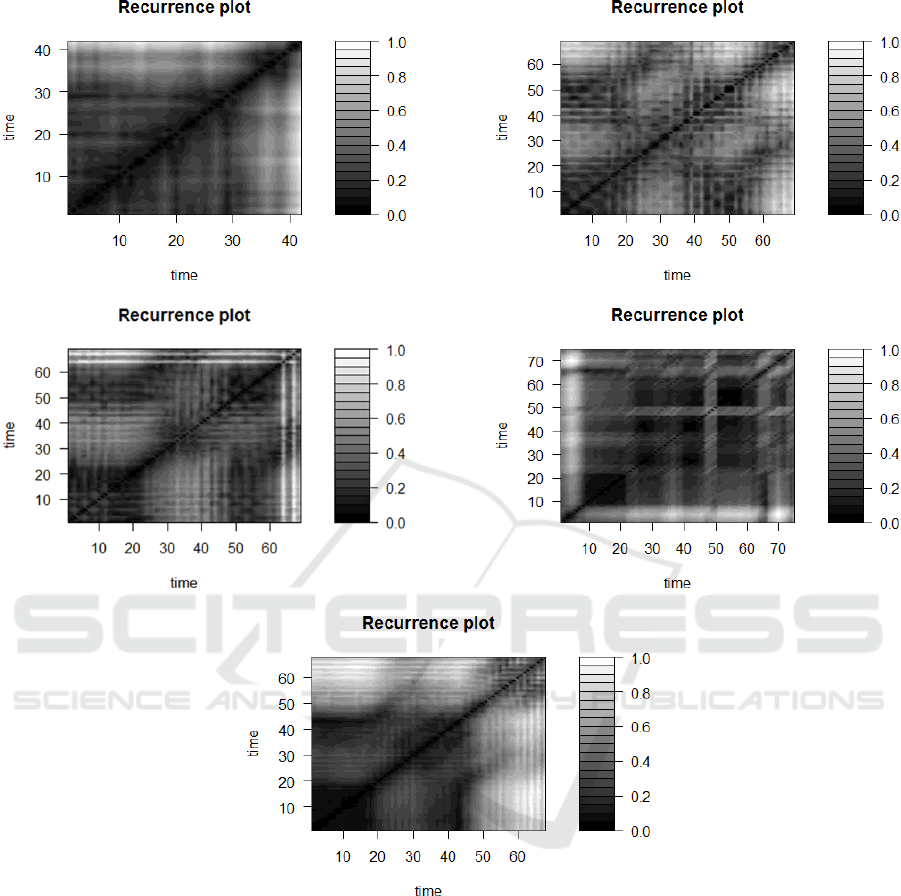
(a) (b)
(c)
(d)
(e)
Figure 3: Recurrence plots of electric automobiles sales in China from January 2016 to June 2022: a) BYD, b) Chery, c)
Gelly, d) Mercedes-Benz, e) Roewe.
of monthly sales volumes from January 2016 to June
2022 of five automobile companies: BYD, Chery,
Geely, Mercedes-Benz and Roewe.
For the research, three methods of nonlinear dy-
namics were used, namely: traditional R/S-analysis –
the method of normalized Hurst range, phase analysis
and the method of recurrence plots.
As a result of applying the Hurst normalized range
method, the property of trend stability of time series
was revealed, which indicates the presence of long-
term memory in them. Therefore, we can conclude
that the time series of sales of electric automobiles in
the Chinese market have a non-linear (fractal) nature.
It follows that the use of forecasting methods based on
the classical approach is not adequate and may lead to
an unsatisfactory forecasting result. When choosing
a method for predicting sales of electric automobiles
and their parameters, it is necessary to take into ac-
count the presence of long-term memory and, prefer-
ably, its characteristics.
However, fractal analysis, which is based on the
use of the Hurst normalized range method, allows
Nonlinear Analysis of the Dynamics of Sales of Electric Automobiles in the Chinese Market
193

only qualitative conclusions to be drawn regarding the
properties of the electric vehicle market as a whole, as
well as the properties of the trend stability of each of
the time series that were considered. The quantitative
characteristics obtained by this method are averaged
over the entire series. Therefore, to obtain differen-
tiated characteristics of the identified memory, it is
promising to research these time series using fractal
analysis methods, which are based on the sequential
R/S analysis algorithm (Perepelitsa and Maksyshko,
2012).
The use of phase analysis in a two-dimensional
phase spase made it possible to identify the pres-
ence or absence of cyclicity in dynamics at some time
intervals, to evaluate the characteristics of attractors
(quasi-cycles) and their features for each agent in the
Chinese electric automobiles market. The results ob-
tained are the basis for further research in the direc-
tion of a more detailed research of the identified fea-
tures in the dynamics due to decomposition the phase
portrait into quasicycles, determining their character-
istics, analyzing the dynamics of the overall dimen-
sions of quasicycles and their centers of attraction.
The construction of recurrence plots in ρ-
dimensional phase spase and their topological anal-
ysis made it possible to confirm the presence of at-
tractor drift for all agents in the Chinese electric auto-
mobiles market. A gradual change in the parameters
of the behavior of agents was also revealed.
Quantitative analysis of recurrence plots based
on the calculation of measures of complexity of
their structure (in particular, the percent recurrence
(%REC) and the percent determinism (%DET) also
made it possible to confirm the fractal (deterministic)
nature of the nature of the dynamics of sales of elec-
tric vehicles in the Chinese market. It should be noted
that at the moment the input data of the research are
characterized by a short time series. This, obviously,
affects both the possibilities, and the features, and the
results of using the applied methods. However, their
application – each separately and in combination –
provides an opportunity to gain new knowledge about
the characteristics of the dynamics in a new market
that is rapidly developing and has prospects in the
global economy – the market for electric vehicles.
The results of the research can be used to select
relevant forecasting methods and their parameters.
REFERENCES
(2022). Car Sales in China. https://www.chinamobil.ru/eng/
sales/sales.
BYD North America (2022). Bus: BYD Motors - BYD
USA. https://en.byd.com/bus/bus-byd-motors.
CAAM (2022). China Association of Automobile Manu-
facturers (CAAM). http://en.caam.org.cn/.
Chery (2022). Introduction. https://www.
cheryinternational.com/pc/aboutchery/introduction/.
Derbentsev, V., Velykoivanenko, H., and Datsenko, N.
(2019). Machine learning approach for fore-
casting cryptocurrencies time series. Neiro-
Nechitki Tekhnolohii Modelyuvannya v Ekonomitsi,
2019(8):65–93.
Dhakal, T. and Min, K.-S. (2021). Macro Study of
Global Electric Vehicle Expansion. Foresight and STI
Governance, 15(1):67–73. https://doi.org/10.17323/
2500-2597.2021.1.67.73.
Dingab, S. and Li, R. (2021). Forecasting the sales and
stock of electric vehicles using a novel self-adaptive
optimized grey model. Engineering Applications of
Artificial Intelligence, 100:104148. https://doi.org/10.
1016/j.engappai.2020.104148.
Eckmann, J.-P., Kamphorst, S. O., and Ruelle, D. (1987).
Recurrence Plots of Dynamical Systems. Euro-
physics Letters, 4(9):973–977. https://doi.org/10.
1209/0295-5075/4/9/004.
Ensslen, A., Will, C., and Jochem, P. (2019). Simulating
Electric Vehicle Diffusion and Charging Activities in
France and Germany. World Electr. Veh. J., 10(4):73.
https://doi.org/10.3390/wevj10040073.
Faggini, M. (2014). Chaotic time series analysis in
economics: Balance and perspectives. Chaos:
An Interdisciplinary Journal of Nonlinear Science,
24(4):042101. https://doi.org/10.1063/1.4903797.
Geely (2022). Overview : Geely Global. http://global.geely.
com/overview.
Hegger, R. and Kantz, H. (1999). Practical implementation
of nonlinear time series methods: The TISEAN pack-
age. Chaos: An Interdisciplinary Journal of Nonlin-
ear Science, 9(2):413–435. https://doi.org/10.1063/1.
166424.
Jin, L. and He, H. (2019). Comparison of the electric car
market in China and the United States. Working paper
2019-10, International Council on Clean Transporta-
tion. https://theicct.org/wp-content/uploads/2021/06/
ICCT
US-China EV-mkt-comp 20190523.pdf.
Jochem, P., J., J., Vilchez, G., Ensslen, A., Sch
¨
auble, J.,
and Fichtner, W. (2018). Methods for forecasting the
market penetration of electric drivetrains in the pas-
senger car market. Transport Reviews, 38(3):322–348.
https://doi.org/10.1080/01441647.2017.1326538.
Kennel, M. B., Brown, R., and Abarbanel, H. D. I.
(1992). Determining embedding dimension for phase-
space reconstruction using a geometrical construction.
Phys. Rev. A, 45(6):3403. https://doi.org/10.1103/
PhysRevA.45.3403.
Kmytiuk, T. and Majore, G. (2021). Time series forecasting
of agricultural product prices using Elman and Jordan
recurrent neural networks. Neiro-Nechitki Tekhnolohii
Modelyuvannya v Ekonomitsi, 2021(10):67–85.
Maksyshko, N., Vasylieva, O., Kozin, I., and Perepelitsa,
V. (2020). Comparative analysis of the attractive-
M3E2 2022 - International Conference on Monitoring, Modeling Management of Emergent Economy
194

ness of investment instruments based on the analysis
of market dynamics. In Kiv, A., editor, Proceedings
of the Selected Papers of the Special Edition of In-
ternational Conference on Monitoring, Modeling &
Management of Emergent Economy (M3E2-MLPEED
2020), Odessa, Ukraine, July 13-18, 2020, volume
2713 of CEUR Workshop Proceedings, pages 219–
238. CEUR-WS.org. http://ceur-ws.org/Vol-2713/
paper18.pdf.
McKerracher, C. and Wagner, S. (2021). At Least Two-
Thirds of Global Car Sales Will Be Electric by 2040.
https://cutt.ly/vVTyg5R.
Paoli, L., Dasgupta, A., and McBain, S. (2022). Electric ve-
hicles. Tracking report, International Energy Agency.
https://www.iea.org/reports/electric-vehicles.
Perepelitsa, V. and Maksyshko, N. (2012). Analiz i
prognozirovanie evolyuczii ekonomicheskikh sistem:
problemy strukturirovaniya dannykh v usloviyakh
neopredelennosti i predprognoznogo analiza [Analy-
sis and forecasting of the economic systems evolution:
problems of data structuring in conditions of uncer-
tainty and pre-forecast analysis]. Lambert Academic
Publishing.
Peters, E. E. (1994). Fractal Market Analysis: Applying
Chaos Theory to Investment and Analysis. John Wiley
& Sons, Inc.
Qian, L., Grisol
´
ıa, J. M., and Soopramanien, D. (2019). The
impact of service and government-policy attributes on
consumer preferences for electric vehicles in China.
Transportation Research Part A: Policy and Practice,
122:70–84. https://doi.org/10.1016/j.tra.2019.02.008.
Rietmann, N., H
¨
ugler, B., and Lieven, T. (2020). Forecast-
ing the trajectory of electric vehicle sales and the con-
sequences for worldwide CO2 emissions. Journal of
Cleaner Production, 261:121038. https://doi.org/10.
1016/j.jclepro.2020.121038.
Roewe (2022). Roewe Brand - SAIC Roewe official web-
site. https://www.roewe.com.cn/about-us.
Rotshtein, A. P. and Katelnikov, D. I. (2014). Fuzzy-chaotic
time series prediction. Optoelectronic information-
power technologies, 27(1):42–55. https://oeipt.vntu.
edu.ua/index.php/oeipt/article/view/332.
Shirouzu, N. (2021). Home from home: Mercedes-
Benz doubles down on China. https://tinyurl.com/
mvkksnn6.
Takens, F. (1981). Detecting strange attractors in turbu-
lence. Dynamical systems and turbulence, 898:366–
382. https://doi.org/10.1007/BFb0091924.
Wallot, S. (2017). Recurrence Quantification Analysis of
Processes and Products of Discourse: A Tutorial in
R. Discourse Processes, 54(5-6):382–405. https://doi.
org/10.1080/0163853X.2017.1297921.
Wan, J. P., Xie, L. Q., and Hu, X. F. (2021). Study on the
electric vehicle sales forecast with TEI@I methodol-
ogy. International Journal of Knowledge Engineer-
ing and Data Mining, 7(1-2):1–38. https://doi.org/10.
1504/IJKEDM.2021.119836.
Zhang, L., Zhao, Z., Xin, H., Chai, J., and Wang, G. (2018).
Charge pricing model for electric vehicle charging
infrastructure public-private partnership projects in
China: A system dynamics analysis. Journal of
Cleaner Production, 199:321–333. https://doi.org/10.
1016/j.jclepro.2018.07.169.
Zhang, Y., Zhong, M., Geng, N., and Jiang, Y. (2017).
Forecasting electric vehicles sales with univariate and
multivariate time series models: The case of China.
PLOS ONE, 12(5):e0176729. https://doi.org/10.1371/
journal.pone.0176729.
Zhu, Z. and Du, H. (2018). Forecasting the Number of
Electric Vehicles: A Case of Beijing. IOP Con-
ference Series: Earth and Environmental Science,
170(4):042037. https://doi.org/10.1088/1755-1315/
170/4/042037.
Nonlinear Analysis of the Dynamics of Sales of Electric Automobiles in the Chinese Market
195
