
Development Trend and Prospect of Personal Return Rate of
Vocational Education in China
Lijia Zhang
a
Department of Education, Moscow State University, Moscow, 119991, Russia
Keywords: Return to education, Mincer rate of return, Employment.
Abstrsct: Vocational education is one of the important ways to form human capital, and human capital is an important
factor of economic growth. Based on the data provided by CFPS, this paper uses the Mincer rate of return to
empirically analyze the development of personal rate of return of vocational education in China from 2014 to
2020. The results show that the personal rate of return of vocational education is on the rise year by year,
however, exacerbating the gap between the rich and the poor between regions and the unhealthy employment
future of vocational education educated groups are still problems that need to be solved urgently.
1 INTRODUCTION
Vocational education is regarded as an important part
of the national education system and human resources
development. It shoulders the important
responsibility of cultivating diversified talents,
inheriting technical skills and promoting employment
and entrepreneurship.
Since the 1960 s, research on the rate of return to
education has been endless. Economist Jacob in 1974.
Mincer 's income function derived from human
capital theory has become the research method of
most scholars. Regarding the research on the field of
returns to education in China, Li Shi and Ding Sai
found that the impact of education on income is
directly and positively correlated through the sample
survey data from 1990 to 1999 in ' the long-term trend
of returns to education in urban China '(Li, Ding
2003); gao Xiaochun further drew a new conclusion
in " Re-examining the Impact of Education on Income
Growth and Distribution " : Although the rate of
return to education in China showed a significant
growth trend from 1988 to 2002, the income gap
among people with different educational backgrounds
also widened. In addition, Zhou Yunbo and Yu
Yongze pointed out in the ' Main Factors Affecting
the Income Gap of Urban Residents in China ' that the
level of regional economic development, the level of
education of residents, the employment industry, the
a
https://orcid.org/0000-0002-7406-1426
nature of employment units and personal occupations
are the main factors affecting the income gap
between urban residents. It can be seen that although
the economic benefits brought by China 's education
are fruitful, the gap between the rich and the poor
caused by different academic qualifications is
expanding. The scale of vocational education is
comparable to that of general education and higher
education. As the main source of education for
people in rural and remote areas in China, it is of
great significance to study and analyze the current
situation of vocational education in China in recent
years (Xu 2014).
On October 12,2021, the General Office of the
State Council issued the " Opinions on Promoting the
High-quality Development of Modern Vocational
Education, " emphasizing: " We should strengthen
the characteristics of vocational education types,
improve the school-running system of industry-
education integration, innovate the school-enterprise
cooperation mechanism, deepen the reform of
education and teaching, and build a vocational
education brand with Chinese characteristics. By
2025, the characteristics of vocational education
types will be more distinct, the modern vocational
education system will be basically completed, and
the construction of a skilled society will be
comprehensively promoted.” (Xinhua News Agency
2021) Obviously, the economic benefits of
vocational education are self-evident, and it is of
506
Zhang, L.
Development Trend and Prospect of Personal Return Rate of Vocational Education in China.
DOI: 10.5220/0011914500003613
In Proceedings of the 2nd International Conference on New Media Development and Modernized Education (NMDME 2022), pages 506-512
ISBN: 978-989-758-630-9
Copyright
c
2023 by SCITEPRESS – Science and Technology Publications, Lda. Under CC license (CC BY-NC-ND 4.0)

great significance to explore the rate of return brought
by vocational education investment.
This paper will use the data of 2014,2016,2018
and 2020 provided by China Family Panel Studies
(CFPS) to conduct an empirical study on the
individual return rate of vocational education in
China. Through horizontal and vertical comparison,
this paper examines the current situation of education
return rate in China in the past ten years and provides
suggestions for the future development of vocational
education.
2 RESEARCH METHOD
2.1 The Calculation Method of the Rate
of Return to Education
This paper uses the Mincerian earnings function to
calculate returns on education. The Mincer income
function method is an estimation method proposed by
the American economist Mincer J in the 1970 s. The
rate of return on education estimated by this method
is called the Mincer yield. Its basic formula is :
Iny = a + bS + cEX + dEX ² + u (1)
Among them, y represents annual income, S
represents years of education, EX represents the labor
market experience, and the quadratic term of EX is
used to describe the nonlinear relationship between
labor market experience and income. A represents the
intercept, b, c, d represent the regression coefficients
of the variables, u is the random error term, where b
is the individual rate of return on education.
2.2 Data Source
The data of this paper comes from China Family
Panel Studies (CFPS), which is updated every two
years. In view of the availability of data and the
complexity of data processing, this paper selects data
from 2014 to 2020 as samples for analysis.
The data processing rules of this paper are as
follows : ( 1 ) The annual income unit is yuan, and
the magnitude is large. In order to prevent
heteroscedasticity, the annual income is
logarithmically processed, and the logarithm of the
annual income is used as a measure of the income
level. Secondly, there is no direct working life index
in the CFPS database, so the calculation of working
years is : questionnaire year-start working time ; ( 2 )
Deleting samples with missing indicator data. There
are three core variables in this paper : annual income,
years of education, and working hours. ( 3 ) delete
the abnormal data, data processing found that part of
the working life of more than 100 years, because the
data from the questionnaire, so this part of the data is
considered invalid questionnaire, delete processing ;
( 4 ) The data with annual income less than 1000 are
deleted. If the annual income is less than 1000, it is
either a questionnaire quality problem or an income
unit error. There is no way to verify the unit error and
no way to correct it one by one. ( 5 ) Due to the
existence of the maximum and minimum values that
deviate significantly from the data distribution, the
extreme values of this part will affect the accuracy of
the model. In order to avoid the influence of extreme
values on the regression results of the model, the first
1 % and the last 1 % of the indicator data are
winsorized.
The original data is cleaned and analyzed to form
a new index system, and the final modeling data
index is obtained. The data processing and data
analysis are completed by stata16.0.
Variable description is shown in Table 1.
Table 1: Variable description
Types of variables Variable names Variable symbols Variable definitions
Explained variables Income In income Logarithm of annual income
Explanatory variables
Years of education edu Current maximum years of education
Work seniority workl Year of questionnaire-year of starting work
Square of working years workl2 Square of working years
Development Trend and Prospect of Personal Return Rate of Vocational Education in China
507

3 DATA PROCESSING AND
ANALYSIS
3.1 Variable Description Statistics
Before the analysis and modeling, descriptive
statistics are carried out on the variables of the study
to grasp the overall macro situation of the variables.
The descriptive statistical results are shown in Table
2:
Table 2: Variable Description Statistics
Va ri ab le
s
sampl
e size
mean
value
standard
deviatio
n
minimu
m value
maximu
m value
Income
19,31
2
3.365 2.932 0.150 17.400
Years of
educatio
n
19,31
2
10.25
6
4.095 0.000 18
Work
seniority
19,31
2
3.426 5.069 0.000 31
It can be seen from Table 2 that there are 19312
remaining samples after data cleaning, of which the
average income is CNY 3365 million, the minimum
value is 0.150, and the maximum value is 17.4. The
difference between the maximum value and the
minimum value is large, indicating that there is a
level between different individuals. Similarly, there
are great differences in the years of education and
working years of different individuals.
In order to understand whether there are
differences in income, education level and working
years between different years, the above three
variables are described and counted according to
different years. The results are shown in Table 3.
Table 3: PVariable description statistics by year
Variables
Year 2014 Year 2016 Year 2018 Year 2020
Mean
value
Standard
deviation
Mean
value
Standard
deviation
Mean
value
Standard
deviation
Mean
value
Standard
deviation
Income( ten
thousand
y
uan
)
2.711 2.278 3.263 2.828 3.618 3.013 4.195 3.546
Years of
education
(
y
ears
)
9.949 3.997 10.316 4.119 10.203 4.147 10.727 4.112
Work
seniority( years )
4.763 6.521 2.505 3.548 2.849 4.310 3.117 4.378
As can be seen from Table 3, from 2014 to 2020,
the average income and the number of years of
education have been increasing, indicating that over
time, the income level of residents has steadily
increased, the society has paid more and more
attention to education, and more people have the
ability to invest more time and money in education.
At the same time, from 2014 to 2018, the standard
deviation of income also increased year by year,
indicating that the income of residents increased at the
same time, the gap between rich and poor is also
increasing. According to the data of the National
Bureau of Statistics, the proportion of rural students
in higher vocational colleges ( 51 % in 2017 ) is
significantly higher than that of undergraduates
( 42 % in 2017 ). The monthly income of rural
graduates in 2014 is 2117 yuan after half a year, which
is slightly higher than that of migrant workers in the
same period ( 2864 yuan ). After 3 years of
graduation, the income advantage was significantly
expanded, ( that is, in 2017 ) the monthly income of
5552 yuan, significantly higher than the same period
of migrant workers ( 2017 average monthly income
of 3485 yuan ).(
Wang, Ma 2020)This shows that
higher vocational education has a significant role in
promoting rural poverty alleviation. The widening
gap between the rich and the poor from 2014 to 2018
shows that the impact of vocational education on the
poverty alleviation effect of rural students is still not
significant enough, and the society needs to pay more
attention to the development of vocational education
graduates ' workplace. However, it is worth
mentioning that the standard deviation of income in
2020 has declined compared with 2018.This may be
due to the huge impact of the epidemic in 2020 on the
job hunting of undergraduate graduates and
vocational education graduates, which is not directly
related to the economic benefits brought by
vocational education itself.
Overall, the number of years of education is also
increasing, with the improvement of people 's living
NMDME 2022 - The International Conference on New Media Development and Modernized Education
508

standards, the importance of education is gradually
increasing, so the overall level of education in society
is steadily improving. From the working years, the
overall social working years have a downward trend,
due to the increase in the number of years of
education, more and more young people into the work
time delay, so this is normal.
According to the economic belt, the whole country
is divided into : eastern region, central region and
western region. The economic development of the
three regions is from strong to weak. In order to
understand the differences of the three variables in
different economic belts, the descriptive statistics
based on the economic belt are carried out. The
results are shown in table 4.
Table 4: Variable description statistics by region
Variables
Eastern region Central region Western region
Mean
value
Standard
deviation
Mean
value
Standard
deviation
Mean
value
Standard
deviation
Income ( ten thousand
yuan )
3.737 3.256 3.018 2.535 2.922 2.433
Years of education
( years )
10.555 3.989 10.271 3.936 9.634 4.378
Work seniority ( years )
3.464 5.022 3.455 5.191 3.312 5.024
As can be seen from Table 5, the annual income of
the eastern region is greater than the central region is
greater than the western region, indicating that the
more economically developed regions, the higher the
income level, the same gap between the rich and the
poor is also greater ; years of education and years of
work are the same, the eastern region is greater than
the central region is greater than the western region.
3.2 Correlation Analysis
To understand the correlation between the variables
and the explained variables, Pearson correlation test
is needed. The test results are detailed in table 5 :
Table 5: Pearson correlation test of variables
lnincome edu workl workl2
lnincome 1
edu 0.261*** 1
workl 0.110*** 0.007 1
workl2 0.052*** -0.013* 0.946*** 1
Note : * * *, * *, * indicates significant at 1 %, 5 %, 10 %
respectively
It can be seen from Table 7 that the years of
education ( edu ) and income ( lnincome ) are
significantly positively correlated at the level of 1 %,
and the correlation coefficient is 0.261, which reflects
that the investment in vocational education has a
significant positive impact on personal income. The
working hours ( workl ) and income ( lnincome ) are
significantly positively correlated at the 1 % level,
and the correlation coefficient is 0.110 ; the square
term of working hours ( workl2 ) is significantly
positively correlated with income ( lnincome ) at the
level of 1 %, and the correlation coefficient is 0.052.
3.3 Regression Analysis
Based on the conclusions of the above data analysis,
the benchmark regression analysis is performed on
all variables :
Table 6: Benchmark regression analysis
Variables
lnincome
edu 0.060***
(0.002)
workl 0.102***
(0.004)
workl2 -0.003***
(0.000)
Constant 9.206***
(0.020)
Observations 19312
R-squared 0.101
Note : * * *, * *, * indicates significant at 1 %, 5 %, 10 %
respectively, standard error in parentheses
From table 3, we can see that the regression
coefficient of edu is 0.060, and it is significant at the
significant level of 1 %, indicating that the years of
education have a significant positive impact on the
current income. The specific performance is that for
Development Trend and Prospect of Personal Return Rate of Vocational Education in China
509
every additional unit of years of education, the annual
income will increase by 0.06 units accordingly, that
is, the Mincer yield of the total sample is 0.06 ; the
regression coefficient of workl is significantly
positive at the level of 1 %, and the regression
coefficient of workl2 is significantly negative at the
level of 1 %, indicating that there is an ' inverted U '
relationship between working years and income, that
is, the annual income increases with the increase of
working years, and when the working years reach a
certain value, the income decreases with the increase
of working years. This phenomenon may be related to
the type of work unit and employment industry of
vocational education graduates.
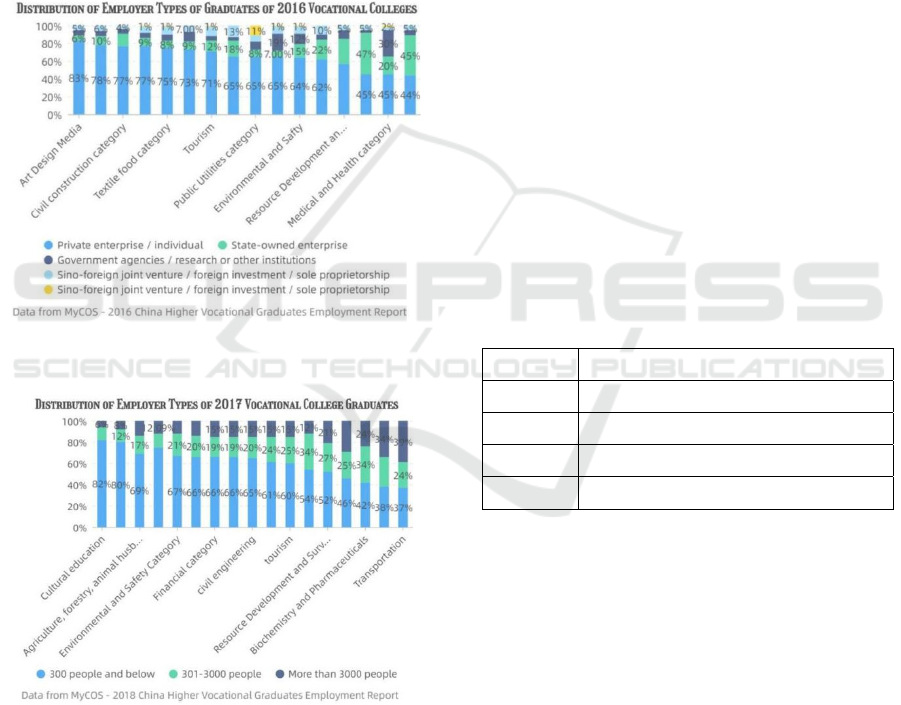
Figure 1: Distribution of employer types of graduates of
2016 Vocational colleges
Figure 2: Distribution of emplyer types of 2017 vocational
college graduates
From Figure 1, it can be seen that the main
employment destinations of vocational education
graduates are private enterprises or self-employed
enterprises. The main characteristics of such
employers are : 1.Inborn deficiency and difficulty in
development. 2.Financing difficulties 3. Management
confusion 4.Insufficient training of talents. Such a
working environment makes it impossible for
vocational education graduates to achieve long-term
development in a fixed employer, and their working
ability cannot be improved. In addition, combined
with Figure 1 and Figure 2, it is not difficult to see
that the educated groups of vocational education are
mainly engaged in the primary and secondary
industries such as resource development, material
energy, manufacturing, or the tertiary industry of
transportation (Wang, Zhou 2018). The
characteristics of this industry are : high physical
labor, intellectual activity requirements small ; strong
substitutability ; strong instability ; high risk. This
also leads to the working income of the working
group with the increase of working age, after the peak
will decline.
3.4 Mincer Yield Comparison Based
on Different Years
In order to show the development trend of the Mincer
yield rate of China's vocational education from 2014
to 2020, the data are compared from both horizontal
and vertical aspects. The following is the comparison
results of the Mincer yield rate based on different
years :
Table 7: Mincer yield comparison based on different years
Years Mincerian rate of return
2014 0.048***
2016 0.057***
2018 0.060***
2020 0.068***
Note : * * *, * *, * indicates significant at 1 %, 5 %, 10 %
respectively
As can be seen from Table 7, the Mincer yield in
each year is significant at the 1 % level, from the
numerical point of view, the Mincer yield increased
year by year. This shows that since the 21 st century,
the field of vocational education in China has created
a great situation of reform and practice, fully serving
the development of economy, society and people, and
the development of socialist vocational education
with Chinese characteristics has made brilliant
achievements.
3.5 Mincer Yield Comparison Based
on Different Regions
The following is a comparison of Mincer yields
based on different regions :
NMDME 2022 - The International Conference on New Media Development and Modernized Education
510

Table 8: Comparison of Mincer yields based on different
regions
Regions Mincerian rate of return
Eastern region 0.070***
Central region 0.049***
Western region 0.047***
Note : * * *, * *, * indicates significant at 1 %, 5 %, 10 %
respectively
From Table 8, it can be seen that the Mincer yield
rate in each region is significant at the significant
level of 1 %. From the numerical point of view, the
Mincer yield rate in the eastern region is higher than
that in the central region and higher than that in the
western region, that is, the Mincer yield rate in the
economically developed regions is higher than that in
the economically underdeveloped regions. This may
be due to the factors of many employment
opportunities, large demand for talents, perfect
infrastructure construction, good welfare treatment
and high salary in developed areas. Even in 2020,
when the whole country is seriously affected by the
epidemic and industries in various regions are hit to
varying degrees, developed regions also have stronger
economic capital to promote economic recovery,
minimize the resumption of work time, and thus
reduce economic losses.
4 CONCLUSIONS AND
RECOMMENDATIONS
4.1 Conclusion
Generally speaking, in recent years, the personal
economic benefits brought by China 's vocational
education have shown a gratifying growth trend, but
through horizontal and vertical analysis and research,
we can still find some problems in the development
of socialist vocational education with Chinese
characteristics. Firstly, the development of vocational
education fails to conform to the goal of " common
prosperity " of socialism, and the influence of
vocational education on students in underdeveloped
areas and rural areas needs to be further improved.
Secondly, the graduates trained by vocational
education cannot achieve long-term economic
benefits after employment, which may be related to
the insufficient skill level of vocational education
graduates, the unbalanced distribution of human
resources in the market, and the insufficient
investment of the state in private enterprises and
vocational education.
4.2 Recommendations
(1)To optimize the shortcomings of vocational
education development mechanism. Strengthen the
cooperation between schools and markets, establish
a sound institutional guarantee, and eliminate the
current phenomenon of some school-enterprise
cooperation and relying on " human maintenance. "
Continuously promote and improve the construction
of vocational education system, so as to better cope
with new contradictions and new problems with the
development of the times and social changes(
Li
2019).
(2)To build a modern vocational education
system which can adapt to the current social needs
and the development of productive forces. At present,
the shortage of teachers in higher vocational colleges
is serious, and some professional teachers in
secondary vocational schools are seriously
insufficient. In addition, the lack of direct access
between secondary and higher vocational education,
and the lack of synchronization between vocational
education and general education are also the
shortcomings of vocational education itself.
However, it is gratifying that on February 23,2022,
the press conference held by the Ministry of
Education mentioned three major changes in the
relevant situation of promoting the high-quality
development of modern vocational education : the
orientation of secondary vocational education has
changed from employment-oriented to both
employment and further education ; ' Vocational
college entrance examination ' will become the main
channel of higher vocational enrollment ; further
expand vocational undergraduate education. This
means that the change of national orientation of
vocational education is likely to fundamentally solve
the problem of vocational education graduates
working conditions, so that the educated groups in
the market to obtain more favorable competitiveness
and longer-term economic guarantee.
(3)To strengthen the protection of vocational
education funding. At present, the total amount of
financial investment in China 's vocational education
is insufficient, which is significantly lower than that
of ordinary education at the same level, but its scale
is comparable to that of high school education and
higher education at the same level. Therefore,
ensuring sufficient funds for vocational education is
the basis for adhering to education development. It is
necessary to update and improve the training
equipment needed for vocational education, improve
the financial allocation system, and adopt different
allocation standards between urban and rural areas
Development Trend and Prospect of Personal Return Rate of Vocational Education in China
511

and between different regions according to different
levels of economic development, so as to promote the
modernization of vocational education (
Guangming
daily 2022).
REFERENCES
Education. In: Ping, Z, Fang, L, Aifang, C, Bo, X,
Mingyuan, Y. (Eds) The comparison and development
trend of Chinese and Russian education in the 21st
Century. Jiangsu Phoenix Education Publishing House.
Nanjing. pp303-304.
Guangming daily. (2022) 2022, three new changes in
vocational education.
http://www.gov.cn/zhengce/2021-
10/12/content_5642120.htm
Li, HT. (2019) Chapter 8 The Development of Vocational
Li S, Ding S. (2003) The long-term trend of China 's urban
education yield. Chinese Social Sciences 2003 (06) :
58-72
Wang Boqing, Ma Yan. (2020) CHINESE 3-YEAR
VOCATIONAL COLLEGE GRADUATES’
EMPLOYMENT ANNUAL REPORT.
https://www.pishu.com.cn/skwx_ps/bookDetail?SiteID
=14&ID=11632445
Wang Boqing, Zhou Lingbo. (2018) CHINESE 3-YEAR
VOCATIONAL COLLEGE GRADUATES'
EMPLOYMENT ANNUAL REPORT
Xinhua News Agency. (2021) The General Office of the
CPC Central Committee and the General Office of the
State Council issued ' Opinions on Promoting the High-
quality Development of Modern Vocational Education
'. http://www.gov.cn/zhengce/2021-
10/12/content_5642120.htm.
https://www.pishu.com.cn/skwx_ps/bookDetail?SiteID
=14&ID=9728229
Xu C. (2014) A Review of Research on the Rate of Return
to Education. Youth science 2014-02 : 43
NMDME 2022 - The International Conference on New Media Development and Modernized Education
512
