
Analysis the Level of Satisfaction and Consumer Expectations on
Service Quality BPS in Jayawijaya District, Papua Province
Elsyan Rienette Marlissa
Faculty of Economics and Business, Universitas Cenderawasih, Papua, Indonesia
Keywords: Banking, Biro Pusat Statistik (BPS), Finance, Papua.
Abstract: The Government of Papua Provincial has made BPS (Central Bureau of Statistics) as one of the assets that
provides services and data of the regional economy, as an institution that can be a leading contributor that
contributes information about service quality and data quality for the region through the provision of quality
BPS data.This study aims to identify and analyze the Content of Satisfaction and expectations of data user
segmentation, BPS Service Quality and BPS data quality, satisfaction level and provide recommendations
on the type and quality of data and statistical information and analyze BPS Service Variables in Jayawijaya
Regency. The method used is Quantitative Analysis, Web Analysis and Cartesian Diagram (Importance
Performance Analysis Matrix). The results showed :1)Value of Aspects Satisfaction and Expectation of
Service Quality Aspects BPS in Jayawijaya Regency has so far expressed satisfaction (score 3); Value of
Aspect of Satisfaction and Expectation on BPS Data Quality Aspects up to now states satisfied (Score 3)
and Expectation on Service Quality Aspects BPS states satisfied (Score 3) is Important ; 2)The focus
contained in Quadrant A is the attribute 1. Requirements (2,915) and 5.Facilities (2,927) and 6. Complaint
Services (2,927) which need to be considered by BPS to keep its Consumers satisfied with various BPS
services and the quality of BPS data. BPS in Jayawijaya Regency should make the factors contained in
quadrant A as a strategy to compete with other Data / Information Provider Institutions both carried out by
Bappeda or LSM and other institutions. Provision of BPS services needs to be improved in order to achieve
minimum service standards, especially in terms of requirements must be reviewed. And improve the quality
of human resources involved in service by allocating operational costs
1 INTRODUCTION
BPS statistical data and information is a very
important source of information in the development
process, because it is used by stakeholders in
planning, budgeting and evaluating development.
Good and relevant data can be one indicator that can
be used to measure the performance of BPS District
/ City services in Papua Province.
Quality data is not only needed by development
implementers at the provincial, district / city
government levels, but public awareness (private,
students and the general public) of the importance of
data also increases the demand for data that must
always be responded quickly by BPS. Until now,
various efforts have been made by BPS in
Jayawijaya district to meet consumer demand, but
only to meet data needs with public services based
on the concept of excellent service.
In addition to data quality, the quality of services
provided by BPS in Jayawijaya district is also one of
the performance measures of BPS Jayawijaya
district in providing services to consumers in
government institutions / SKPD, students, private
sector, LSM and the general public as data users.
BPS in Jayawijaya District will see the results of its
services by getting various responses from SKPD,
the private sector, LSM and the general public in
terms of data users. Therefore, it is necessary to
carry out monitoring and evaluation of the
availability and suitability of data and data user
satisfaction on the services provided by BPS in
Jayawijaya district so far. For this reason, it is
necessary to conduct research on customer
satisfaction with the provision of data and services
provided by BPS in Jayawijaya Regency.
Rienette Marlissa, E.
Analysis the Level of Satisfaction and Consumer Expectations on Service Quality BPS in Jayawijaya District, Papua Province.
DOI: 10.5220/0009905000002480
In Proceedings of the International Conference on Natural Resources and Sustainable Development (ICNRSD 2018), pages 481-489
ISBN: 978-989-758-543-2
Copyright
c
2022 by SCITEPRESS – Science and Technology Publications, Lda. All rights reserved
481

2 LITERATURE REVIEW
2.1 Definition of Consumer Satisfaction
The law of diminishing marginal utility that
consumer satisfaction after several additions at a
time is not only reduced, but will continue with the
addition of zero which means that there is no
additional satisfaction at all in the additional
consumption made by consumers (Samuelson &
Nordhaus, 2001). Kotler said that customer
satisfaction is a person's feelings after comparing
what he feels with his expectations for the
performance of a product [2]. Satisfaction or
dissatisfaction of consumers is a response to the
evaluation of perceived non-conformity or
disconfirmation between previous expectations and
the actual performance of the product that is felt
after use[3]. Oliver stated that customer satisfaction
is a summary of psychological conditions produced
when emotions surrounding expectations do not
match and are multiplied by the feelings formed
about the consumption experience [4]. Westbrook &
Reilly
mengemukakanbahwakepuasankonsumenmerupakan
responemosionalterhadappengalaman yang
berkaitandenganprodukataujasa yang
dibeli(Tjiptono, 2005).
Gaspers said that customer satisfaction is very
dependent on consumer perceptions and
expectations. The factors that influence consumer
perceptions and expectations include:
a. Needs and desires related to things that
consumers feel when trying to make transactions
with product manufacturers.
b. Past experience when consuming products from
companies and competitors..
c. Experience from friends.
2.2 Components of Consumer
Satisfaction
As noted above, there is a lot of definition of
consumer satisfaction. According to Giese & Cote,
although there are many definitions of customer
satisfaction, in general it still leads to three main
components:
a. Response: Type and intensity
Consumer satisfaction is an emotional and
cognitive response. The intensity of the response
starts from being very satisfied and liking the
product to an apathetic attitude towards certain
products.
b. Focus
Focus on the performance of objects adjusted to
several standards. This standard value is directly
related to products, consumption, shopping
decisions, sellers and shops.
c. Response time
Responses occur at certain times, including: after
consumption, after the selection of products or
services, based on accumulative experience.
Duration of satisfaction leads to how long respir
satisfaction ends.
2.2 Characteristics of Satisfied
Consumers
Kotler stated the characteristics of satisfied
consumers as follows :
a. Loyal to the product
Satisfied consumers tend to be loyal where they
will buy back from the same producer
b. The existence of positive word-of-mouth
communication
Word of mouth communication that has positive,
recommendations to other potential customers
and says good things about products and
companies
c. Companies become the main consideration when
buying other brands
When consumers want to buy another product,
the company that has given satisfaction to them
will be the main consideration.
2.4 Element of Consumer Satisfaction
Wilkie stated that there are 5 elements in consumer
satisfaction :
a. Expectations
Consumer expectations of an item or service
have been established before consumers buy the
item or service. During the purchase process,
consumers expect that the goods or services they
receive are in line with their expectations, desires
and beliefs.
Goods or services that are in accordance with
consumer expectations will cause consumers to
feel satisfied.
b. Performance
Consumer experience of the actual performance
of goods or services when used without being
influenced by their expectations. When the actual
performance of goods or services is successful,
consumers will feel satisfied.
ICNRSD 2018 - International Conference on Natural Resources and Sustainable Development
482

c. Comparison
This is done by comparing the performance
expectations of goods or services before buying
with the perception of the actual performance of
the goods or services. Consumers will feel
satisfied when expectations before purchase
match or exceed their perceptions of the actual
performance of the product.
d. Confirmation/disconfirmation
Consumer expectations are influenced by their
experience of using brands of goods or services
that are different from others. Confirmation
occurs when expectations are in accordance with
the actual performance of the product. otherwise
disconfirmation occurs when expectations are
higher or morelow of the actual performance of
the product. consumers will feel satisfied when
confirmation / discofirmation occurs.
2.5 Types of Customer Satisfaction and
Dissatisfaction
Sumarwan explained that the theory of satisfaction
and consumer dissatisfaction were formed from the
expectation disconfirmation model, which explained
that the satisfaction or dissatisfaction of consumers
was the impact of the comparison between customer
expectations before the actual purchase of the
customer from the product or service. Customers'
expectations when buying actually consider the
function of the product (product performance)
Product functions include:
a. The product can function better than expected,
called positive disconfirmation. If this happens
then the customer will feel satisfied.
b. The product can function as expected, called a
simple confirmation. The product does not give
satisfaction and the product does not disappoint
so customers will have a neutral feeling.
2.6 Definition of Service Quality
The definition of service quality is centered on
efforts to meet customer needs and desires as well as
the accuracy of delivery to offset customer
expectations. Wyckofas quoted by Tjiptono defines
service quality as "the expected level of excellence
and control over the level of excellence to meet
customer desires". Parasuraman et al as quoted by
Christina defines service quality as "a reflection of
consumers' evaluative perceptions of services
received at a certain time". Based on the two
definitions of service quality above, it can be seen
that the two main factors that affect service quality,
namely the service that is expected (expected
service) of consumers and services received or
perceived (perceived service) by consumers or
perceived results.
2.7 Definition of E-Government
According to CahyanaAhmadjayadi in the 2006
keynote speech Workshop on Standardization
Towards e-Government Interoperability, explained
that: "e-Government is an activity related to the
efforts of all government institutions in working
together utilizing communication and information
technology, so that they can provide electronic
services and accurate information to individuals and
businesses. The e-Government Initiative is a
continuous process to improve government
performance and provide efficient services to the
public. It should be emphasized that efficiency is
very dependent on time and technology. Highly
efficient e-Government is not necessarily efficient in
the next few years because of the development of
TIK and the demands of its stakeholders. "
Development of e-Government is an effort to
develop governance through the use of electronic
media to improve the quality of public services.
With the development of e-Government, it is
necessary to restructure the work system and
processes in the government environment through
the use of information technology. The utilization of
information technology includes 2 activities or
activities that are directly related (Inpres No.3, 2003)
:
a. Data processing, information management,
management systems and work processes
electronically;
b. Utilization of advances in information
technology so that public services can be
accessed easily and cheaply by the public in all
regions of the country.
3 METHODOLOGY
3.1 Population and Sample
Sampling by random system (random sampling
system). Object / respondent who become the
sample in this research amounted to 40 respondents
spread in some institutions / institutions located in
the region Jayawijaya Regency, with the
composition as follows:
1. Government Agencies of at least 60 percent (24
Respondents)
Analysis the Level of Satisfaction and Consumer Expectations on Service Quality BPS in Jayawijaya District, Papua Province
483
2. Private as much as 10 percent (4 respondents)
3. Education and Research Institutions around 10
percent (4 Respondents)
4. Others as much as 20 percent (8 Respondents)
3.2 Research Variable
Levels of Customer Satisfaction and Expectation on
aspects of Quality of Service, Focus on:
requirements, SOP, Cost of Staff, Facilities,
Complaints Service and Website.
The level of satisfaction and expectations of
consumers for the quality aspects of data for social
statistics.social statistics, production statistics,
distribution and service statistics, balance sheets and
statistical analysis, statistical methodology with a
focus on: accuracy, accuracy, relevance,
accessibility, comparability, aligned with other
sources.
3.3 Data Analysis Method
1) Aspects of Satisfaction and Expectation on
Aspects Service quality and data quality of BPS
in Maerauke district uses Web analysis tools.
Factors that influence the satisfaction of BPS
service / service users in Jayawijaya district
1. Level of Expectation / Interest
Consumers will assess the importance of
service quality, using a liqueur scale of
values 1-4
1 :Very unimportant
2.: Not important
3 :Important
4:Very important
2. Service / satisfaction level
Consumers will assess service quality /
satisfaction of service quality, using a
liqueur scale of values 1-4
1: Very dissatisfied
2: Not satisfied
3: Satisfied
4: Very Satisfied
Table 1: Criteria for Assessment of Satisfaction Aspectson
Service Aspects.
SCORE Satisfaction
1 Very dissatisfie
d
2 Not satisfie
d
3 Satisfie
d
4 Ver
y
Satisfie
d
Source, BPS, November 2017
Table 2: Aspect Assessment Criteriaon Service Aspects.
SCORE Satisfaction
1 Very unimportant
2 Not important
3 Important
4Ver
y
im
p
ortant
Source, BPS, November 2017
2) To determine the level of customer satisfaction
with the quality of service of BPS in
Jayawijaya Regency based on factors that
influence consumer satisfaction using the
method of Importance Performance Analysis
(Cartesian Diagram) is used to find out the
things that become priority improvements to
the factors that influence the level of customer
satisfaction with BPS service quality.
To analyze or compare BPS services /
performance that can be felt by service users
(consumers) compared to the desired level of
satisfaction. The level of suitability is the result
of a comparison between the service score and
the importance score, so that this level of
suitability will determine the priority scale to
be used in handling
Decision score will be compared with the level
of suitability, if the value of the suitability level is
small from the value of the decision making score
then the attribute needs improvement (Action) and if
the suitability level is greater than the score, then the
attribute needs to be maintained (Hold.).
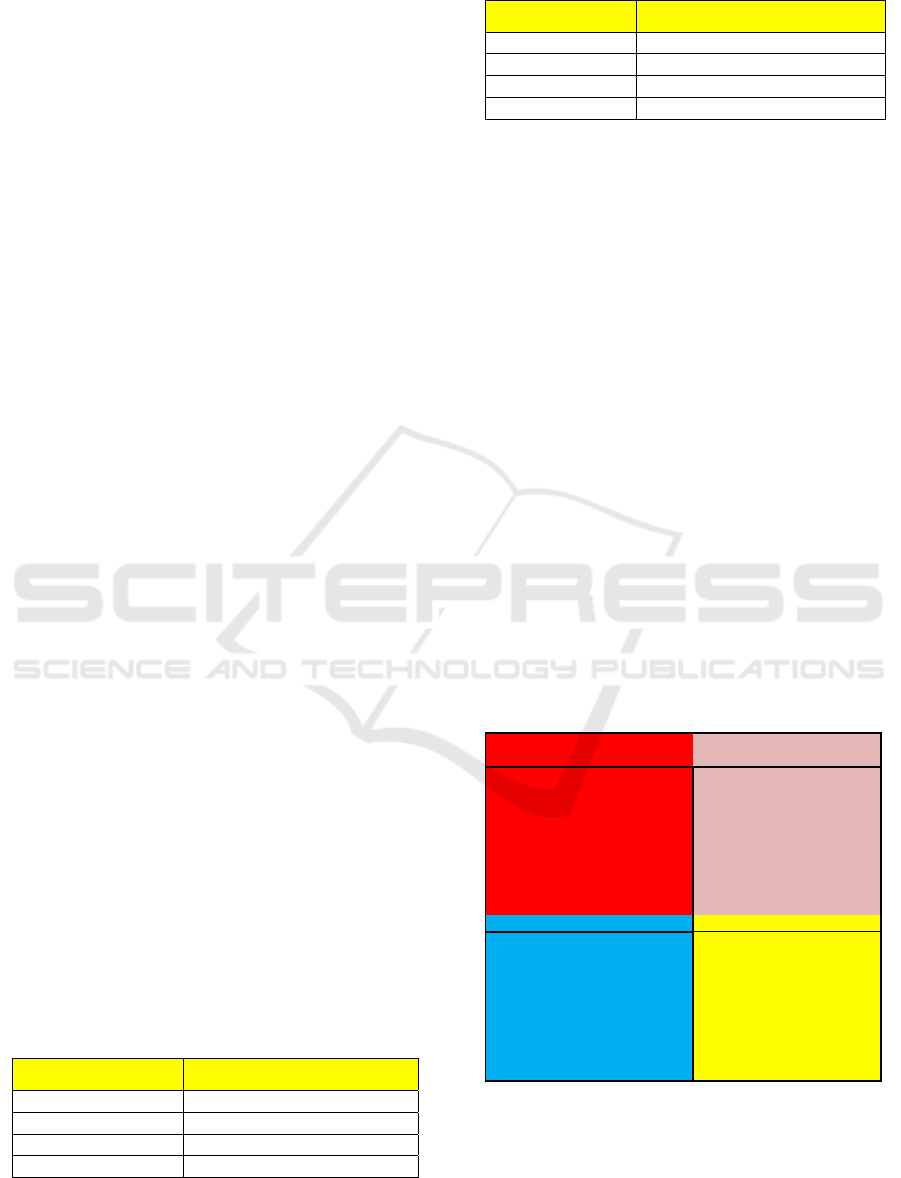
Figure 1: Cartesius diagram
A Main priority
(Concentrate Here)
B. Maintain Achievement
(Keep Up The Good Work)
In quadrant A there are
factors that are considered
important and / or expected by
consumers, BPS performance is
deemed unsatisfactory so the
BPS needs to concentrate on
allocating its resources to
improve performance in this
quadrant (Quadrant A)
In Quadrant B there are
factors that are considered
important and are expected to
be a factor supporting
consumer satisfaction so that
BPS is obliged to maintain
the performance achievement
(Quadrant B)
C.Low Priority D. Possibly Overkill
In the C quadrant there are
factors that are considered to
have a low level of perception or
BPS performance and are not too
important and or not too
expected by consumers so that
BPS needs to prioritize or give
more attention to low Priority
factors (Quadrant C)
There is a factor that is
deemed not too important
and not too expected by
customers to BPS to better
allocate resources related to
factors in quadrant D to other
factors that have a higher
priority level (quadrant D).
ICNRSD 2018 - International Conference on Natural Resources and Sustainable Development
484
4 RESULT AND DISCUSSION
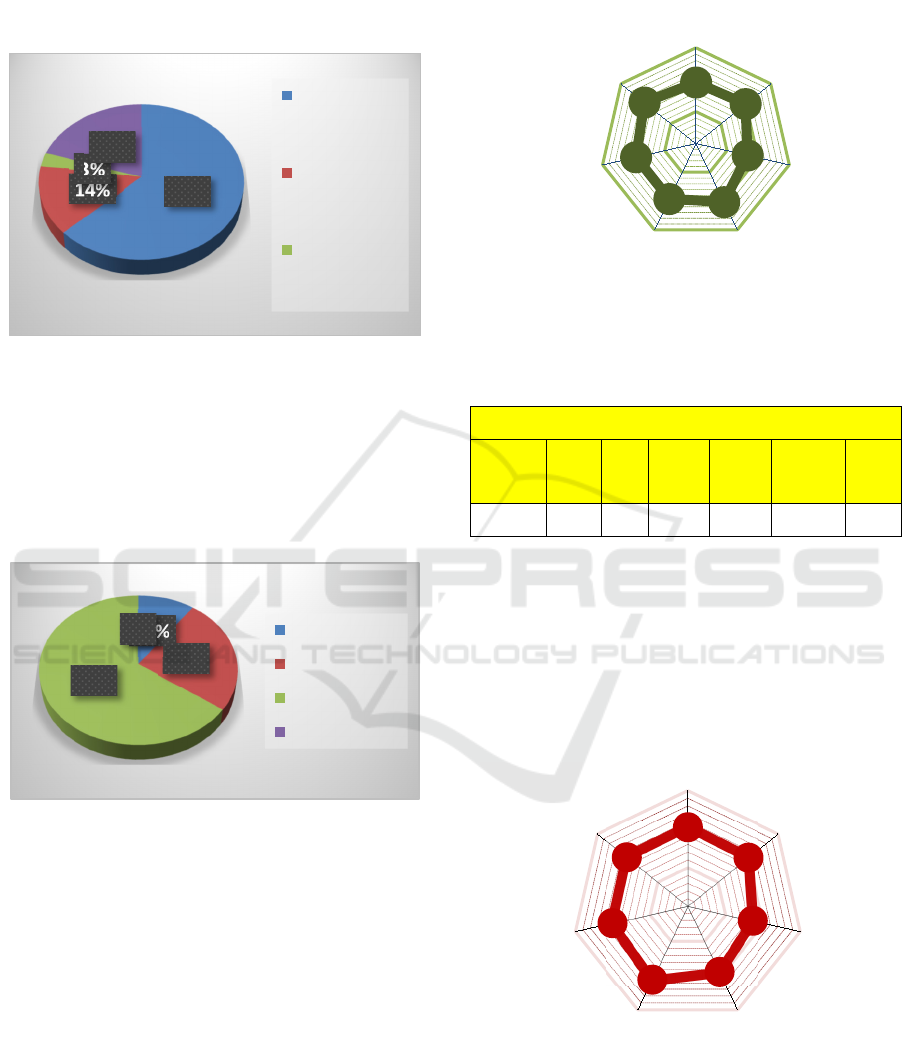
4.1 Respondent Characteristics
Figure 2: Place of Respondents Activities. Source BPS,
data processed, November 2017
The respondents in Jayawijaya Regency were
government agencies as many as 8 respondents,
SKPD as many as 16 respondents consisting of
several SKPD, Domestic Education and Research
Institutions 11 respondents, and others as many as 3
respondents.
Figure 3: The Last Education that Respondents
Endured.Source BPS, data processed, November 2017
The last education of respondents in Jayawijaya
District showed that generally undergraduate
education is below.
Value of the Aspect of Satisfaction and Hope
on the Aspect of Quality of BPS Services
Figure 4: WEB (Spider Web) Satisfaction Aspect on The
Aspect of Quality of BPS Services.
Table 3: Satisfaction Aspect on The Aspect of Quality of
BPS Services.
Satisfaction
Requireme
nts
Sop Cost
Employ
ee
Facilitie
s
Complaint
s Service
Websit
e
2,915 2,988 2,659 3,034 2,927 2,927 3,063
Source BPS, data processed, November 2017
Achievement in the aspect of quality of service
for satisfaction gets a value of 2.9, meaning
"unsatisfactory / dissatisfied", meaning that there is a
need for improvement of aspects of service quality,
especially in the variable costs.
Value of Aspects Satisfaction and
Expectation of BPS Service Quality Aspects
Figure 5: WEB (Spider Web) Aspect of Hope on The
Aspect of Quality of BPS Services.
63%
14%
3%
20%
SKPD
Pendidian dan
Penelitian
Dalam Negeri
Media Massa
10%
25%
65%
0%
SLTA Ke bawah
D1 - D3
D4 - S1
S2 - S3
1,00
2,00
3,00
4,00
PERSYARATAN
SOP
BIAYA
TENAGA
PETUGAS
FASILITAS
LAYANAN
ADUAN
WEBSITE
1,00
2,00
3,00
4,00
PERSYARATAN
SOP
BIAYA
TENAGA
PETUGAS
FASILITAS
LAYANAN ADUAN
WEBSITE
Analysis the Level of Satisfaction and Consumer Expectations on Service Quality BPS in Jayawijaya District, Papua Province
485
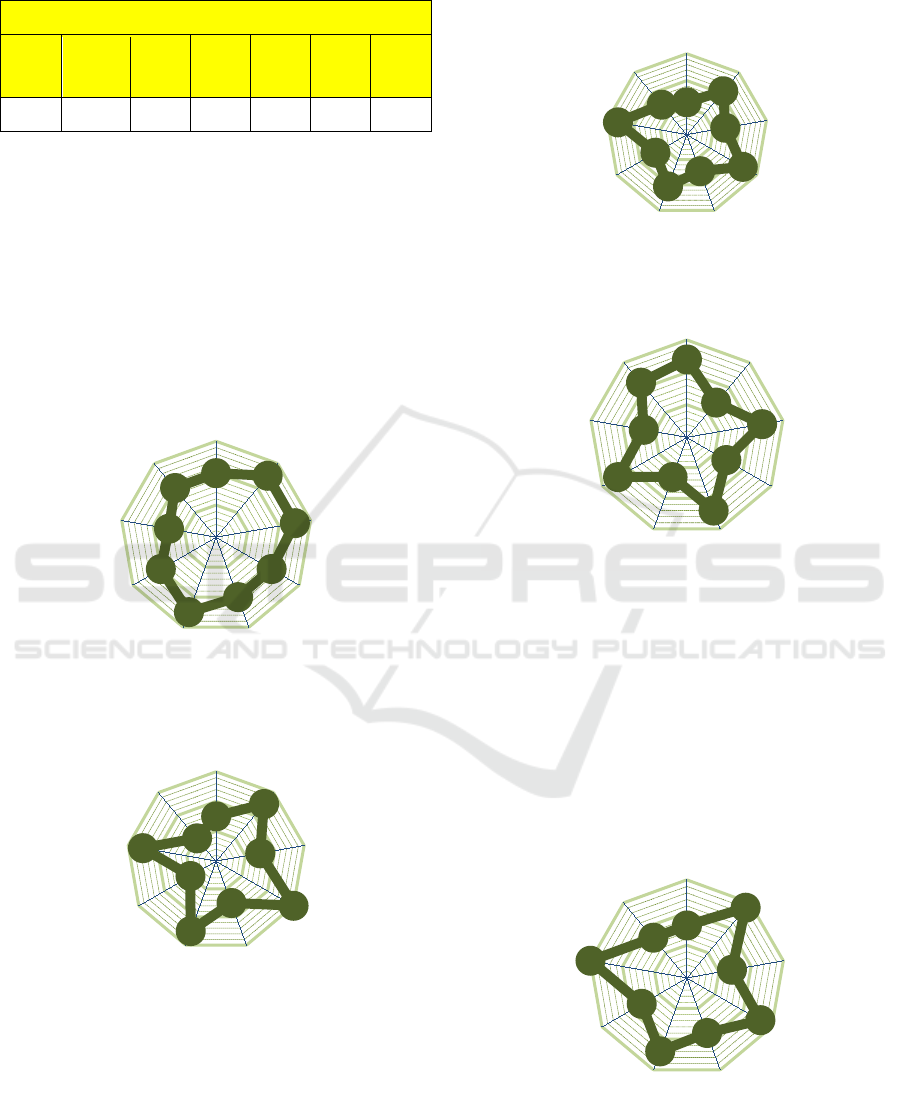
Table 4: Aspect of Hope on The Aspect of Quality of BPS
Services.
Ex
p
ectation
Requirem
ents
Sop Cost
Employe
e
Facilities
Complain
ts Service
Website
3,049 3,016 2,732 2,902 3,130 3,012 3,034
Source BPS, data processed, November 2017
Achievements in the quality aspect Service for
Expectation gets a value of 2.98 meaning "not
important" focus Customer satisfaction on the
quality aspect Service to expect to have a value of 2,
which means important are Facilities, Requirements
and SOP.
Value of the Aspect Satisfaction and
Expectation on the Data Quality of BPS Data
(Production Statistics)
Figure 6: WEB (Spider Web) Satisfaction Aspect on Bps
Data Quality Aspect.
Figure 7: (Spider Web) Aspect of Hope on BPS Data
Quality Aspect.
Achievements in the Quality aspect of Service
for satisfaction of getting a score of 3.11 means
"satisfying / satisfied
Achievements in the Quality Aspect of Service for
Expectation get a value of 2.88, meaning "not
important"
Value of Aspect of Satisfaction and
Expectation on BPS Data Quality Aspects
(Service Distribution Statistics)
Figure 8: WEB (Spider Web) Satisfaction Aspect on BPS
Data Quality Aspect.
Figure 9: WEB (Spider Web) Aspect of Expectation on
BPS Data Quality Aspect.
Achievements in the quality aspects of service
for satisfaction get a value of 2.78 meaning
"unsatisfactory / dissatisfied". Achievements in the
Quality Aspect of Service for Expectation get a
value of 2.91, meaning "not important"
Value from the Aspect of Satisfaction and
Expectation on the Quality Aspect of BPS
Data (Balance Sheet and Statistical Analysis)
Figure 10: WEB (Spider Web) Satisfaction Aspect on BPS
Data Quality Aspect.
1,00
2,00
3,00
4,00
Akurasi
Kemuktahiran
Relevansi
Aksesbilitas
KomparasiKeselarasan
Interpretasi
Kelengkapan
Aktualitas
1,00
2,00
3,00
4,00
Akurasi
Kemuktahi…
Relevansi
Aksesbilitas
KomparasiKeselarasan
Interpretasi
Kelengkap…
Aktualitas
1,00
2,00
3,00
4,00
Akurasi
Kemuktahiran
Relevansi
Aksesbilitas
KomparasiKeselarasan
Interpretasi
Kelengkapan
Aktualitas
1,00
2,00
3,00
4,00
Akurasi
Kemuktahiran
Relevansi
Aksesbilitas
KomparasiKeselarasan
Interpretasi
Kelengkapan
Aktualitas
1,00
2,00
3,00
4,00
Akurasi
Kemuktahiran
Relevansi
Aksesbilitas
KomparasiKeselarasan
Interpretasi
Kelengkapan
Aktualitas
ICNRSD 2018 - International Conference on Natural Resources and Sustainable Development
486
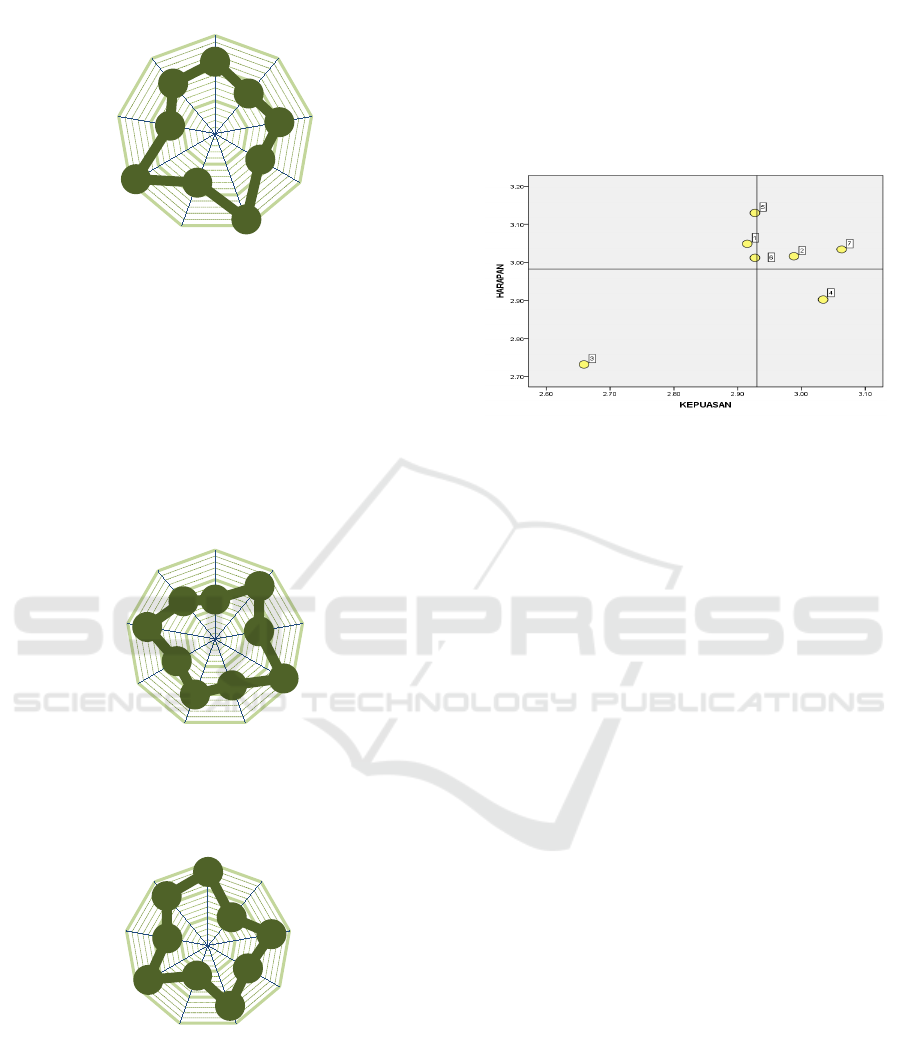
Figure 11: WEB (Spider Web) Aspect of Expectation on
Bps Data Quality Aspect.
Achievements in the quality aspect of service for
satisfaction of getting a score of 3.08 means
"satisfying / satisfied
Achievements in quality aspects of Service for
Expectation get a score of 3, meaning "important"
Value of Aspects of
Satisfaction and Expectation
of BPS Data Quality Aspects (Methodology)
Figure 12: WEB (Spider Web) Satisfaction Aspect on BPS
Data Quality Aspect.
Figure 13: WEB (Spider web)Aspect of Expectation on
BPS Data Quality Aspect.
Achievements in the quality aspects of service
for satisfaction get a value of 2.88 meaning
"unsatisfactory / dissatisfied"
Achievements in the Quality Aspect of Service for
Hope get a value of 2.98, meaning "not important"
Importance Performance Analysis (Cartesian
diagram) is used to find out the focus or things that
become priority improvements to the factors that
affect the level of customer satisfaction with the
quality of BPS services
The results of the development of each attribute in
each quadrant in Figure 2 below:
Figure 14: Results of calculation of Cartesian Diagram.
Source BPS, data processed, November 2017
1,00
2,00
3,00
4,00
Akurasi
Kemuktahiran
Relevansi
Aksesbilitas
KomparasiKeselarasan
Interpretasi
Kelengkapan
Aktualitas
1,00
2,00
3,00
4,00
Akurasi
Kemuktahiran
Relevansi
Aksesbilitas
KomparasiKeselarasan
Interpretasi
Kelengkapan
Aktualitas
1,00
2,00
3,00
4,00
Akurasi
Kemuktahiran
Relevansi
Aksesbilitas
KomparasiKeselarasan
Interpretasi
Kelengkapan
Aktualitas
Analysis the Level of Satisfaction and Consumer Expectations on Service Quality BPS in Jayawijaya District, Papua Province
487
A Main priority B Defend Achievement
Main priority
In quadrant A there is a factor, 1.5.6
which is considered important and / or
expected by consumers, BPS
performance is deemed unsatisfactory
so BPS needs to concentrate on
allocating its resources to improve the
performance of this quadrant
1. REQUIREMENTS (2,915)
5. FACILITIES (2,927)
6. COMPLAINTS SERVICE (2,927)
2. SOP (2,988)
7. WEBSITE
(3,063)
Maintain Achievement (Keep
Up The Good Work)
In Quadrant B there is a factor
of 2.7 which is considered
important and is expected as a
factor supporting customer
satisfaction so that BPS is
obliged to maintain the
performance achievement
C Low Priority D Possibly Overkill
Low Priority
In quadrant C there is a factor 3 which
is considered to have a low level of
perception or BPS performance and is
not too important and or not too
expected by consumers so that BPS
needs to prioritize or give more
attention to factor 3 (Cost).
3.COSTS (2,659) 4.EMPLOYEES
(3,034)
In Quadrant D there is a factor
4 which is considered not too
important and not too
expected by the customer so
that the BPS is better to
allocate resources related to
the EMPLOYEE's POWER
factor to other factors that
have a highe
r
priority level
Figure 15: Results of calculation of Cartesian Diagram
From figure 15 the Cartesian Diagram above can be
explained that:
Quadrant A
Quadrant A is an area that is focused / considered
important by consumers, but in reality these focus /
attributes are still not as expected by consumers. In
this case the BPS of Jayawijaya Regency needs to
make the best improvements to increase customer
satisfaction towards the focus / attributes included in
quadrant A. Attributes included in quadrant A are
attributes 1. REQUIREMENTS (2,915) and 5.
FACILITIES (2,927) and 6. COMPLAINTS
SERVICE (2,927).
As for some things that should be done in order to
improve or adjust to some of the things that are
prioritized above, the first among others is the need
to do REQUIREMENTS, provision of BPS service
room facilities so that consumers get satisfaction and
comfort in SERVICES.
Quadrant B
Quadrant B is an area that contains the focus /
attributes that are considered important by
consumers, and the focus / attributes are considered
to be in accordance with the wishes of consumers so
that the level of customer satisfaction is relatively
higher, so it needs to be maintained by BPS in
Jayawijaya Regency because it can provide
appropriate services with the wishes of consumers so
that consumers feel satisfied. The focus / attributes
included in this quadrant are: 2. SOP (2,988) and 7.
WEBSITE (3,063).
Quadrant C
Quadrant C is a region that contains focus /
attributes that are considered less important by
consumers and in fact the service / performance of
the BPS is considered unsatisfactory. But it does not
rule out the possibility of quadrant C in the future
being an important concern by consumers, so BPS
must also consider this. The attributes included in
this quadrant are: 3. COSTS (2,659).
Quadrant D
Quadrant D is an area that contains the focus /
attributes that are considered less important by
consumers and the servants / performance performed
by BPS is felt to be too high or excessive, so BPS
does not need to make improvements. The attributes
included in this quadrant are: 4. EMPLOYEES
(3,034).
ICNRSD 2018 - International Conference on Natural Resources and Sustainable Development
488

4 CONCLUSION AND
RECOMMENDATION
4.1 Conclusion
1. Value of Aspect Satisfaction and Expectation on
Service Quality Aspects BPS in Jayawijaya
district to date states that the value of satisfaction
and expectation aspects on data quality for
satisfaction aspects states satisfied with score 3.
And Value of Satisfaction and Expectation Value
on BPS Data Quality Aspects (Statistics
Socially) to date states that the value of the
satisfaction aspect states (score 3) Satisfied and
Expectations of the Quality of Service Quality
BPS Satisfaction states (Score 3) is Important.
2. The focus / attributes contained in Quadrant A
are the focus / attributes that need to be
considered by BPS are 1. REQUIREMENTS
(2,915), 5. FACILITIES (2,927), 6.
COMPLAINTS SERVICE (2,927) to keep its
Consumers satisfied with various services and
quality of BPS data. BPS Jayawijaya Regency
should make the factors contained in quadrant A
as a strategy to compete with other Data /
Information Provider Institutions, whether
conducted by Bappeda or LSM and other
institutions.
4.2 Recommendation
1. Provision of quality BPS services needs to be
improved so as to achieve minimum service
standards, especially in terms of requirements
must be reviewed and improve the quality of
human resources involved in services by
allocating operating costs.
Provision of data quality should be carried out by
gathering data requirements from users,
especially related technical institutions.
2. In the implementation of the data update, the
BPS of Jayawijaya Regency should make the
factors, requirements, facilities and complaints
service in quadrant A as a strategy to compete by
competing with other Data / Information
Provider Institutions, whether conducted by
Bappeda or LSM and other institutions.
REFERENCES
Instruksi Presiden Republik Indonesia Nomor 3 tahun
2003 Tentang Kebijakan dan Strategi Nasional
Pengembangan e-Government.
Kotler, P.,2001. Manajemen Pemasaran di Indonesia:
Analisis, Perencanaan, Implementasi dan
Pengendalian. SalembaEmpat. Jakarta.
Nasution, MN., 2004. Manajemen Jasa Terpadu. Ghalia
Indonesia.Bogor.
Peter, PJ., Olson, JC., 1999.Consumer Behavior and
Marketing Strategy. Richard D Irwin Inc. New
York,Fourth Edition.
Samuel, PA.,Nordhaus, WD., 2001. Economics. Mc Graw-
Hill.
Supranto, J., 2006. Pengukuran Tingkat Kepuasan
Pelanggan Untuk Menaikkan Pangsa Pasar. PT
Rineka Cipta. Jakarta.
Tjiptono, 2005. Pemasaran Jasa. Bayu Media Publishing.
Malang, Edisi Pertama.
Analysis the Level of Satisfaction and Consumer Expectations on Service Quality BPS in Jayawijaya District, Papua Province
489
