
The Exposure of Emission Gas Pollutant to Residential Area
around the Industrial Area: Case Study - Medan Star Industrial Area
Tanjung Morawa Subdistrict, Deli Serdang District
Rosdiana Tiominar Panjaitan
1
, Harlem Marpaung
2
, Wirsal Hasan
3
1
Master Program of Natural Resources and Environment Management, Universitas Sumatera Utara, Medan, Indonesia
2
Department of Chemistry, Universitas Sumatera Utara, Medan, Indonesia
3
Department of Public Health, Universitas Sumatera Utara, Medan, Indonesia
Keywords: Kawasan Industri Medan Star, Exposure, Gas Pollutant, Gauss Model.
Abstract: The objective of the research was to find out to what extent the exposure of emission gas pollutant SO
2
,
NO
2
, and CO from immovable and movable sources in the Operational KIM (Medan Industrial Area),
Tanjung Morawa Star and to find out the people’s attitude and perception in the vicinity on the activity of
KIM Star, Tanjung Morawa. Based on the result of measurement and calculation, the value of air emission
is still in accordance with the quality standard required in the Government Regulation No. 41/1999. The
result of interview showed that people’s attitude and perception in the vicinity on the operational of KIM
Star Tanjung Morawa is relatively good. The result of the calculation showed that emission exposure from
KIM Star Tanjung Morawa is smaller than the activity of transportation (mobile source). The cumulative
calculation of air emission from immovable source showed that the value produced would decrease 50%-
70% in each additional distance of 400 m - 500 m.
1 INTRODUCTION
Tanjung Morawa is one of the sub-districts in Deli
Serdang District, North Sumatera which is one of the
biggest contributors to the locally – generated
revenue of Deli Serdang District especially from the
industrial sector. The strategic location of Tanjung
Morawa Sub-district is close to downtown Medan
and the Balmera toll road (Belawan, Medan,
Tanjung Morawa) has made this area one of the
important industrial centers in North Sumatra.
Medan Industrial Area (MIA) Star Tanjung Morawa
is an industrial area located in Tanjung Morawa
Sub-district has provided substantial benefits to the
improvement of the economy and development
progress around it (Kompassiana, 2015). But on the
other hand the existence of this industrial area has
resulted in a decrease in environmental quality,
especially air quality. Industries operating in this
region use fossil fuels that produce exhaust gases
that can cause air pollution.
According to Sugiarti (2006), the most dominant
air pollutant gas affecting human health is Carbon
Monoxide (CO), Nitrogen Oxide (NO2), and Sulfur
Oxide (SO2). The components of air pollutants
mentioned above can pollute the air individually - or
can pollute together. The effect of air pollutant gas
on human health can have direct or indirect effects
such as; damaging the composition of blood
hemoglobin, ARI disease, throat irritation,
pneumokinosis, cardiovascular and cancer. The
influence of air pollutant gas on human health has
resulted in anxiety in the community living around
MIA Star Tanjung Morawa that can cause the
impact of derivatives in the form of negative
attitudes and perceptions on the existing industrial
activities in the region. Public perception of
pollutant substances depends on the knowledge /
education and experience. Residents who are around
the MIA Star a variety of habits of society is also
different from the issue of this pollutant substance.
Emissions from factory and motorized chimneys
arising from the operation of MIA Star Tanjung
Morawa enter the air and can move from the source
point in the other direction to form the pattern of
ambient air distribution according to the dominant
wind direction (Wardani, 2003). This situation
caused a decline in ambient air quality at MIA Star
374
Tiominar Panjaitan, R., Marpaung, H. and Hasan, W.
The Exposure of Emission Gas Pollutant to Residential Area around the Industrial Area: Case Study - Medan Star Industrial Area Tanjung Morawa Sub District, Deli Serdang District.
DOI: 10.5220/0009903300002480
In Proceedings of the International Conference on Natural Resources and Sustainable Development (ICNRSD 2018), pages 374-379
ISBN: 978-989-758-543-2
Copyright
c
2022 by SCITEPRESS – Science and Technology Publications, Lda. All rights reserved
Tanjung Morawa, which was inhaled every second
by the surrounding community. For this reason, it is
necessary to identify the pattern of ambient air
distribution around MIA Star Tanjung Morawa to
find out how far the ambient emission movement
has exceeded the threshold. This is very important
for efforts to anticipate, prevent and regulate the
effects of air pollution
An estimate of the extent to which the emission
exposure is stopped can be obtained by using the
Gauss dispersion model. According to Bakar (2006)
the Gauss dispersion model was used to determine
the distance of emission exposure produced by
industrial activities and its supporting activities at
MIA Star Tanjung Morawa. The exposure distance
produced by the Gauss dispersion model will show
the location and area affected by the most
contamination, the furthest distance from the
pollution range in certain wind conditions shifting
the position of the largest contamination with the
occurrence of weather changes, as well as reduced or
increased levels of pollutants in the most
contaminated locations in accordance with effective
height differences emission.
2 REVIEW OF REFERENCES
Air is a mixture of several gases whose ratio is not
fixed, depending on the state of air temperature, air
pressure and the state of the surrounding
environment. Air contains a certain amount of
oxygen, is an essential component of life, both
humans and other living things. Normal air is a
mixture of gases including 78% N2; 20% O2; 0.93%
Ar; 0.03% CO2 and the rest consists of neon (Ne),
helium (He), methane (CH4) and hydrogen (H2).
Conversely, if there is an addition of other gases that
cause interference and changes in the composition, it
is said that the air is polluted / polluted. The entry of
foreign substances or substances into the air always
causes changes in air quality. The entry of foreign
materials or substances does not always cause air
pollution. Referring to the definition, new air
pollution occurs if the entry of foreign substances or
substances causes air quality to drop to the level
where human life and animals are disturbed or the
environment does not function as it should
(Wardana, 2001).
According to PP RI No. 41 of 1999 concerning
Control of Air Pollution, the source of the causes of
air pollution (by human activities), can be grouped
into:
1. Movable sources, which is derived from
transportation / motorized vehicle activities;
2. Specific movable sources, those originating from
trains, aircraft, ships and other heavy vehicles;
3. Stationary sources, which originates from a fixed
emission source somewhere. Then these sources
are grouped back into sections, ie point source,
source source, area source, and line source.
4. Specific immovable sources, which come from
forest / land fires and waste burning.
Air quality standards are the threshold of
pollutant concentrations that are considered harmless
to living things. This air quality standard is
presented in weight per unit volume per unit time.
Relating to the maximum value of emission
concentrations in ambient air, this has been
regulated in Government Regulation No. 41 of 1999.
Nitrogen oxide is often referred to as NOx
because nitrogen oxide has two different forms of
nature, namely NO2 gas and NO gas. The nature of
NO2 gas is colorless and smelly, while NO gas is
colorless and odorless. NO2 gas color is brownish
red and smells sharp nose sting. NOx air pollution in
the air comes primarily from the combustion gases
resulting from combustion generators from
stationary power station generators or engines using
natural gas fuel. Toxicity of NO2 gas is four times
stronger than NO gas toxicity. The body organs that
are most sensitive to NO2 gas pollution are the
lungs. Lungs contaminated by NO2 gas will swell so
that people who have difficulty breathing can lead to
his death (Wardhana, 2001).
Sulfur oxide gases or often written with SOx
consist of SO2 and SO3 gas which both have
different properties. SO2 gas smells strong and not
flammable. Air that has been contaminated SOx,
causing humans to experience respiratory problems.
This is because the easy SOx gas becomes the
smoke that attacks the mucous membranes of the
nose, throat and other respiratory tract to the lungs.
The SOx gas attack causes irritation to the affected
part of the body (Wardhana, 2001).
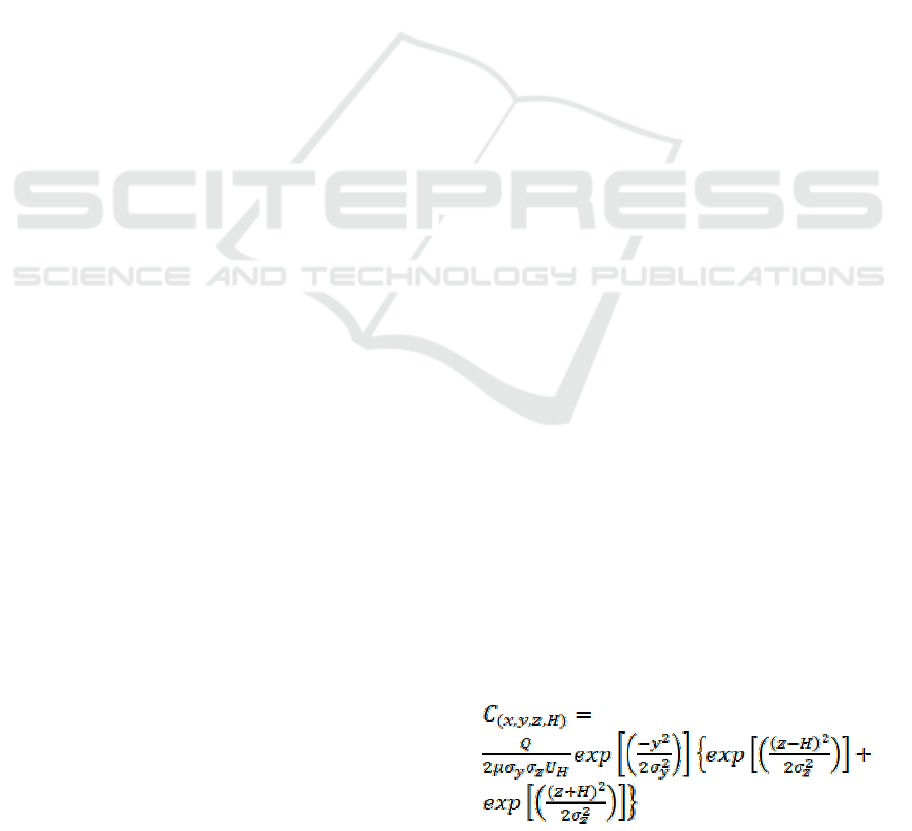
In this study Gauss dispersion model was used to
calculate the estimated large gas pollutants. The
concentration of pollutants from gases and aerosols
(particles less than 20 microns in diameter) at x, y, z
from continuous sources with high effective H
emissions, formulated in equations:
(1)
The Exposure of Emission Gas Pollutant to Residential Area around the Industrial Area: Case Study - Medan Star Industrial Area Tanjung
Morawa Sub District, Deli Serdang District
375

3 RESEARCH METHODOLOGY
3.1 Materials and Tools
Equipment used in this research is divided into two
groups, namely hardware and software. The
hardware used in this research is Global Positioning
System (GPS) used to provide geographical
reference of observation location, computer used to
process, analyze data and present result of data
analysis in the form of map, digital camera used for
documentation of actual condition in field, tape
recorder / used to record interviews conducted with
resource persons, stationery is used to record data
and interviews, and printers are used to print data
and maps. The software used in this study is
Microsoft Excel 2007 used to perform tabular data
calculations, Microsoft Office 2007 is used to
present the report of research results, GIS is used to
describe the spread of emissions in the form of
maps.
Materials used in this study include
climatological data including: air temperature, wind
direction and speed, rainfall, sub-district data in
numbers, demographic data, health data and
nutritional status and ambient air measurement data
4 METHOD OF PROCESSING
AND DATA ANALYSIS
4.1 Climatology
Climatological data processing will produce wind
speed and dominant wind direction.
4.2 Gauss Dispersion Model
The Gauss disperssiom model is used to calculate
the amount of exposure to emissions produced by
immovable and operational moving sources of MIA
Star Tanjung Morawa. The amount of exposure is
calculated based on the distance in the direction of
the dominant wind direction.
4.3 Interview with the Community
Data processing from interviews with the
community will be carried out in a tabulative
manner, while data analysis will be carried out with
quantitative and qualitative descriptive methods.
5 RESULTS AND DISCUSSION
5.1 Analysis of Calculation of
Immovable Resources
The calculation of point sources originating from the
operation of a stationary source machine such as a
boiler and generator at MIA Star Tanjung Morawa
has resulted in a pattern where the magnitude of the
emission concentration in terms of distance will be
affected by the value of x (the downwind distance
along the centerline flume of the emission source)
and the value y (crosswind distance from centerline
flume). The large concentration of emissions
generated by MIA Star Tanjung Morawa activity is
the cumulative emission generated by the companies
in the region. In detail the amount of emissions
produced at points STU-1, STU-2, and STU-3 are
listed in Table 1.
Table 1: Calculation of total emissions generated point
sources at MIA Star Tanjung Morawa.
Observation
location
Units
Emission concentration
(
µg
r/Nm
3
)
NO
2
CO SO
2
STU-1 µg/Nm
3
3,5758 28,1175 1,9829
STU -2 µg/Nm
3
1,3600 9,4941 0,9067
STU -3 µg/Nm
3
0,4862 3,6715 0,2928
Remarks : QS according to PP No. 41 Year 1999
NO
2
= 400 µgr/Nm
3
, CO = 30.000 µgr/Nm
3
, dan SO
2
=
900 µgr/Nm
3
Figure 1: Figure of Concentration Emission Pattern of NO
from Industrial Area at STU-1, STU-2, and STU-3.
ICNRSD 2018 - International Conference on Natural Resources and Sustainable Development
376

Figure 2: Figure of Concentration Emission Pattern of CO
From Industrial Area at STU-1, STU-2, dan STU-3.
Figure 3: Figure of Concentration Emission Pattern of
SO
2
from Industrial Area at STU-1, STU-2, dan STU-3.
Based on Table 1. it is known, to concentration
emission of NO2 on STU-1 (distance of 100 m from
the outer wall of MIA Star Tanjung Morawa to the
Northeast) at 3,575830737 μg / m3, at STU-2
(distance of 500 m from the outer wall of the Area
Medan (Star) Industry Tanjung Morawa towards the
Northeast) is 1.360011811 μg / m3, and in STU-3
(1000 m distance from the outer wall of MIA Star
Tanjung Morawa towards the Northeast) is
0.48621631μg / m3. In STU-2 it decreased from
STU-1 by 2.215819 μg / m3 or by 61.91%. In STU-
3, it decreased from STU-2 by 0.873796 μg / m3 or
by 64.24%.
Concentration Emission of CO in STU-1
(distance of 100 m from the outer wall of MIA Star
Tanjung Morawa to the Northeast) of 28.11748208
μg / m3, at STU-2 (distance of 500 m from the outer
wall of MIA Star Tanjung Morawa towards
Northeast) amounting to 9,494124521 μg / m3, and
in STU-3 (1000 m distance from the outer wall of
MIA Star) Tanjung Morawa towards the Northeast)
of 3,671518995μg / m3. In STU-2, it decreased from
SKU-1 to 18,62336 μg / m3 or 66.23%. In STU-3 it
decreased from STU-2 by 5,822606 μg / m3 or by
61,23%.
The concentration emission of SO2 at STU-1
(100 m distance from the outer wall of MIA Star
Tanjung Morawa to the Northeast) is 1.982875317
μg / m3, at STU-2 (200 m distance from the outer
wall of MIA Star Tanjung Morawa to the Northeast )
of 0.906727076 μg / m3, and at STU-3 (500 m
distance from the outer wall of MIA Star Tanjung
Morawa to the northeast) of 0.292768841 μg / m3.
In STU-2, it decreased from STU-1 by 1,076148 μg
/ m3 or by 54.72%. The STU-3 experienced a
decline from SKU-2 of 0.613958 μg / m3 or 67.77%.
5.2 Analysis of Calculation of Movable
Resources
The reference point for determining the distance of
emission source source to STU-1, STU-2 and STU-3
was taken at the center point of MIA Star Tanjung
Morawa location. The value of σ_y and σz is based
on distance (x) refers from PT F to STU-1, STU-2
and STU-3. The calculation results of the SO2, NO2
and CO emission exposure from immovable sources
in KIM Star Tanjung Morawa are listed in Table 2
Table 2: Calculation Results of exposure to SO2, NO2 and
CO emissions from mobile sources at MIA Star Tanjung
Morawa to STU-1, STU-2 and STU-3.
Parame
te
r
Unit QS
*
STU-1
STU-
2
STU-
3
NO
2
µg/N
m
3
400
16.457
6
6.852
0
4.981
0
CO
µg/N
m
3
30,0
00
161.44
69
67.21
70
48.86
40
SO
2
µg/N
m
3
900 0.0145
0.006
0
0.004
0
*) Government Regulations No. 41 Tahun 1999
The Exposure of Emission Gas Pollutant to Residential Area around the Industrial Area: Case Study - Medan Star Industrial Area Tanjung
Morawa Sub District, Deli Serdang District
377

5.3 Comparison of Exposure Emissions
from Immovable Sources, Moving
Sources and Measurement Results
of the STU-1 (100 m)
Table 3: Comparison of Exposure Emissions from
immovable sources, moving sources and measurement
results of the STU-1 (100 m).
Emission
Sources
Units
Paramete
r
s
NO
2
CO SO
2
Immovabl
e sources
µgr/Nm
3
3.5758 28.1175 1.9829
Movable
sources
µgr/Nm
3
16.4576
161.446
9
0.0145
Measurem
ent results
µgr/Nm
3
33.4500
903.000
0
16.7000
Quality
Standar
d
*
µgr/Nm
3
400 30,000 900
*) Government Regulations No. 41 Year 1999
5.4 Comparison of Emission Exposure
from Immovable Sources, Moving
Sources and Measurement Results
in STU-2 (500 m)
Table 4: Comparison of Emission Exposure from
immovable sources, moving sources and measurement
results in STU-2 (500 m)
Emission
Sources
Units
Paramete
r
s
NO
2
CO SO
2
Immovabl
e sources
µgr/Nm
3
1.3600 9.4941 0.9067
Movable
sources
µgr/Nm
3
6.8500
67.217
0
0.0060
Measurem
ent results
µgr/Nm
3
12.030
0
300.00
00
7.4300
Quality
Standar
d
*
µgr/Nm
3
400 30,000 900
*) Government Regulations No. 41 Year 1999
5.5 Comparison of Emission Exposure
from Immovable Sources, Moving
Sources and Measurement Results
in STU-3 (1000 m)
Table 5: Comparison of Emission Exposure from
immovable sources, moving sources and measurement
results in STU-3 (1000 m)
Emission
sources
Units
Paramete
r
NO
2
CO SO
2
Immovabl
e sources
µgr/Nm
3
0.4862 3.6715 0.2928
Movable
sources
µgr/Nm
3
4.9810 48.8640 0.0040
Measurem
ent results
µgr/Nm
3
5.4500
124.000
0
3.4900
Quality
Standar
d
*
µgr/Nm
3
400 30,000 900
*) Government Regulations No. 41 Year 1999
The calculations of emission exposure from mobile
sources in STU-1 for the parameters of NO2, CO and
SO2 were obtained by 16.4576 μgr / Nm3, 161,4469
μgr / Nm3, and 0.0145 μgr / Nm3, respectively. The
calculations of emission exposures from mobile
sources in STU-2 for the parameters of NO2, CO and
SO2 were obtained by 6.85 μgr / Nm3, 67,217 μgr /
Nm3, and 0.006 μgr / Nm3, respectively. The
calculations of emission exposure from mobile
sources in STU-3 for the parameters of NO2, CO and
SO2 were obtained by 4.981 μgr / Nm3, 48.864 μgr /
Nm3, and 0.004 μgr / Nm3, respectively. The results
of the calculation of the amount of ambient emission
exposure from the moving source is greater than the
immovable source. There is a difference between the
results of the calculation and the results of direct
measurement, where the large emissions based on the
calculation is smaller than the measurement results
made. The difference is caused by the existence of
other industrial activities outside the area and the
activity of vehicle transportation around the point of
measurement, especially from Medan-Tanjung
Morawa road.
6 CONCLUSIONS
Based on the results of the discussion in the previous
section the conclusions that can be drawn from this
study are as follows:
1. The cumulative calculation of the emission
exposure from MIA Star Tanjung Morawa
operational inactive sources at a distance of 100
m, 500 m, and 1000 m shows that the resulting
ICNRSD 2018 - International Conference on Natural Resources and Sustainable Development
378

value will be reduced by 50 -70% at each
distance of 400-500 m.
2. The results of calculating the amount of ambient
emission exposure at a distance of 100 m, 500 m,
and 1000 m from transportation activities
(moving sources) are greater than the plant's
operational activities (non-moving sources).
3. Emission exposure at STU-1, STU-2 and STU-3
locations is not only sourced from KIM Star
Tanjung Morawa's operations, but also
influenced by industrial activities and
transportation around the activities.
4. The attitude and perception of the surrounding
community towards pollution caused by the
operation of MIA Star Tanjung Morawa is still
relatively good.
7 SUGGESTIONS
1 Considering the community's perception of
pollutant substances depends on their knowledge
/ education and experience, it is necessary to
conduct socialization to the community around
the Medan Industrial Area (MIA) Star by the
authorized agency.
2 Determination of the location of the industrial
area needs to pay attention to the distance to the
location of the residents.
REFERENCES
Bakar, A.A.M., 2006. Air Quality Distribution in the Oil
and Gas Industry Area Case Study at PT. Pertamina
UP VI Bolongan, Department of Geography FMIPA
University of Indonesia. Indonesia.
Briggs, G.A., 1984. Plume Rise and Buoyoncy Effects, in :
Atmospheric Science and Power Production, ed, D.
Randerson, U.S. Department of Energy, DOE/TUC
27601. pp. 327 – 366.
Capelli, L., Sironi, S., Rosso, R.D., dan Guillot, J.M., 2013.
Measuring Odours in The Environment vs Dispersion
Modelling. Journal Atmosphere Environment. 79
(2013) : 731-743.
Turner, D.B., Workbook of Atmospheric Dispersion
Estimates: An Introduction to Dispersion Modelling,
Lewis Publishers. Boca Raton, FL.
Faisal, 2004. Evaluation of the Use of the Gaussian Model
on the Road Section Prof. Dr. Soepomo Jakarta
Related to the Existence of Trees on the Roadside,
[Thesis]. Diponegoro University. Semarang.
Hoesodo, D., 2004. Air Pollution Modeling Due to Traffic
on Arterial Road, [Thesis]. Diponegoro University.
Semarang.
Irwin, 1998. Environmental Engineering, McGraw-Hill.
Singapore.
IPCC Guidelines for National Greenhouse Gas Inventories,
2006.
Janhall, S., 2015. Review An Urban Vegetation and
Particle Air Pollution – Deposition and Dispersion.
Journal Atmosphere Environment. 105: 130 – 137.
Kusnoputranto. H., 1996. Environmental Toxicology of
Toxic Metals and Hazardous, UI Press. Jakarta.
Laskarzewska, B., Mehrab, M., 2009. Atmospheric
Chemistry in Existing Air Atmospheric Dispersion
Models and Their Aplications :Trend, Advances, and
Future in Urban Area in Ortario, Canada and in Other
Areas of The World. International Journal of
Engineering (IJE). 3(1): 21 – 57.
Manahan, S.E., 2000. Environmental Chemistry. Lewis
Publisher. United States.
Mohamed, M.A.W, Khaled S.M.E., Mokhtar E., and
Sawsan E.M.E, 2013. Derivication the Schemes of
Lateral and Vertical Dispertion Parameters:
Application in Gaussian Plume Model. Open Journal
Air Pollution. 2: 19-24.
Nauli, T., 2002. Pattern of Distrivution of Pollutants from
Chimneys. ISSN 0216 - 3128.
Podrez, M., 2015. An Update To Ambient Ratio Method
for 1 – h NO
2
Air Quality Standards Dispersion
Modeling. Journal Atmosphere Environment. 103: 163
– 170.
Putut, E.L.E., and Widodo, B., 2011. Model Simulation of
Carbon Monoxide Pollutant Dispersion at Toll Gate
Entrance. In Proceedings of the National Seminaar for
Research, Education and Application of Mathematics
and Natural Sciences, Faculty of Mathematics and
Natural Sciences, Yogyakarta State University.
Republic of Indonesia Government Regulatons Number 41
of 1999 concerning Air Pollutant Control.
Rau, J.G., dan Wooten, D.C., 1980. Environmental Impact
Analysis Handbook, Graw Hill Book Company. New
York.
Reible, D.D., 1999. Fundamentals of Environmental
Engineering, Lewis Publishers. United States of
America.
Sugiarti, 2009. Air Pollution Gases and Their Effects on
Human Health. Chemica Journal. 10(1): 50 -58.
Teguh, P., Joko, P.S., 2001. Dust Quality Model in the Air
as the Impact of the Ceper Metal Casting Industry.
Environmental Technology Journal. 2(2): 168 - 174.
Tampubolon, S., 2011. Effect of Wind Speed And Air
Temperature To Carbon Monoxide Contaminant (CO)
In The Air Around Medan Industrial Estate (KIM).
USU Institutional Repository. Medan.
Walck, C., 2007. Hand-book on Statistical Distributions
for Experimentalists. Particle Physics Group University
of Stockholm.
Wardhana, W.A., 2001. Impact of Environmental
Pollution, Publisher Andi Offset. Yogyakarta, 2
nd
Print.
Watkins, K.E., 1991. Many Voices : Defining Human
Resource Development from Different Diciplines, Adult
Education Quarterly. 4(41): 241 – 255.
Witono, D., 2003. Characteristics of Air Pollution in UJB-I
PLTGU Tambak Lorong Semarang (Case Study of SO2
Pollution and Dust Particles). [Thesis].
The Exposure of Emission Gas Pollutant to Residential Area around the Industrial Area: Case Study - Medan Star Industrial Area Tanjung
Morawa Sub District, Deli Serdang District
379
