
The Analysis of "Highest & Best Use" Government Land of Deli
Serdang District
A. P. Sipayung
1
, N Matondang
2
, and H. T. Fachrudin
2
1
Master of Property Management and Valuation Program, Universitas Sumatera Utara, Medan 20155, Indonesia
2
Faculty of Engineering, Universitas Sumatera Utara, Medan 20155, Indonesia
Keywords: Highest & Best Use, Benefit Cost Ratio, Land Owned by the Deli Serdang District Government
Abstract: Government assets were very much in the public spotlight today due to the lack of optimal asset utilization,
which was in accordance with Constitution of Indonesia 2004 No. 32 regarding to the Regional
Government, where the Regional Governments are granted autonomy to regulate and manage government
affairs and when necessary, to optimize the sources of Regional Original Income (PAD), particularly the
revenues from government asset management sector. One of the vacant land owned by Deli Serdang
regency of 22,802 M² located on Jalan Raya Medan - Lubuk Pakam KM 21.5 Tanjung Morawa needed to be
optimized to increase the PAD of Deli Serdang Regency. The Highest and Best Use (HBU) analysis method
was used to further identify the most optimal and beneficial use of the property for such vacant land. The
results obtained in this research was the Product Promotion Center by generating Net Present Value of Rp.
Rp38.142.832.106, - (thirty eight billion one hundred forty two million eight hundred thirty two thousand
one hundred six Rupiah), Internal Rate of Return of 27.92%, Payback Period of 5 years 7 months and
Benefit Cost Ratio of 7.67 and maximum productivity that provided an increase in the value of land from
Rp. 1,003,000, - / M² up to Rp. Rp1,186,591, - / M² or Productivity increased 118%.
1 INTRODUCTION
Utilization of government assets that had not been
optimal in most Regional Governments in Indonesia,
which was in accordance with the Constitution of
Indonesia 2004 No. 32 on Regional Government,
where the Regional Government is given the
autonomy to regulate and manage government
affairs and is required to optimize the sources of
Regional Original Income (PAD), particularly the
revenues from the government asset management
sector. Hence it was necessary to analyze the
utilization and use of land to determine the optimal
land use alternative before implementing the
construction of property on the land, and supports
sustainable properties that are actions and mitigate
negative environmental impacts typically manifested
in green buildings with eco-friendly design
(Fachrudin, 2017).
The assessment use of the Highest and Best Use
method (HBU Method) was the most feasible and
permissible use of an established land or soil, which
was physically feasible, legally permissible, and
financially feasible (Hidayati and Harijanto, 2001).
The HBU analysis was one of the many methods in
analyzing the optimal land use and had the highest
value.
The research will be conducted on one of the
assets owned by Deli Serdang Regency Government
covering 22,802 M² located at Jalan Raya Medan -
Lubuk Pakam KM 21,5 Tanjung Morawa. Currently,
the land is still idle and had not been utilized
optimally while located strategically in the strategic
area of industrial and trading center area thus
making it suitable to be developed into commercial
property such as product promotion center,
warehousing, offices, traditional market and
business hotel . By using Highest and Best Use
method (HBU Method) through physical aspect,
legal aspect, financial aspect and maximum
productivity will be determined land use. In AIREA
(2008: 278) AIREA (2008) said that Highest and
Best Use (HBU) was defined as the most reasonable,
feasible, and legitimate use of vacant land or built-
up land that was physically possible, appropriately
supported, financially feasible, and produced the
highest value of the land. Pratama (2011) also said
that the Highest and Best Use (HBU) on
32
Sipayung, A., Matondang, N. and Fachrudin, H.
The Analysis of "Highest Best Use" Government Land of Deli Serdang District.
DOI: 10.5220/0009897100002480
In Proceedings of the International Conference on Natural Resources and Sustainable Development (ICNRSD 2018), pages 32-37
ISBN: 978-989-758-543-2
Copyright
c
2022 by SCITEPRESS – Science and Technology Publications, Lda. All rights reserved

government-owned vacant land had been done
several times, such as research conducted in North
Jakarta area with the conclusion of the development
of apartment project. A similar study was also
conducted by Supit (2013) on land owned by the
North Sulawesi Provincial Government with the
conclusion of use as a hotel. Pradhani (2013)found
the conclusion of HBU as a mix use of development
on one parcel of vacant land in Mataram City. Then
Manaf, et al. (2013) assessed the efficiency of
property lands and the relationship between land
availability and urban development where land was
a key determinant of development success. The
author also conducted studies of some literature
related to HBU, such as Luce (2012) who examined
a site and office building above it located in
Arlington, Virginia, United States, using HBU
analysis. Rattermann (2008) addressed the theme of
the HBU issue in the assessment to generate market
value.
2 METHODS
The research used Highest and Best Use (HBU)
concept to determine what kind of property was the
most optimum in the object of research by
performing analysis based on physical aspect, legal
aspect, and financial aspect and considering
maximum productivity. The type of research
conducted was quantitative research where
phenomenons could be classified relatively fixed,
concrete, observed, measured and causal symptoms.
The data that had been collected was analyzed in
order to be concluded as the formulated hypothesis
whether it was proven or not (Sugiono 2012).
Table 1: Research Variable
No. Variable Indicator
1. Alternative
Land
Utilization
Alternative Land
Utilization
2. Legal a. Zoning
b
. Building Code.
3. Physical a. Location &
Accessibility
b. State of Utility &
Environmental
Facility
c. Land Tread
Analysis (Shape
and size of lan
d
)
No. Variable Indicator
4. Financial a. Investment Cost
b. Income
c. Expense
d. Cash Flow
5. Maximum
Productivit
y
Land Value
Source : Data Processing, 2018
To facilitate in viewing the conceptual framework of
the research, the researcher described it as followed:
Figure 1: Conceptual Research Framework, 2018
3 RESULTS AND DISCUSSION
The results of land use research for the property that
yielded the highest land value of the land area of
22,802 M² located on Jalan Raya Medan - Lubuk
Pakam KM. 21.5, Tanjung Baru Village, Tanjung
Morawa Sub-district, Deli Serdang District.
Figure 2: Research Object Location. Source: Google Earth
& Field Survey, 2018
The Analysis of "Highest Best Use" Government Land of Deli Serdang District
33

Figure 3: Orientation of Land Location in Tanjung Baru
Village, Tanjung Morawa Sub District. Source : Field
Survey & Peta Rupa Bumi 1:50.000, 2018
3.1 Determination of Alternative Use
The results obtained from the observation of
buildings around the study site, interviews and
delivery of questionnaires to relevant stakeholders
will be studied to obtain the best alternative land
use. The survey results stated that the land located
on Jalan Raya Medan - Lubuk Pakam KM. 21.5,
Tanjung Baru Village, Tanjung Morawa Sub-district
was suitable for commercial property types such as
product promotion center, warehousing and business
hotel.
Table 2: Questionnaire Results Data
Alternative Land Utilization Number of
Respondents
Product Promotion Cente
r
16
Warehousin
g
6
Business Hotel 4
Dr
y
Port 1
One Stop Integrated Service
Office
(
PTSP
)
1
Commercial sports arena 1
Culinar
y
Cente
r
1
Total 30
Source : Data Processing Result, 2018
3.2 Physical Aspect Analysis
Subject to the analysis of physical aspects, there
were several criterias that became used indicators.
They were Location and accessibility, State of
Utility And Environmental Facilities, Land Tread
Analysis (shape and size of land).
3.3 Location and Accessibility
Based on the data, the land had a very convenient
location for commercial property, and had a very
strategic accessibility as it was very close to Tanjung
Morawa Toll Gate, Kuala Namu Airport and the
capital of Lubuk Pakam Regency. The land was also
located at small trading centers and industrial areas
and other commercial public facilities such as
showrooms, shops, warehouses and others, and the
availability of public transportation such as public
transport routes, and other transportation passing
through the land area. This supported the
development of alternative land research objects.
3.4 State of Utilities and
Environmental Facilities
Based on the data and field observations, the
previous land location was for agricultural nursery
and the land currently was idle. For the Utility
facilities around the land, it was also complete and
very adequate with the availability of electricity,
water and telephone lines. The availability of
existing utility facilities will facilitate the property
owner for any activities used on the land.
3.5 Land Tread Analysis
Based on the data and size in the field, the land was
an area of ± 22,802 m², land in the form of a plot of
land with a parallelogram, where the front width
facing Jalan Raya Medan - Lubuk Pakam ± 82
meters and extended to the rear for ± 278 meters.
With the shape and size of existing land, it was very
possible and suitable to use it as a building that had a
wide and flexible space functions, besides the
unique and strategic frontage. The overall object
topography was relatively flat, with the elevation of
the ground plane ± 0.2 meters higher than the road,
where the research object currently was empty.
Table 3: Result of Land Physical Aspect Analysis
Physical
Aspects of
Land
Use As
Product
Promotion
Cente
r
Use as
Warehouse
Use As
Business
Hotel
Size Possible Possible Possible
Shape And
Usefulness
Possible Possible Possible
Fronta
g
e Possible Possible Possible
Ease of
Access
Possible Possible Possible
Availabilit
y
of
Possible Possible Possible
ICNRSD 2018 - International Conference on Natural Resources and Sustainable Development
34
Utilities
Locations
in the
Market
area
Possible Possible Possible
Topograph
y
Possible Possible Possible
Source : Data Processing Result, 2018
3.6 Legal Aspect Analysis
Legal aspect analysis was done to avoid the misuse
of land use which had been stipulated in the rules
and regulations that apply. To be legally permitted
on the research field, referring to Constitution of
Indonesia (2007) No. 26 on Spatial Planning.
Government Regulation (2000) No.25 Concerning
Government Authority and Provincial Authority as
Regional Autonomy For land use (Zoning) in this
area was planned as a mixed area between processed
industries, trade, transportation services and
warehousing, adjusted to Detailed Spatial Plan
(RDTR), and City Space Engineering Plan (RTRK)
which were derived from the National Spatial Plan.
In general, some of the above planning were also
supported by the Draft of Regional Spatial Planning
(RTRW) of Deli Serdang 2017 and adjusted to the
regulation stated in Presidential Regulation 62
(2011) regarding to Regional Spatial Plan (RTRW)
Urban Area of Mebidangro which already had legal
provisions. Based on land allocation (Zoning) from
three alternative land uses that were:
- Product Promotion Center
- Warehousing
- Business
There were only two legally permitted land use
alternatives. They were:
- Product Promotion Center
- Warehousing
For the Building Code regulation which took effect
at the location of research objects, it was
strengthened with observation of the surrounding
land, which was as followed:
- Basic Building Coefficient (KDB) maximum: <60-
70%
- Building Border Line (GSB) maximum: 12 m
- Green Basic Coefficient (KDH) minimum: > 30-
40%
- Floor Coefficient of Building (KLB): 1.5
- Border Line Fence (GSP) Side: 0 - 3 m
- Border Line Fence (GSP) Rear: 0 - 3 m
- The height of the building was in accordance with
the feasibility of building requirements.
(source: Kuala Namu Airport Authority).
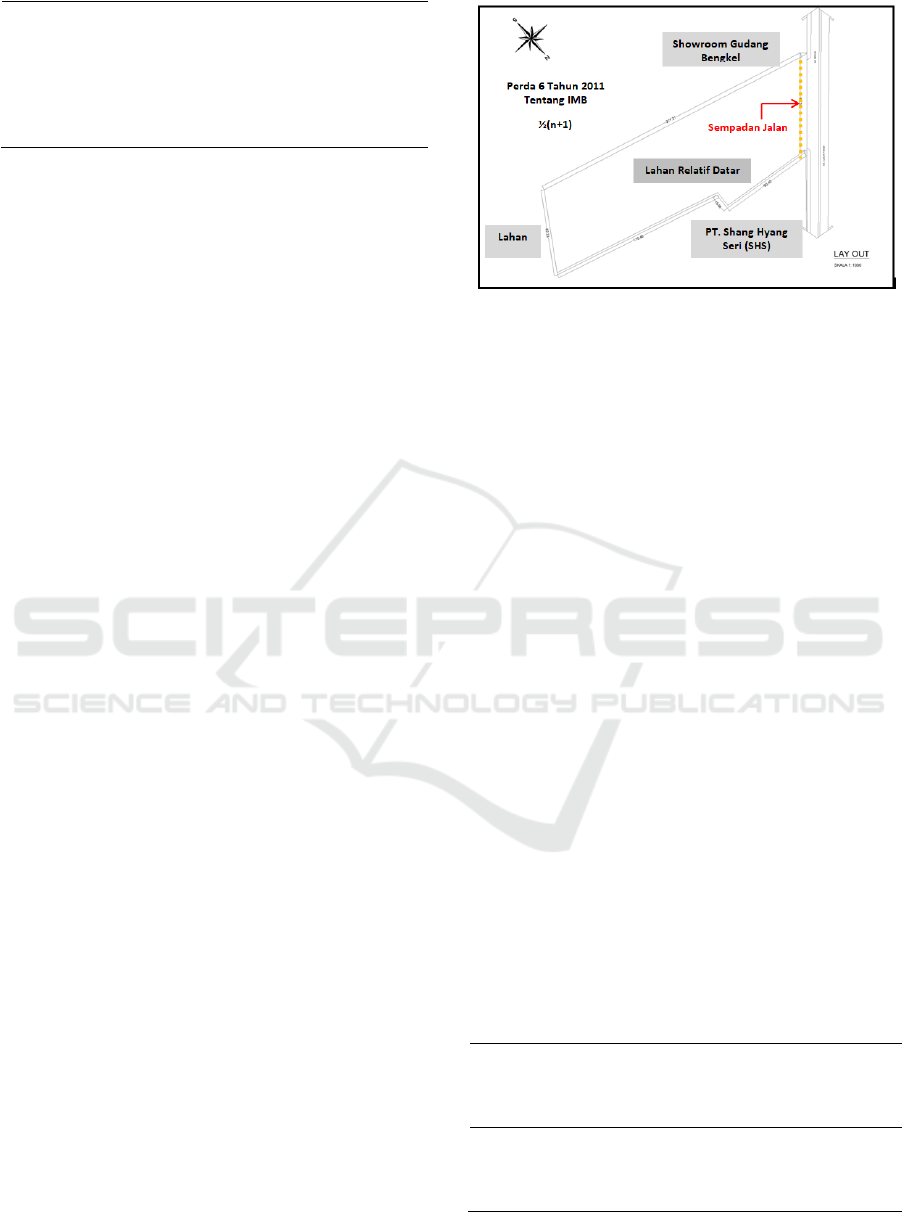
Figure 4: Shape and Size of Field Research. Source:
Housing and Settlement Area of Deli Serdang District
2018
With the analysis of legal aspects based on the
description above, it could be summed up as
followed:
a. Product promotion center
Total land area 22,802 M² with Building Area 60%
from 22,802 M² area, that was ± 13,681 M², and
based on Neufert Architect Standards, 15% of
constructed land will be devoted to Circulation and
Space.With a total area of 13,123.38 M² or about
57.55%, it was still below the Building Coverage
Ratio (KDB) maximum 70%, while for the Green
Coverage Area (KDH) of 9,678.62 M² or about
42.45% was considered appropriate with a minimum
of 30% of the land area. The design of the Site Plan
for utilization as an alternative to the Product
Promotion Center met the applicable regulations.
b. Warehousing
With a total area of 13,613,00 M², or about 59,70%
that was still below the Building Coverage Ratio
(KDB) maximum 70%, while for the Green
Coverage Area (KDH) it was 8,803 M² or about
40,30%, which was in accordance with the minimum
terms of 30% of the land area. The site layout design
for utilization as an alternative Warehouse also
satisfied the regulatory requirements described
above.
Table 4: Result of Analysis of Land Legal Aspects
Legal
Aspects
of Land
Use As
Product
Promotion
Cente
r
Use As
Warehousing
Use As
Business
Hotel
Zoning Permitted Permitted Not
Permitte
d
Building
Code
Permitted Permitted Not
Permitte
d
Source : Data Processing Result, 2018
The Analysis of "Highest Best Use" Government Land of Deli Serdang District
35

3.7 Financial Aspect Analysis
After performing analysis of physical aspect and
legal aspect, the next step was to analyse the
financial aspect. These financial aspect analysis
included criterias, investment costs, revenues,
expenses, and cash flows.
3.7.1 Financial Aspect Analysis
After performing analysis of physical aspect and
legal aspect, the next step was to analyse the
financial aspect. These financial aspect analysis
included criterias, investment costs, revenues,
expenses, and cash flows.
3.7.2 Investment Costs Planning
Planning of the investment costs consisted of land
expenses, consultant costs and construction costs.
For investment cost of each alternative, it could be
seen in Table 5.
Table 5: Investment Costs
Use As Product
Promotion Cente
r
Use As Warehousing
11.086.178.015,46 30.284.899.593,64
Source : Data Processing Result, 2018
3.7.3 Revenue Planning
The revenue planning for the alternative buildings
were projected to come from the leasing of building
function, service charge and parking revenue. The
projected revenues could be seen in Table 6.
Table 6: Revenues
Year Use As Product
Promotion
Cente
r
Use As
Warehousing
1
1.074.720.315 1.367.976.250,00
2
1.888.374.002 2.797.151.437,50
3
2.780.786.373 3.572.037.984,38
4
3.092.267.871 3.750.639.883,59
5
3.602.739.755 3.938.171.877,77
6
3.789.747.940 4.594.533.857,40
7
3.986.553.162 4.824.260.550,27
8
4.193.674.303 5.065.473.577,79
9
4.411.658.078 5.318.747.256,68
10
4.641.080.545 5.584.684.619,51
Source : Data Processing Result, 2018
3.7.4 Expenditure Planning
The revenue planning for the alternative buildings
were projected to come from the leasing of building
function, service charge and parking revenue. The
projected expenditures could be seen in Table 7.
Table 7: Expenditures
Year Use As Product
Promotion
Cente
r
Use As
Warehousing
1 260.594.853,00 6.130.350,00
2 547.249.191,30 12.534.952,50
3 861.917.476,30 16.007.473,13
4 946.904.112,29 16.652.218,57
5 1.118.530.482,
64
17.484.829,50
6 1.174.457.006,
77
20.398.967,75
7 1.209.160.418,
92
21.218.739,35
8 1.269.618.439,
86
22.279.676,32
9 1.333.099.361,
86
23.393.660,13
10 1.399.754.329,
95
24.563.343,14
Source : Data Processing Result, 2018
3.7.5 Capital Budgeting Analysis
The feasibility indicators of a project could be
foreseen using the Capital Budgeting technique, as
for the techniques in Capital Budgeting such as
using NPV, IRR, Pay-back Period, and Benefit Cost
Ratio. The analyses were used to determine the
feasibility level of the project and to find out how
substantial the alternative options were capable of
creating a reasonable rate of return for the fund
provider. The following was the result of financial
feasibility analysis on the development of each
alternative, which could be seen in Table 8.
Table 8: Financial Feasibility Alternative Development
Financial
Indicators
Use Of Pro
p
ert
y
Product
Promotion
Cente
r
Warehouse
Net Present
Value (NPV)
38.142.832.106,81 22.924.450.185,16
Internal Rate of
Return
(
IRR
)
27.92 % 9.46 %
Payback Period
(
PBP
)
5.75 8.25
Benefit Cost
Ratio
(
BCR
)
7.67 0.74
Source : Data Processing Result, 2018
ICNRSD 2018 - International Conference on Natural Resources and Sustainable Development
36

3.7.5 Maximum Productivity for Alternative
Use of Property
The highest land value indication or property choice
that gave the maximum productivity was the use of
Product Promotion Center with indication of land
value post use was Rp.1.186.591, - (one million one
hundred eighty six thousand five hundred ninety one
Rupiah) or an increase of 118 percent. For
warehouse use there was a 32 percent drop in land
value.
Table 9: Indication of Land Value Based on Property Use
Use of property R
p
/ Mete
r
Vacant Land
Market
Indicato
r
Warehouse
Product
Promotion
Cente
r
Rp
1.003.000,00
Rp
1.186.591,27
Warehouse Rp
1.003.000,00
Rp
(322.798)
Source : Data Processing Result, 2018
4 CONCLUSION
Based on the results of the above comparison, the
development of the Product Promotion Center met
the 5 (Five) best eligibility criteria, namely NVP,
IRR, BCR & Maximum Largest Productivity and
Minimum Payback Period (PBP). Thus, the
preferred alternative suggested to be developed on
the land that belonged to the Government of Deli
Serdang Regency located on Jalan Raya Medan -
Lubuk Pakam KM. 21.5 Tanjung Baru Village,
Tanjung Morawa Sub-district, Deli Serdang
Regency, North Sumatera Province was the Product
Promotion Center.
REFERENCES
AIREA, 2008, The Appraisal of Real Estate, Appraisal
Institute, Chicago
Hidayati dan Harijanto, 2001. Konsep Dasar Penilaian
Properti. BPFE:Yogyakarta.
Hilma Tamiami Fachrudin and Khaira Amalia Fachrudin,
2017. Sustainable Property Application from Various
Perspectives. International Business Management, 11:
1343-1347.
Luce, Anthony J., 2012, Highest and Best Use Analysis
for a Site in Arlington, VA, Thesis for Master Degree
of Science in Real Estate, Johns Hopkins Carey
Business School (Published).
Manaf, Azima Abdul, Er, A. C., O, Ismail, Lyndon, N.,
Sivapalan, S., Hussain, M. Yusof, Saad Suhana,
Zaimah, R., Sarmila, M. S., Fuad, M. J., 2013,
Property Market Efficiency: Developed or Vacant
Property, Asian Social Science, Volume 9, No. 14,
Canadian Center of Science and Education.
Peraturan Pemerintah No.25 Tahun 2000 Tentang
kewenangan Pemerintah dan Kewenangan Provinsi
sebagai Otonomi Daerah.
Perpres 62 Tahun 2011 perihal Rencana Pola Ruang
Kawasan (RTRW) Perkotaan Mebidangro.
Pradhani, M. Gigih, 2013, “Analisis Highest and Best Use
terkait Build Operate Transfer (BOT) pada Lahan
Kosong Milik Pemerintah Provinsi Nusa Tenggara
Barat (Studi pada Lahan Kosong di Jalan Ismail
Marzuki Kelurahan Cilinaya Kecamatan Cakranegara,
Kota Mataram, Provinsi Nusa Tenggara Barat)”, Tesis,
Sekolah Pasca Sarjana UGM Yogyakarta (Naskah
Publikasi).
Pratama, Ade Rizki, 2011, “Analisis Pemanfaatan Lahan
Kosong Milik Pemerintah Provinsi DKI Jakarta
dengan Metode HBU (Studi pada Lahan Kosong di
Jalan Madya Kebantenan, Kelurahan Samper Timur,
Kecamatan Cilincing, Jakarta Utara)”, Tesis, Sekolah
Pasca Sarjana UGM Yogyakarta (Naskah Publikasi).
Rattermann, Mark R., 2008, Highest And Best Use
Problem in Market Value Appraisals, The Appraisal
Journal.
Sugiyono, 2012, Metode Penelitian Kuantitatif Kualitatif
dan R&D. Bandung: Alfabeta.
Supit, Olivia, 2013, “Analisis Highest and Best Use Aset
Tanah Milik Pemerintah Provinsi Sulawesi Utara
(Studi Kasus di Jalan Trans ManadoBitung Kelurahan
Kairagi I Kecamatan Mapanget, Kota Manado)”,
Tesis, Sekolah Pasca Sarjana UGM Yogyakarta
(Naskah Publikasi).
Undang-Undang No. 26 Tahun 2007 Tentang Penataan
Tata Ruang
The Analysis of "Highest Best Use" Government Land of Deli Serdang District
37
