Gear Fault Diagnosis Based on Support Vetor Machine
Xingyan Yao*, Chuanwen Liu and Xiping He
Chongqing Engineering Laboratory for Detection Control and Integrated System,Chongqing Technology and Business
University,Chongqing, China
Corresponding author: yaoxingyan-jsj@163.com
Keywords: Gear, fault diagnosis, support vector machine.
Abstract: Vibration signals analysis are commonly used in mechanical fault diagnosis, especially in vehicles. The
vibration signal contains the information of fault in the gear failure, but this information does not directly
characterize all kinds of faults. The feature of fault types of the acceleration signal in time-frequency domain
was firstly obtained in the time domain and frequency domain analysis. And wavelet packet decomposition
analysis is adopted in time-frequency domain analysis. The support vector machine classification was
employed to get the fault characteristic. The results show that, the energy spectrum feature of time-frequency
based on wavelet decomposition is the best choices for the fault identification of gear.
1 INTRODUCTION
Nowadays, many researchers focus on maintenances.
According to the previous studies, maintenance costs
take up great proportion of total operation costs (Yao
2013, Yao 2016). Early detection of the defects is one
of key parts to prevent systems from malfunction
which cause damage or entire system faults.
Vibration signal analysis has been widely used in
machinery condition monitoring and fault diagnosis.
Gear plays a key role as connecting of transmission
in mechanical systems, the system will break down
when it fails to work. Therefore, it is necessary to
make fault diagnosis of gears (Wang 2012, Lei 2012).
Until now, many kinds of methods have been used
to machines fault diagnosis (Guo 2009, Qin 2012,
Jiang 2013). Due to the high accuracy and good
classification, support vector machines (SVMs) has
been widely used in many areas of machine learning.
SVMs are a kind of methods based on statistical
theory. Owing to the principle of risk minimization,
the SVMs classifies can better classify than artificial
neural network. The structural risk minimization
(SRM) is used to minimize an upper bound on the
expected risk in SVMs. SVMs model is a type of
methods to find the optimization problem.
This paper uses SVMs to classify the gear’s
features. The energy spectrum feature of time-
frequency based on wavelet decomposition is
employed to identify the fault of gears.
2 SUPPORT VECTOR MACHINE
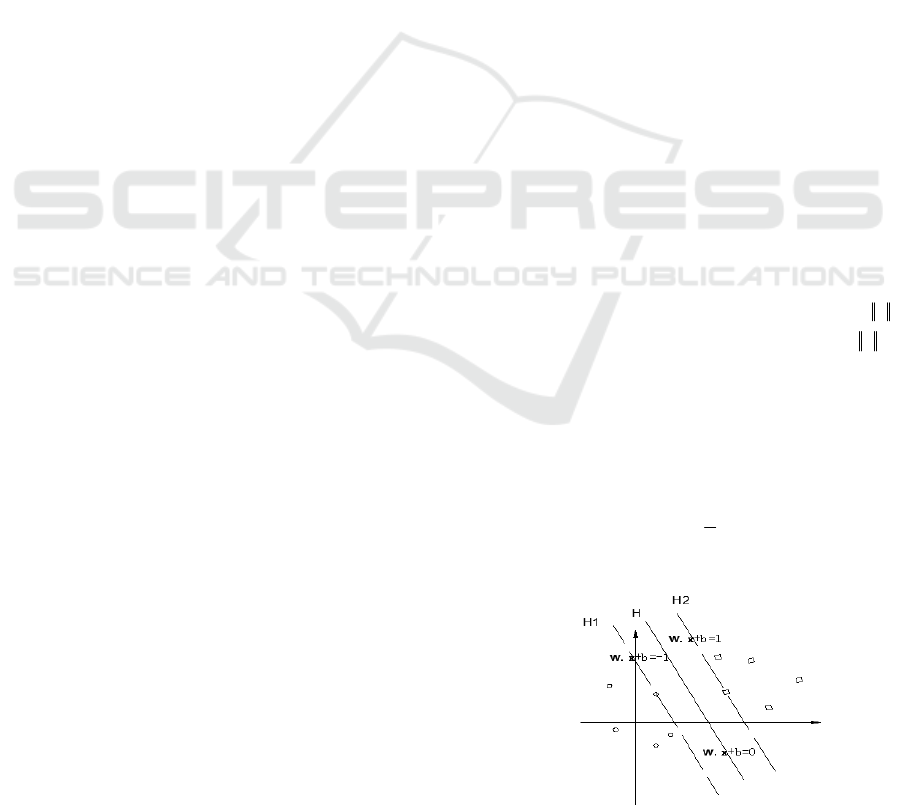
In Figure 1, the distance between H1 and H2 is
2/ w
.
The maximum distance is the minimum
/2w
without any samples. The two equation
.1,1
ii
by+≥+ =+wx
and
.-1,-1
ii
by+≤ =wx
can be
merge as
[( . ) ] 1 0, 1, 2,...,
ii
ybin+−≥ =wx
. Therefore,
the Eq. (1) and Eq. (2) is solved by constructing the
optimal hyper plane to classification:
2
,
1
min || ||
2
bw
w
(1)
S.t
[( . ) ] 1 0, 1, 2,...,
ii
y
bi n+−≥ =wx (2)
Figure 1 Support vector machines interval
146
Yao, X., Liu, C. and He, X.
Gear Fault Diagnosis Based on Support Vetor Machine.
In 3rd International Conference on Electromechanical Control Technology and Transportation (ICECTT 2018), pages 146-149
ISBN: 978-989-758-312-4
Copyright © 2018 by SCITEPRESS – Science and Technology Publications, Lda. All rights reserved

This is a convex quadratic programming
optimization problem, the function of Lagrange was
introduced as Eq. (3) to obtain the solution of
problem.
1
1
L( , , ) { [ . ] 1}
2
n
T
ii i
i
byb
α
=
=− +−
∑
w α ww wx
(3)
Where
0
i
α
≥
is the Lagrange multiplier. Partial
derivatives for b and w, and ensure the partial
derivatives are zeroes. According to Eq.(3), the dual
form is obtained as Eq. (4).
111
1
L( , , ) ( . )
2
nnn
iijijij
iij
byy
ααα
===
=−
∑∑∑
w α xx
(4)
Therefore, the classification was obtained by the
dual quadratic solution in Eq.(5) and Eq.(6).
111
1
max ( . )
2
nnn
iijijij
iij
yy
α
ααα
===
−
∑∑∑
xx
(5)
n
1
. . 0, 0, 1, 2,...,
ii i
i
s
ty i n
αα
=
=≥=
∑
(6)
It is a convex quadratic problem, and it has unique
solution with inequality constraints. If
*
i
α
is the
optimal solution,
ii
n
i
i
y
xw
∑
=
=
1
**
α
. According to the
condition of Karush-Kuhn-Tucker, the convex
quadratic problem satisfied Eq. (7).
** *
[ ( . ) 1] 0( 1,..., )
ii i
yb in
α
+−==wx
(7)
In Eq.(6),when
*
0
i
α
≠
, the threshold value
*
b
is
obtained, and the final model is expressed by Eq.(8).
** * *
1
( ) sgn[( . ) ] sgn[ ( . ) ]
n
ii i
i
f
byb
α
=
=+= +
∑
xwx xx
(8)
A slack variable
0≥
i
ξ
is introduced in the
constraint condition for the undivided linear. So the
constraint condition can be obtained by Eq.(9).
[( . ) ] 1 0, 1, 2,...,
ii i
y
bin
ξ
+−+≥ =wx (9)
If a cost
i
ξ
was given for every slack variable,
then the objective function changes to Eq.(10).
2
1
1
||w||
2
n
i
i
C
ξ
=
+
∑
(10)
As to nonlinear problems, a nonlinear mapping
was used to make sure the samples maps to high-
dimensional space. In the high-dimensional space, a
linear classifier was used to classify. An appropriate
kernel function was selected in the training process,
and it do not to define the mapping function. The
kernel function is obtained by the inner product of
two feature space functions
)().(),( yxyx
φ
φ
=K
.
3 FEATURE EXTRACTION OF
GEAR FAULT SIGNAL
In this section, three kinds of feature representations
of vibration signals from time-frequency, time and
frequency domain are adopt, each is used as the input
parameters of SVMs model.
3.1 Time domain feature
In time domain feature, calculating the average, root
mean square value (RMS), the variance, the square
root of the magnitude of the peak, kurtosis, skewers,
waveform index, peak indicators, pulse index, margin
index, kurtosis indicators were taken as features.
3.2 Frequency domain feature
Gear faults usually occurs accompanies with
changing of frequency. In order to analyze the
features of faults, the signals can be transformed into
frequency domain by Fast Fourier Transform (FFT).
Suppose
)(nx
is a discrete signal, the discrete
Fourier Transform DFT is obtained by Eq.(11).
π2
1
()
0
X( ) ( ) , 0,1, , 1
N
jnk
N
n
kxne k N
−
−
=
==−
∑
K
(11)
Since the
nk
N
j
e
)
2
(
π
not only has the characteristic of
symmetry, but also of periodicity and reducibility,
some of items in Eq.(11) are merged. The amount of
calculation is reduced by decomposing the long
sequence to short sequence.
In frequency domain, the gravity of frequency
spectrum, the harmonic factor, the root mean square
value N band are the fault features.
3.3 Time-frequency domain feature
Decomposing original signals to eight frequency
bands by three wavelet packages layers, every
frequency band energy is time-frequency features in
Eq.(12).
2
(, ) | ()|
j
n
k
Ejn x k=Σ
(12)
Where k=1,2,3,…,N, and N is the sampling
number, k is the coefficient of the reconstructed
signal decomposition series number. The
decomposition scale is j, decomposition series
number is n ( n=0,1,2,..
1-j
2
) , and the k-th
coefficient of n-th decomposition series number is
)(
j
n
kx
.
Gear Fault Diagnosis Based on Support Vetor Machine
147
Decomposing original signals by three wavelet
package layers, the energy eigenvectors features of
three layers are expressed as Eq.(13).
[(3,0),(3,1),...,(3,7)]TE E E=
(13)
4 EXPERIMENTAL SET UP
In this section, the vibration signal collection of gear
experimental setup is depicted in Figure 2. The
conditions of signal collection and fault numbers of
gears are described in the Table1 and Table 2,
respectively.
The gear experimental setup contains six parts:
the motor is to drive the gear, the gear box with four
gear and six bearing, the load, the vibration sensor,
the signal acquisition card and computer.
Figure 2 Experimental setup
In Figure 2, Z1, Z2, Z3, Z4 are four different
gears, and the numbers of each gear are 27, 53, 53,
80.B1, B2, B3, B4, B5, B6 are six bearings. The
working conditions of the signal collection are listed
in Table 1. 10 fault patterns are collected as
OriVibrSig102 to OriVibrSig205, respectively. In
different working conditions, 3000 training samples
and 3000 testing samples were selected, respectively.
Table 1 Working conditions of signal collection
Paramete
r
Value
Sampling frequency 44100HZ
Sampling
p
erio
d
10s
Powe
r
1000W
Minimum s
p
ee
d
700RPM
Maximum s
p
ee
d
1600RPM
Minimum loa
d
250W
Maximum loa
d
750W
Table 2 Description of each fault condition
Fault number Description
OriVibrSig102 Z1pitting, B3 outer ring pitting
OriVibrSig103 Z2 0.4mm gear face wear,Z1
p
ittin
g
OriVibrSig104 Z1 pitting, 0.4mm gear face
wear,B2 outer ring pitting,B3
inner ring pitting
OriVibrSig105 Z1 pitting,Z3 gear pitting,Z4 split
OriVibrSig106 Z3 gear tooth pitting,Z1 pitting
OriVibrSig201 B2 outer ring pitting, B3 inner
ring pitting
OriVibrSig202 Z2 100% fracture tooth, B2 outer
ring pitting
,B3 inner ring pitting
OriVibrSig203 Z2 100% gear split,B3 inner ring
p
itting
OriVibrSig204 Z2 split ,B2 ball spitting,B3 inner
ring pitting
OriVibrSig205 Z2 20% fracture tooth, B2 ball
s
p
ittin
g
,B3 inner rin
g
p
ittin
g
5 RESULTS AND DISCUSSION
In this section, the performance of SVMs model for
gear fault diagnosis are evaluated based on time
domain, frequency domain and time-frequency
domain of vibration signals. Every fault has 600
samples, therefore, there are 6000 samples totally.
The odd lines of each type of fault samples were
selected as the training sample, and the even lines as
the testing samples.
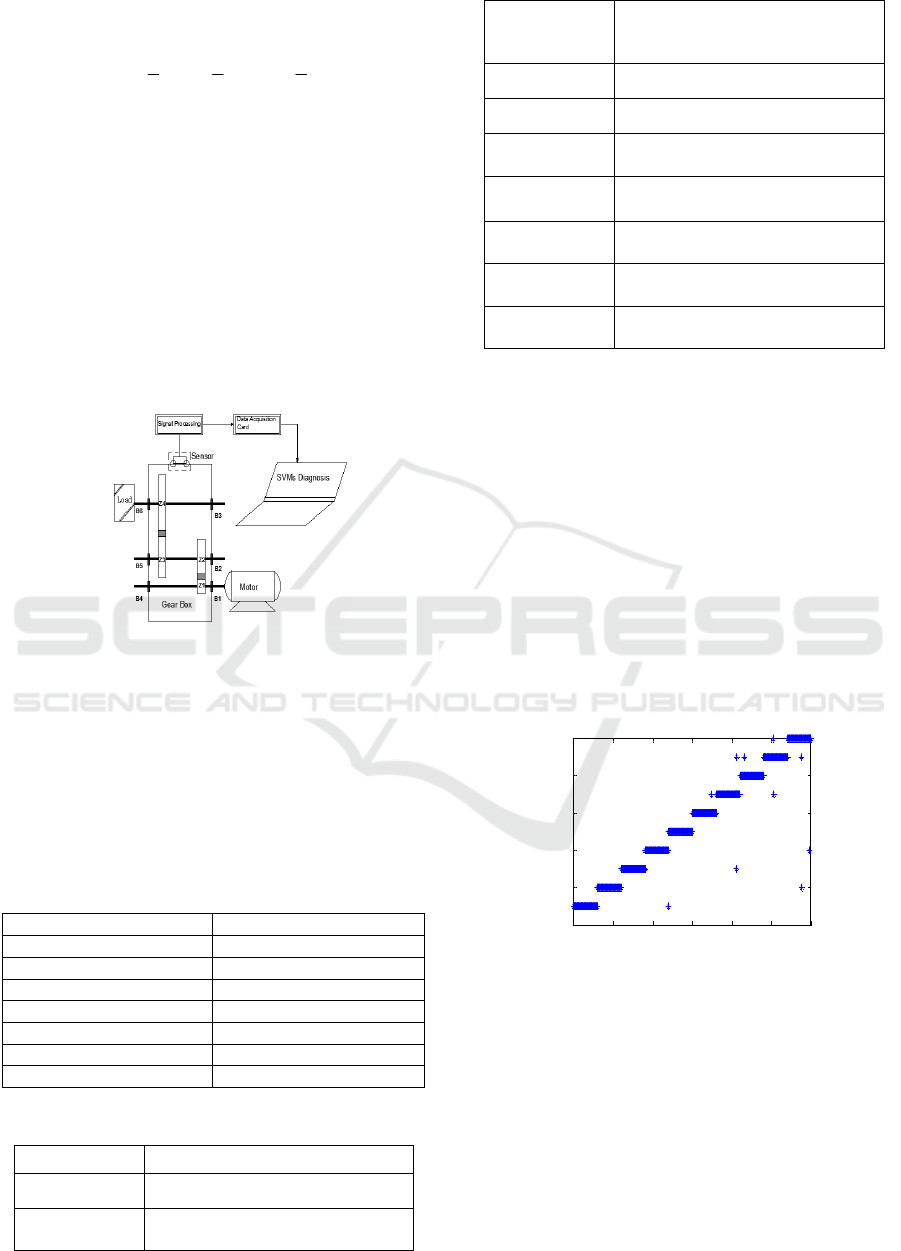
5.1 The classification result of time
domain
Figure 3 Classification in time domain
As can be seen in Figure 3, 11 dimension time
domain eigenvector features representing samples
were obtained by time domain analysis. By SVMs,
the classification of time domain can be obtained.
Except the isolated points were wrong classified, the
classification accuracy of the other samples is 99.6%.
0 500 1000 1500 2000 2500 3000
0
2
4
6
8
10
p
samples
labels
ICECTT 2018 - 3rd International Conference on Electromechanical Control Technology and Transportation
148
5.2 The classification result of
frequency domain
Figure 4 Classification in frequency domain
17 dimension time domain eigenvector features
representing samples by frequency domain analysis
in figure 4. The classification by time domain was
obtained by SVMs. The classification accuracy of the
other samples is 99.033% except the isolated points.
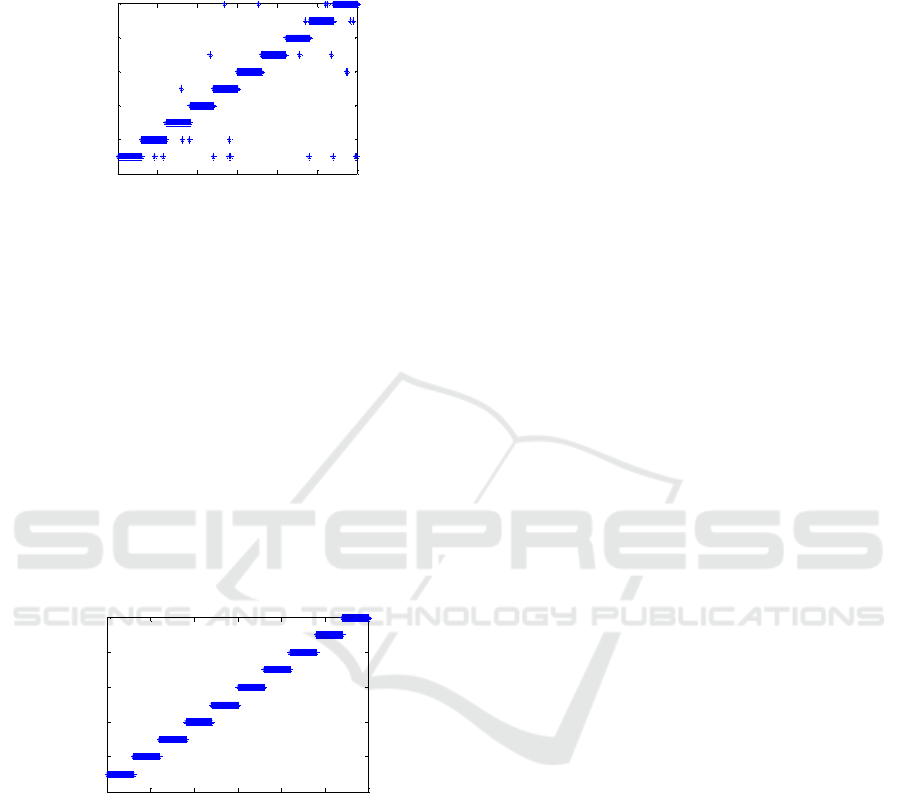
5.3 The classification result of time-
frequency domain
Viewing from Figure 5, after time-frequency domain
analysis from 8 dimension time-frequency domain
eigenvector features, the classification was obtained,
the classification accuracy of the other samples is
99.7% in time domain.
Figure 5 Classification in time- frequency domain
From the above analysis of three domains, not
much classification accuracy differences exists
between time domain classification and frequency
domain classification, the time-frequency domain is
the best choice. In time-frequency domain, all the
3000 testing samples can be correctly classification.
Compared with time domain contains time
information, and frequency domain also only includes
the frequency information, the wavelet
decomposition can reflect the frequency of fault gear
in different time, therefore, time-frequency can better
describe the fault features.
6 CONCLUSIONS
In this paper, the performance of SVMs model for
fault diagnosis of gears is evaluated. Time domain,
frequency domain and time-frequency domain were
used to classify. Compared with the time domain and
frequency domain classification, the energy spectrum
feature of time-frequency based on wavelet
decomposition is the best choices to the fault
identification of gears.
ACKNOWLEDGMENT
This work is partially supported by the National
Natural Science Foundation of China (51605061),
Chongqing Research Program of Basic Research and
Frontier Technology (cstc2017jcyjAX0183), Science
and Technology Research Project of Chongqing
Municipal Education Committee (KJ1500627),
Startup Project of Doctor Scientific Research (2016-
56-04), School Projects of Chongqing Technology
and Business University (1552003), and Open Grant
of Chongqing Engineering Laboratory for Detection
Control and Integrated System.
REFERENCES
Chen, F., Tang, B., & Chen, R. 2013. A novel fault
diagnosis model for gearbox based on wavelet support
vector machine with immune genetic
algorithm.Measurement,46(1), 220-232.
Guo, L., Chen, J., & Li, X. 2009. Rolling bearing fault
classification based on envelope spectrum and support
vector machine. Journal of Vibration and
Control,15(9), 1349-1363.
Lei, Y., Kong, D., Lin, J., & Zuo, M. J. 2012. Fault
detection of planetary gearboxes using new diagnostic
parameters. Measurement Science and
Technology,23(5), 055605.
Qin, Q., Jiang, Z. N., Feng, K., & He, W. 2012. A novel
scheme for fault detection of reciprocating compressor
valves based on basis pursuit, wave matching and
support vector machine. Measurement,45(5), 897-908.
Wang, Y., He, Z., Xiang, J., & Zi, Y. 2012. Application of
local mean decomposition to the surveillance and
diagnostics of low-speed helical gearbox.Mechanism
and Machine Theory,47, 62-73.
Yan, Y. X., Hui, L. X., Yu, M., Fu, J., & Dong, L. H. 2013.
Dynamic response time of a metal foam magneto-
rheological damper.Smart materials and structures,
22(2), 025026.
Yao, X., Liu, C., Liang, H., Qin, H., Yu, Q., & Li, C. 2016.
Normal force of magnetorheological fluids with foam
metal under oscillatory shear modes.Journal of
Magnetism and Magnetic Materials,403, 161-166.
0 500 1000 1500 2000 2500 3000
0
2
4
6
8
10
qp
samples
la be ls
0 500 1000 1500 2000 2500 3000
0
2
4
6
8
10
samples
labels
Gear Fault Diagnosis Based on Support Vetor Machine
149
