
Enhancing Software Development Process Quality based on Metrics
Correlation and Suggestion
Sarah Dahab
1
, Erika Silva
1
, Stephane Maag
1
, Ana Rosa Cavalli
1,2
and Wissam Mallouli
2
1
SAMOVAR, Telecom SudParis, Universit
´
e Paris-Saclay, France
2
Montimage R&D, Paris, France
Keywords:
Software Engineering, Metrics Combination, Reuse, Suggestion, Correlation.
Abstract:
To improve software quality, it is necessary to introduce new metrics with the required detail and increased
expressive power, in order to provide valuable information to the different actors of software development.
In this paper we present two approaches based on metrics that contribute to improve software quality deve-
lopment. Both approaches are complementary and are focused on the combination, reuse and correlation of
metrics. They suggest to the user indications of how to reuse metrics and provide recommendations after
the application of metrics correlation. They have been applied to selected metrics on software maintainabi-
lity, safety, security etc. The approaches have been implemented in two tools, Metrics Suggester and MINT.
Both approaches and tools are part of the ITEA3 MEASURE project and they have been integrated into the
project platform. To illustrate its application we have created different scenarios on which both approaches
are applied. Results show that both approaches are complementary and can be used to improve the software
process.
1 INTRODUCTION
Requests to improve the quality of software are incre-
asing due to the competition in software industry and
the complexity of software development (Akbar et al.,
2018) integrating multiple technology domains (e.g,
IoT, Big Data, Cloud, Artificial Intelligence, Security
Technologies).
In addition, metrics start to play a crucial role
to improve software quality development. To select
the right metrics is also of prime importance for a
successful software development. They have a strong
impact on developers actions and decisions (Hauser
and Katz, 1998).
In order to improve the software quality, we need
to introduce new metrics with the required detail and
automation. Due to the modern development practi-
ces, new tools and methods, the traditional metrics
and evaluation methods are not sufficient anymore.
Even more, there is a large body of research related to
software metrics that aims to help industry while me-
asuring the effectiveness and efficiency of used soft-
ware engineering processes, tools and techniques to
help management in decision-making (Bouwers et al.,
2013).
To achieve software quality, it is required to in-
tegrate new metrics based on constraints combining
safety (the system always behaves as it is supposed
to) and security (authentication, data protection, con-
fidentiality and quality of service,...). Green metrics
also become relevant as they contribute to the re-
duction of energy consumption.
This paper focuses on the combination, reuse, sug-
gestion and correlation of metrics. We have deve-
loped two approaches, one based on metrics reuse,
combination and suggestion and the other on me-
trics correlation. They have been implemented in
two tools, Metrics Suggester and Metrics Intelligence
Tool (MINT). Both approaches contribute to improve
software quality development proposing new techni-
ques for metrics application and evaluation.
Regarding the Metrics Suggester approach, it is
based on the optimization of the current measurement
process which are manual and static and thus very
costly, by proposing an automated analysis and sug-
gestion as an approach, by using the learning techni-
que Support Vector Machine
1
(SVM), based on AI al-
1
http://www.statsoft.com/Textbook/Support-Vector-
Machines
120
Dahab, S., Silva, E., Maag, S., Cavalli, A. and Mallouli, W.
Enhancing Software Development Process Quality based on Metrics Correlation and Suggestion.
DOI: 10.5220/0006856501200131
In Proceedings of the 13th International Conference on Software Technologies (ICSOFT 2018), pages 120-131
ISBN: 978-989-758-320-9
Copyright © 2018 by SCITEPRESS – Science and Technology Publications, Lda. All rights reserved
gorithms. In summary, it consists of suggesting rele-
vant and efficient measurement plans at runtime using
a machine learning algorithm.
Regarding the MINT approach, the idea is to iden-
tify and design correlations between metrics that con-
tribute to the improvement of the development pro-
cess and help developers to take decisions about it.
The proposed correlations cover all aspects of the sy-
stem like functional behavior, security, green compu-
ting and timing. For instance, we have defined cor-
relations covering different phases of development.
Also, correlation of two metrics from the same de-
velopment phase or from different phases, this last to
calculate the same metric at different times. Techni-
ques to correlate metrics are provided and recommen-
dations are given as an outcome to the developer and
project manager. Recommendations will affect their
actions and decisions.
Both techniques are original and introduce inno-
vation with respect to classical methods. Moreover,
the application to the combination of metrics regar-
ding software development, security and green com-
puting is a novelty with respect to them.
Both approaches and tools are part of the Euro-
pean ITEA project MEASURE and they have been
integrated in the project platform
2
. Furthermore, in
order to reach that result, a close link has been defi-
ned between academia and industry for several years
strengthened by the EU HubLinked project
3
fostering
the U-I relationships (Universities-Industry).
In summary, the main contributions of this paper are:
- the design of new approaches to improve soft-
ware quality development process by introduction of
new correlation and suggestion techniques, these last
based on AI algorithms;
- the development of techniques and tools, Metrics
Suggester and MINT, for metrics correlation, reuse,
suggestion, and recommendation.
- a first functional experimentation of both tools.
This paper is organized as it follows: Section II gi-
ves a view of the MEASURE global platform and pre-
sents the two approaches and the tools, Metrics Sug-
gester and MINT. Section III is devoted to presenting
the experiences that illustrate experiments. Section
IV presents the related works and Section V gives the
conclusion and perspectives of our work.
2
https://itea3.org/project/measure.html
3
http://www.hublinked.eu/
2 PROPOSED APPROACHES
AND TOOLS
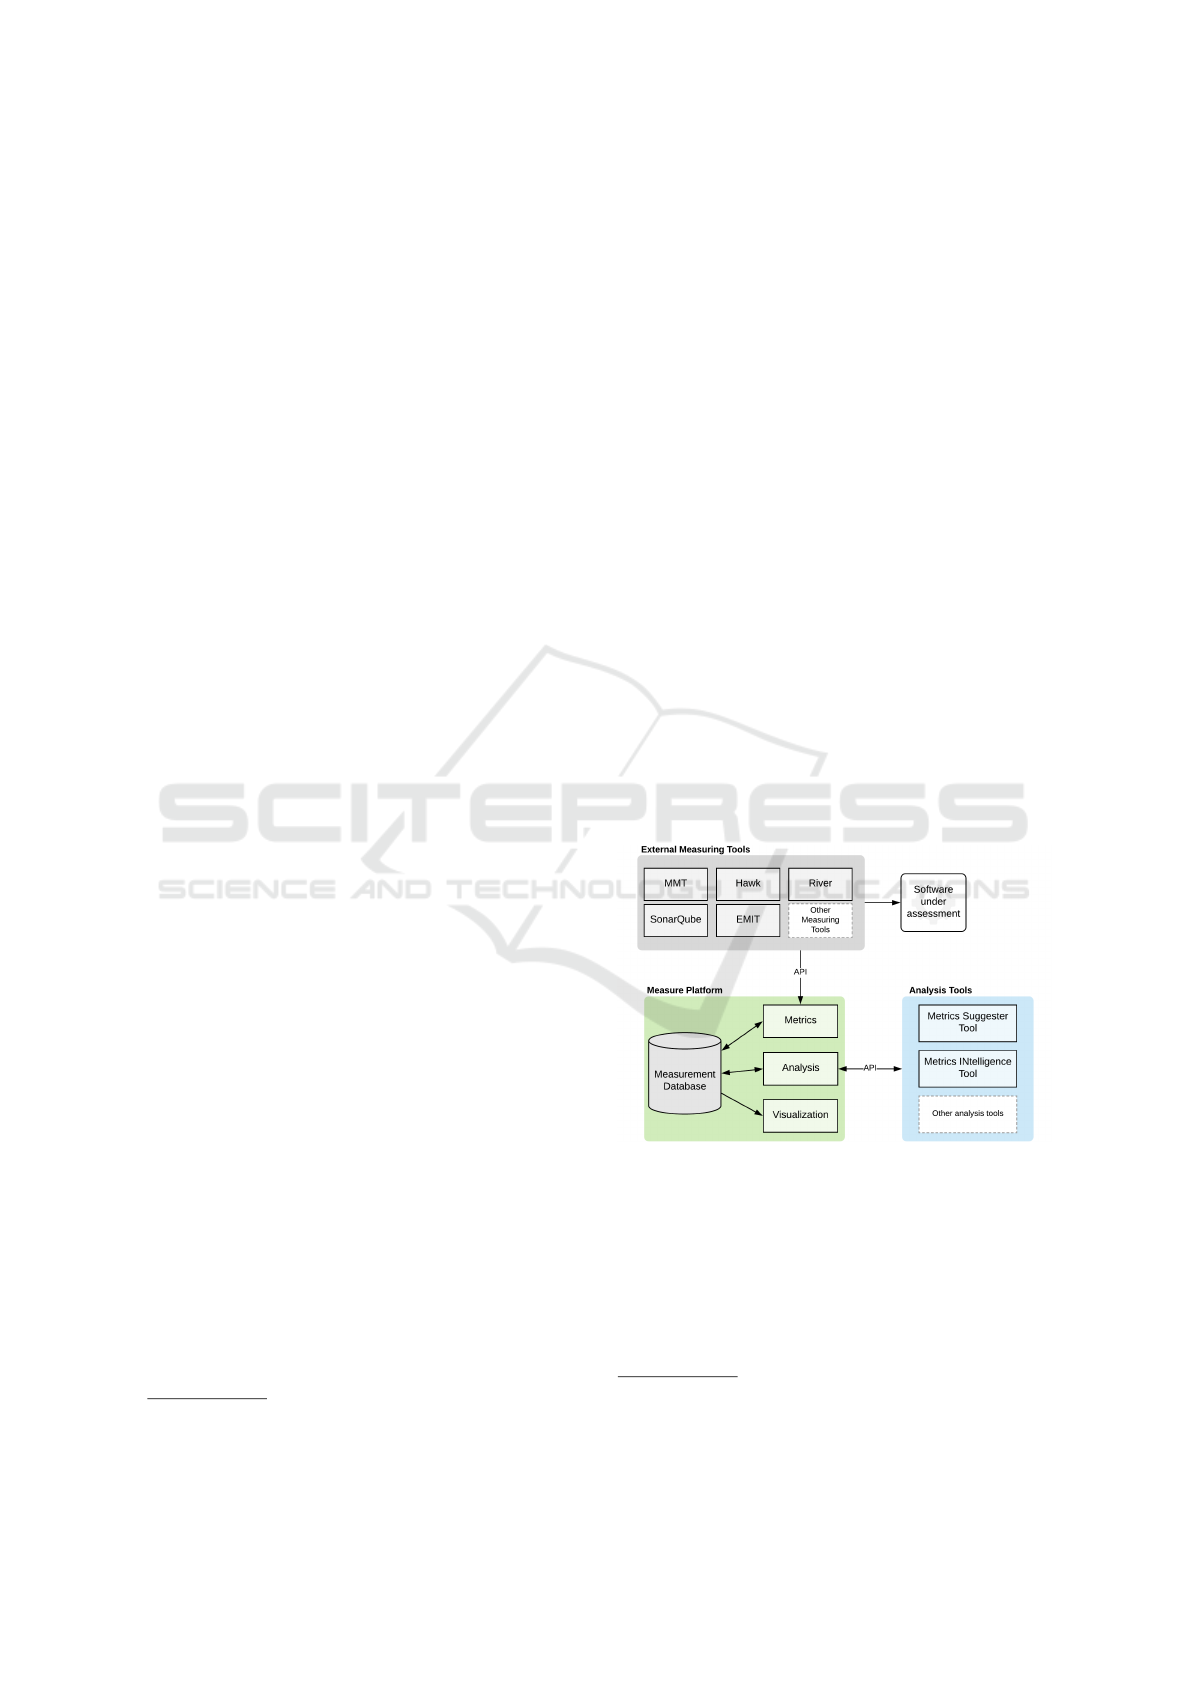
2.1 The MEASURE Platform
The MEASURE platform provides services to host,
configure and collect measures, storing measurement,
present and analyze them. These measures are first
defined in SMM (Structured Metrics Meta-model)
standard
4
using the Modelio modelling tool
5
and
its extension dedicated to SMM modelling. The
MEASURE platform can start collecting measure-
ment (data resulting of the execution of an instanti-
ated measure) thanks to external measurements tools
(e.g., Hawk (Garc
´
ıa-Dom
´
ınguez et al., 2016) for de-
sign and modelling related measurements, SonarQube
(Garc
´
ıa-Munoz et al., 2016) for testing related measu-
rements, MMT
6
for operation related measurements,
etc.).
Direct measures collect data in physical world
while the Derived Measures are calculated using pre-
viously collected measurement as input. Collected
measurements are stored on a NoSQL database de-
signed to be able to process a very large amount of
data. To collect measurements, the direct measures
can delegate the collect work to existing MEASURE
tools.
Figure 1: The MEASURE platform.
The measurements can also be processed by ana-
lysis tools to present consolidated results. The analy-
sis platform is composed of a set of tools that allow
combining and correlating measurements in a mea-
ningful way in order to provide suggestions and re-
commendations for the software developers and ma-
nagers.
4
https://www.omg.org/spec/SMM/About-SMM/
5
https://www.modelio.org/
6
http://www.montimage.com/products.html
Enhancing Software Development Process Quality based on Metrics Correlation and Suggestion
121

Finally, stored measurements and recommendati-
ons are presented directly to the end user following a
business structured way by the Decision-making plat-
form, a web application which allows organizing me-
asures based on projects / software development pha-
ses and displays its under various forms of charts.
In order to study and improve the software quality
processes and ease the tasks of project engineers and
managers, we defined a methodology based on two
modules: Metrics Suggester and Metrics Intelligence.
The used terminology, the formal modelling language
and our two techniques are described in the following.
2.2 A Formal Software Measurement
context
2.2.1 Terminology
Several concepts are commonly used in the soft-
ware engineering context. We provide some measu-
rement terminologies in the following (Group, 2012;
ISO/IEC, 2010).
Measurand: a measurand is the measured object. In
this context, it is a software system, such as software
product, in use or software resource.
Software Properties: the software properties are the
measurable properties of a software such as, for in-
stance, complexity or performance.
Measurement: a measurement is defined as a direct
quantification of a measured property (Fenton and
Bieman, 2014). This is the value of an evaluation re-
sult in a single time. This is information on the mea-
sured property, such as the percentage of the memory
used.
Measure: a measure is the definition of a concrete
calculation to evaluate a property, such as the calcula-
tion of the number of lines of code.
Metric: a metric is a measure space, in other words,
the specification of a measurement. This is the formal
definition of a measurement of a property of a com-
puter object by specifying the measurand, the mea-
sure(s) and the software property to be measured.
Measurement Plan: a measurement plan is an orde-
red set of metrics. They are all expected to be execu-
ted at a specific time or during a well-defined duration
and according to an ordered metrics sequence. They
can be run sequentially or in parallel.
2.2.2 The OMG Structured Metrics Meta-model
Our methodology is based on the OMG SMM (Struc-
tured Metrics Meta-model) standard to formally mo-
del our metrics in terms of measure, scope (subset
of measured properties) and measurement but also in
Figure 2: The Class Complexity metric model in SMM.
order to easily generate the corresponding Java code
(Dahab et al., 2018). Our main purpose is to have a
standard documentation on the measurement architec-
ture with the SMM model, which will also optimize
the design phase of the implementation of a software
measurement. Indeed, this process will enable mea-
surement code generation from a measurement archi-
tecture model based on SMM. This will reduce the
developer’s burden of manual implementation.
SMM is a standard specification that defines a
meta-model to specify a software measurement archi-
tecture. It defines the meta-models to express all ne-
cessary concepts to specify a measurement context. A
wide range of diversified types of measures is propo-
sed to define the dependency type between dependent
measures (as the ratio, binary or grade measure). The
language allows to define direct/indirect measures and
complex metrics:
- Direct Measure: is the measure independent of ot-
her measures, thus it refers to the simple evaluation
function.
- Indirect Measure: is a measure dependent on other
measures.
- Complex metric: a complex metric is a metric com-
posed of indirect measure(s).
As an example, the Figure 2 represents the model
of the Class Complexity metric in SMM with the Mo-
delio tool. This metric computes the cognitive weight
of OO code design. The cognitive weight represents
the complexity of a code architecture in terms of
maintainability and code understanding. It returns a
numerical weight. A low weight means a better de-
sign information. This is a direct metric. Thus, it is
represented by a microscope. Then, the unit of mea-
sure of the Class Complexity metric is a weight and
represented in the figure by the yellow symbol ”{...}”.
Finally, this metric is applied on a OO architecture,
which is represented by the blue target in the model.
Each component is modeled as a UML class allowing
the code generation from a SMM metric model.
We describe in the following the two techniques
composing our methodology.
ICSOFT 2018 - 13th International Conference on Software Technologies
122

2.3 Software Metrics Suggester
As previously mentioned, one of our approaches con-
sists on suggesting relevant and efficient measurement
plans at runtime using a machine learning algorithm.
For that purpose, measurements are performed conti-
nuously and data analysis periodically processed ac-
cording to cycles (e.g., each 1s, 1mn, half-day, etc.)
well-defined by the expert. Besides, it considers a de-
fined set of features, metrics and software classes to
give an insight to the measured software quality cha-
racteristics. A continuous analysis of the measure me-
trics and their significance is performed to be matched
to the most representative class. We finally suggest
a change in the measurement plan to only take into
consideration the relevant metrics to the project under
analysis during the period of analysis. This approach
utilizes several concepts that are described in the fol-
lowing. Besides, a tool, namely Metrics Suggester,
has been developed and integrated.
2.3.1 Basics
Support Vector Machine. A support vector ma-
chine (SVM) (Vapnik and Vapnik, 1998) is a linear
classifier defined by a separating hyperplane that de-
termines the decision surface for the classification.
Given a training set (supervised learning), the SVM
algorithm finds a hyperplane to classify new data.
Consider a binary classification problem, with a trai-
ning dataset composed of pairs (x
1
, y
1
), . . . , (x
l
, y
l
),
where each vector x
i
∈ R
n
and y
i
∈
{
−1, +1
}
. The
SVM classifier model is a hyperplane that separates
the training data in two sets corresponding to the de-
sired classes. Equation (1) defines a separating hyper-
plane
f (x) = w
T
x + b = 0 (1)
where w ∈ R
n
and b ∈ R are parameters that control
the function. Function f gives the signed distance bet-
ween a point x and the separating hyperplane. A point
x is assigned to the positive class if f (x) ≥ 0, and ot-
herwise to the negative class. The SVM algorithm
computes a hyperplane that maximizes the distance
between the data points on either side, this distance is
called margin. SVMs can be modeled as the solution
of the optimization problem given by (2), this pro-
blem maximizes the margin between training points.
min
w,b
1
2
k w k
2
subject to: y
i
(w
T
x
i
+ b) ≥ 1, i = 1, . . . , l
(2)
All training examples labeled −1 are on one side of
the hyperplane and all training examples label 1 are
on the other side. Not all the samples of the training
data are used to the determine the hyperplane, only
a subset of the training samples contribute to the de-
finition of the classifier. The data points used in the
algorithm to maximize the margin are called support
vectors.
Features & Classes. The set of measurements that
is classified using SVM is defined as a vector of featu-
res. Each feature is a field of a vector and a measure-
ment of one specific measure. Each field is unique. So
a feature is a measurement composing a vector for our
classification. Further, the vectors are classified into
classes according to the feature values. Each class
refers to a measured software property, such as the
maintainability or reliability. The features composing
a vector are the measurements which give information
on the classes. Some of them can give information on
several classes or only one. The features are chosen
according to the metrics defined in the starting mea-
surement plan.
2.3.2 The Mapping System
In order to suggest relevant and effective measure-
ment plans, a mapping system is defined between
classes and metrics, and between metrics and featu-
res. It aims at allowing an automate suggestion pro-
cedure. This mapping is performed by the experts of
the measured system. According to the type of inte-
rest (in terms of numbers of vector contained) of the
classes highlighted by the SVM classification, some
metrics will be added or removed from the measure-
ment plan. Thus, new features will be gathered and
others will no longer be.
Classes-Metrics. A relationship between a class
and some metrics is needed to measure specific tar-
geted software properties. The classes are used for
the classification of the vectors according to their fe-
atures values. As above mentioned, our classification
method is to classify a vector in the class correspon-
ding to the property whose the values of the vector
show a type of interest.
Features-Metrics. The features values inform
about the properties (classes) of interest. There are
features which give information on only one property
and others which can give information on several
different properties (complex metrics). Some of the
measures can be used by different metrics. Thus,
the features associated with a metric are the features
corresponding to the measures which composed the
metric.
In order to ensure the sustainability of measurement
Enhancing Software Development Process Quality based on Metrics Correlation and Suggestion
123

cycles by having at each cycle an information on all
measured properties, a set of metrics should always
be gathered. This set is called mandatory features.
To select the mandatory features, we use the RFE
technique, explained below, based on SVM.
The Feature Selection. The goal of the Feature Se-
lection (FS) process is to select the relevant features
of the raised classes. Its objective is to determine
a subset of features that collectively have good pre-
dictive power. With FS, we aim at highlighting the
features that are important for classification process.
The feature selection method is Recursive Feature Eli-
mination (RFE) (Khalid et al., 2014). RFE performs
backward elimination that consists of starting with all
the features and test the elimination of each variable
until no more features can be eliminated. RFE begins
with a classifier that was trained with all the featu-
res that are weighted. Then, the feature with the ab-
solute smallest weight is eliminated from the feature
set. This process is done recursively until the desired
number of features is achieved. The number of featu-
res is determined by using RFE and cross validation
together. In this process each subset of features is eva-
luated with trained classifier to obtain the best num-
ber of features. The result of the process is a classifier
trained with a subset of features that achieve the best
score in the cross validation. The classifier used du-
ring the RFE process is the classifier used during the
classification process.
2.3.3 Measurement Plan Suggestion
Based on the classification, matching and FS, two sets
of classes are notified: the one with the most vectors
called Biggest and the other set constituted of all the
other classes called Others. The Biggest means that
the corresponding property is the most interested ele-
ment while the Others means that the corresponding
properties are not the elements of interest. Thereby,
our Suggestion procedure is applied for the property
corresponding to the Biggest. Indeed, the Biggest
property needs a further measurement, while the Ot-
hers one no longer need it. Basically, based on the
procedures Analysis and Selection, we raise unneces-
sary features for the classification that should be re-
moved from the measurement plan. Through this met-
hod, the measurement load is increased only on needs
and decreasing due to less interested properties. This
suggestion approach allows to reach a lighter, com-
plete and relevant measurement plan at each cycle of
the software project management.
2.4 MINT- Metrics Intelligence Tool
MINT is a software solution designed to correlate
metrics from different software development life cy-
cle in order to provide valuable recommendations to
different actors impacting the software development
process. MINT considers the different measurements
collected by the MEASURE platform as events occur-
ring at runtime. The correlation is designed as exten-
ded finite state machines (EFSMs) allowing to per-
form Complex Event Processing (CEP) in order to de-
termine the possible actions that can be taken to im-
prove the diverse stages of the software life cycle and
thus the global software quality and cost.
2.4.1 Background
Metrics Correlation. The correlation can be defi-
ned as a mutual relationship or association between
metrics (or the values of its application). Metrics cor-
relation can be the basis for the reuse of metrics; it can
help to predict one value from another; it can indicate
a causal relation between metrics and can establish re-
lations between different metrics and increase the abi-
lity to measure. Examples of correlation are: to corre-
late two metrics from the same development phase; to
correlate the same metric at different times; to corre-
late a metric (a set of metrics) from phase X regarding
metrics of phase Y. As an outcome, recommendations
and a selection of metrics will be proposed to the de-
veloper to improve the software development. MINT
is based on correlation techniques.
Complex Events Processing. Complex event pro-
cessing (CEP)(Grez et al., 2017) technology addres-
ses exactly the need of matching continuously inco-
ming events against a pattern. Input events from data
streams are processed immediately and if an event
sequence is matching a pattern, the result is emitted
straight away. CEP works very efficiently and in real-
time, as there are no overheads for data storing. CEP
is used in many areas that include for instance manu-
facturing processes, ICT security, etc. and is adapted
in this paper for software quality assessment process.
Extended Finite State Machine In order to for-
mally model the correlation process, the Extended Fi-
nite State Machine (EFSM) formalism is used. This
formal description allows to represent the correlation
between metrics as well as the constraints and com-
putations needed to retrieve a meaningful recommen-
dation related to software quality assessment.
Definition 1. An Extended Finite State Machine
M is a 6-tuple M = < S, s
0
, I, O,
#»
x , Tr > where S is a
ICSOFT 2018 - 13th International Conference on Software Technologies
124
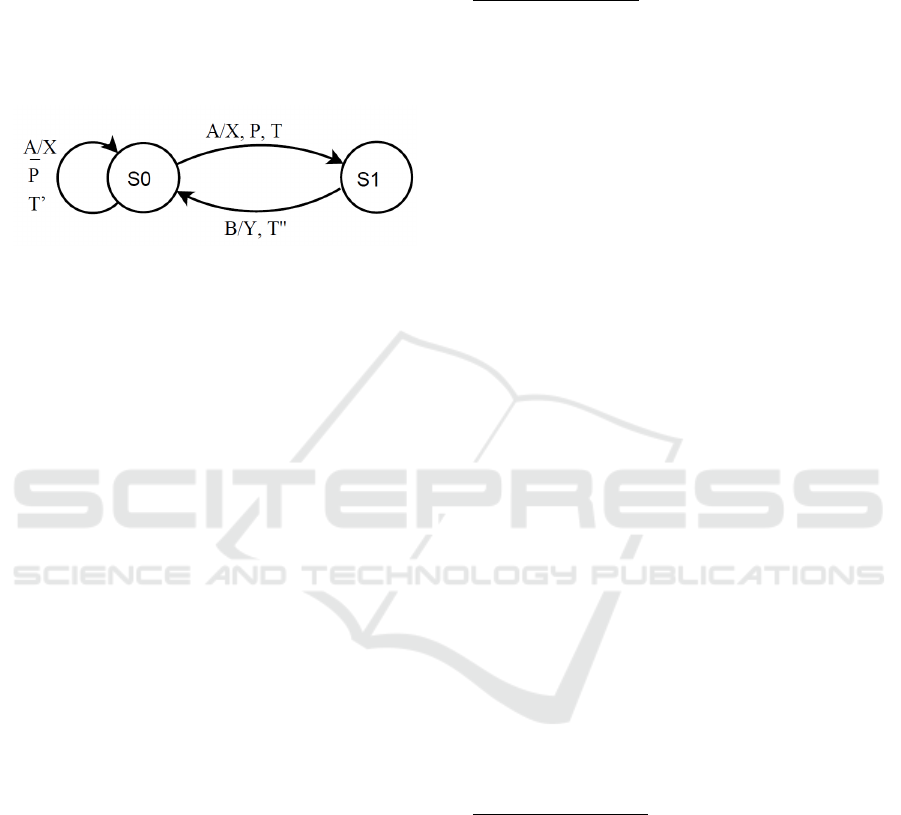
finite set of states, s
0
is the initial state, I is a finite set
of input symbols (eventually with parameters), O is a
finite set of output symbols (eventually with parame-
ters),
#»
x is a vector denoting a finite set of variables,
and Tr is a finite set of transitions. A transition tr is
a 6-tuple tr = < s
i
, s
f
, i, o, P, A > where s
i
and s
f
are
the initial and final state of the transition, i and o are
the input and the output, P is the predicate (a bool-
ean expression), and A is an ordered set (sequence) of
actions.
Figure 3: Example of a simple EFSM with two states.
We illustrate the notion of EFSM through a simple
example described in Fig. 3. The ESFM is composed
of two states S
0
, S
1
and three transitions that are labe-
led with two inputs A and B, two outputs X and Y, one
predicate P and three tasks T , T
0
, and T
00
. The EFSM
operates as follows: starting from state S
0
, when the
input A occurs, the predicate P is tested. If the condi-
tion holds, the machine performs the task T, triggers
the output X and passes to state S
1
. If P is not satis-
fied, the same output X is triggered but the action T
0
is performed and the state loops on itself. Once the
machine is in state S
1
, it can come back to state S
0
if receiving input B. If so, task T
00
is performed and
output Y is triggered.
2.4.2 Writing Correlation Processes
Correlation Process Inputs and Outputs. The ba-
sic idea behind MINT approach is to specify a set of
correlation rules based on the knowledge of an expert
of the software development process. These rules can
rely on one or different sets of metrics (seen as inputs)
and allow different recommendations to be privided
(seen as outputs) to different kinds of actors:
• Actors from the DevOps team: Analysts, de-
signers, modellers, architects, developers, tester,
operators, security experts, etc.
• Actors from the management plan: product ma-
nager, project manager, responsible of human re-
sources, responsible of financial issues etc.
The automatic generation of such rules or their conti-
nuous refinement based on some artificial intelligence
techniques is an ongoing work and out of the paper
scope.
Example of Correlation Processes. The correla-
tion processes rely on different measurements that are
computed and collected by external tools. Some ex-
amples of correlations are presented in the Figure 4.
Software Modularity
The assessment of the software modularity relies on
two metrics provided by the SonarQube tool that are
the class complexity and the maintainability rating.
The class complexity measure (also called cognitive
complexity) computes the cognitive weight of a Java
Architecture. The cognitive weight represents the
complexity of a code architecture in terms of main-
tainability and code understanding. The maintainabi-
lity rating is the ratio of time (according to the to-
tal time to develop the software) needed to update
or modify the software. Based on these definitions,
and considering that a modular code can be more un-
derstandable and maintainable, we can correlate the
two metrics and compute the ratio R = class complex-
ity/maintainability rating. If this ratio is more than a
specific threshold set by an expert, the recommenda-
tion “Reinforce the modular design of your develop-
ment” will be provided to the software architect and
developers.
In the initial state, we can either receive the input
related the class complexity denote cc or the main-
tainability rating denoted mr. The process accesses
respectively to the states “cc received” or “mr recei-
ved”. If we receive the same measurement related
to the same metric, we update its value and loop on
the state. Otherwise, if we receive the complemen-
tary metric, we compute the ratio R = class complex-
ity/maintainability rating. If this ratio is less than the
defined threshold, we come back to the initial state
otherwise, we raise the recommendation. Timers are
used to come back to the initial state if the measure-
ments are too old. For sake of place, only this EFSM
is presented in Figure 5. All the others follow the
same principles.
Requirements Quality
The assessment of the requirements quality can rely
on two metrics provided by the SonarQube tool that
are the total number of issues and the total number of
reopened issues. These numbers are collected during
the implementation phase and we can consider that
the fact that we reopen an issue many times during the
development process can be related to an ambiguous
definition of the requirement that needs to be imple-
mented. If we have a ratio R = number of reopened
issues/number of issues that is more than a specific
threshold, we can consider that the requirements are
not well defined and that the development needs more
refinement about them. The recommendation “Refine
requirement definitions or provide more details” will
Enhancing Software Development Process Quality based on Metrics Correlation and Suggestion
125
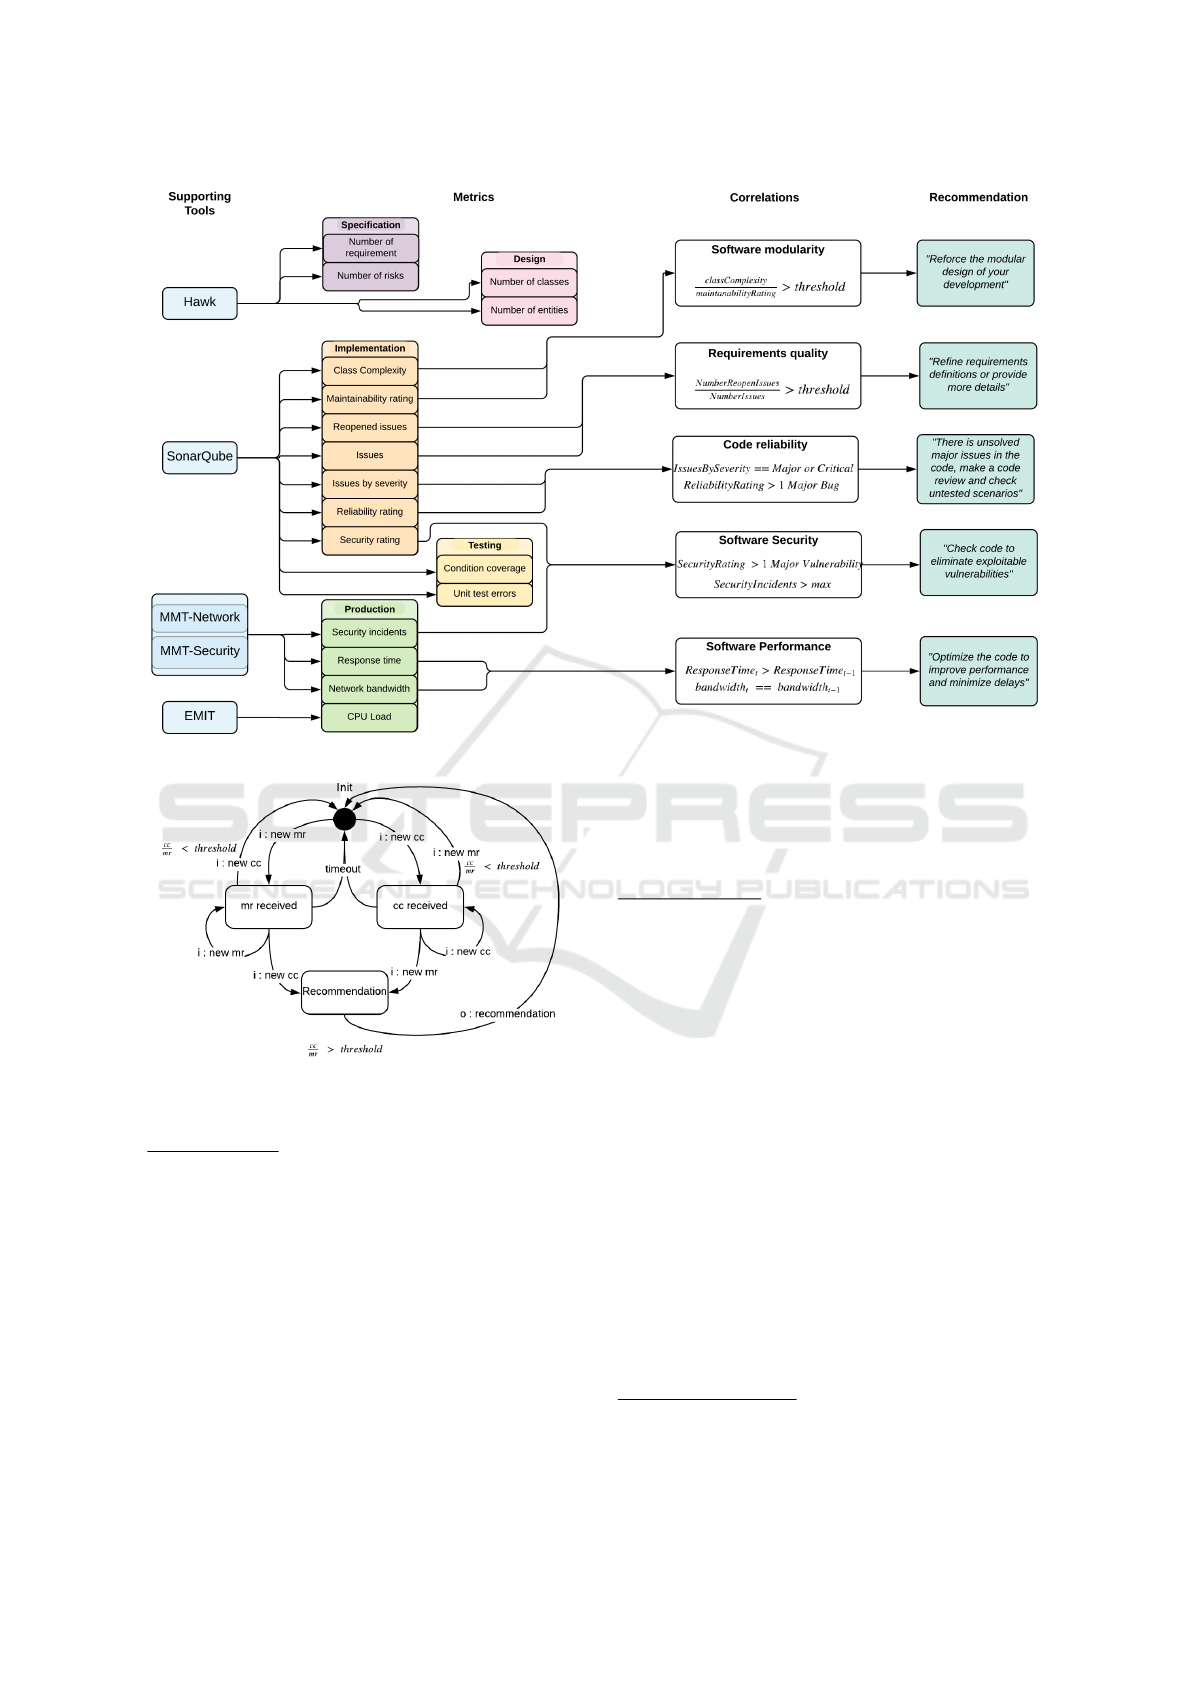
Figure 4: Example of Correlation processes.
Figure 5: Software Modularity Correlation processes.
be provided to the requirements analyst.
Code Reliability
The assessment of the code reliability relies on two
metrics provided by the SonarQube tool that are the
number of issues categorized by severity and the reli-
ability rating. The issues in SonarQube are presented
with severity being blocker, critical, major, minor or
info and the reliability rating are from A to E: A is
to say that the software is 100% reliable and E is to
say that there is at least a blocker bug that needs to
be fixed. Based on these definitions and considering
that a reliable code should be at last free of major or
critical issues, we can check that there is no major,
critical nor blocker issues and the reliability rating is
< C corresponding to 1 major bug. If this condition
is not satisfied, the recommendation “There is unsol-
ved major issues in the code, make a code review and
check untested scenarios” will be provided to the soft-
ware developers and testers.
Software Security
The assessment of the software security relies on two
metrics, one provided by the SonarQube tool that is
the security rating and the other is provided by MMT
that is the number of security incidents. The security
rating in SonarQube provide an insight of the detected
vulnerabilities in the code and are presented with se-
verity being blocker, critical, major, minor or no vul-
nerability. The number of the security incidents pro-
vided by MMT reports on successful attacks during
operation. The evaluation of security demonstrates
that if an attack is successful this means that the vul-
nerability in the code was at least major because an
attacker was able to exploit it to perform its malicious
activity. Based on these definitions, and considering
that a reliable code should be at last free of major vul-
nerabilities, we can check if there is a major vulne-
rability and that the number of attacks at runtime are
more than a threshold. If this condition is satisfied,
the recommendation “Check code to eliminate exploi-
table vulnerabilities” will be provided to the software
developers ans security experts.
Software Performance
The assessment of the software performance relies on
two metrics provided by the MMT tool that are the re-
ICSOFT 2018 - 13th International Conference on Software Technologies
126

sponse time and the bandwidth usage. The response
time denotes the delay that can be caused by the soft-
ware, hardware or networking part that is computed
during operation. This delay is in general the same for
a constant bandwidth (an equivalent number of users
and concurrent sessions). Based on this finding, we
can correlate the two metrics and compute that the re-
sponse time is not increasing for during time for the
same bandwidth usage. If this response time is in-
creasing, the recommendation “Optimize the code to
improve performance and minimize delays” will be
provided.
3 EXPERIMENTS
Experts of the MEASURE platform (mainly its ad-
ministrator and the project manager) selected 15 me-
trics and provided a training data set of 1,000 labelled
vectors. We applied our two techniques and tools on
the MEASURE platform and detail the results in this
section.
3.1 Suggester Experiment
The suggestion process is evaluated by analyzing the
new measurement plans (MP) based on the results of
the classification process. These results are used in
the feature selection process to identify the class of
interest. The objective is to highlight the effects of
using the proposed measurement plans and its impact
on the classification of new data and on the amount of
data collected by this plan.
The used and analyzed measurement data are the
measurement results provided by our industrial ME-
ASURE platform. Data are collected at runtime from
selected features/metrics.
3.1.1 Setup
We herein considered the following measurement
plan which determined by our expert. An initial MP
can be defined by 15 features, 15 metrics and 4 soft-
ware quality properties. Each metric is composed
of only one feature and the mapping between me-
trics and classes is the following: (i) Maintainability
(Class 1): Cognitive Complexity, Maintainability In-
dex, Code Size, Number of issues, (ii) System Per-
formance (Class 2): Computational Cost, Infrastruc-
ture Cost, Communication Cost and Tasks, (iii) Per-
formance (Class 3): Response Time, Running Time
and I/O Errors, (iv) Functionality (Class 4): Usability,
Precision, Stability Response Time and Illegal Opera-
tions.
Table 1: Each metric and its assigned index during the sug-
gestion process.
Index Metric
1 Cognitive Complexity
2 Maintainability Index
3 Code Size
4 Number of issues
5 Response Time
6 Running Time
7 Usability
8 Computational Cost
9 Infrastructure Cost
10 Communication Cost
11 Tasks
12 I/O Errors
13 Precision
14 Stability Response Time
15 Illegal Operations
Using the previously described plan, we conside-
red the class with the most predicted instances during
each cycle. A huge set of 16,000,000 unclassified vec-
tors (unlabelled) were collected and processed (repre-
senting a collection of diverse data during a long pe-
riod of time). This data set was divided into 32 subsets
each containing 500,000 vectors. For each period of
the suggestion process, only one subset was used as
input.
The initial measurement plan used during the ex-
periment consisted of the following 5 metrics: Main-
tainability Index, Response Time, Running Time,
Usability, Computational Cost. These metrics where
selected by the expert as an example of a measure-
ment plan with a small number of metrics that has
links to all software quality properties. During the
suggestion process a number was assigned to each
metric. In our experiments the number of each is
shown in Table 1.
3.1.2 Results
During the suggestion process, 15 metrics (Table 1)
were available to suggest new MP. Fig. 6 shows how
the classification of the vectors was distributed during
the cycles and the percentage of the vectors assigned
to each class. From these metrics, 15 unique mea-
surement plans were used in the suggestion process.
Table 2 lists the plans and in which cycle they were
used.
MP1 was only used at the beginning of the pro-
cess, this was the plan suggested by the expert. We
note that MP2 was the most used plan during the pro-
cess (6 times). This plan is composed by the metrics
linked to the Performance property and was suggested
when the classification of vector to class 3 overwhel-
med the other classes. This tells us that if we focus on
Enhancing Software Development Process Quality based on Metrics Correlation and Suggestion
127
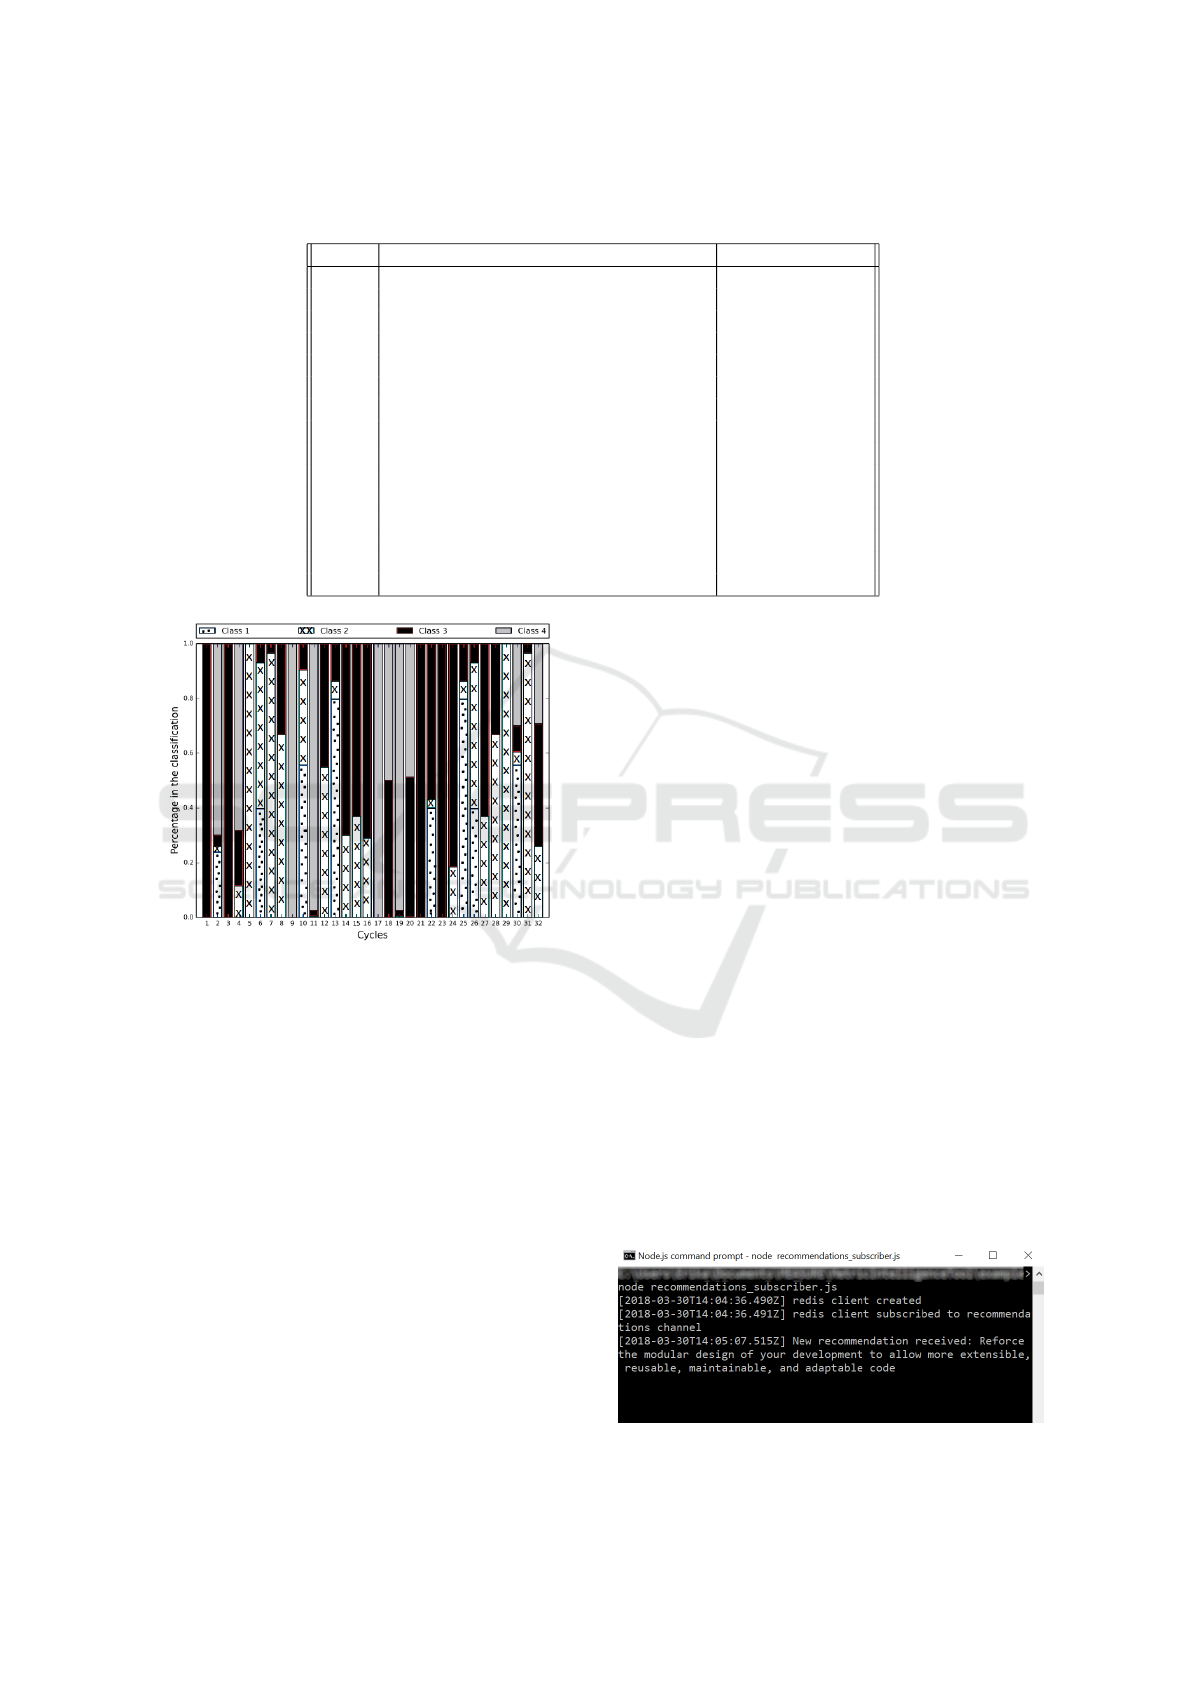
Table 2: Measurement plans used during the suggestion process and the cycles where they were used. Metrics of the plans
are represented by the indexes described in Table 1.
Metrics Cycles
MP1 2, 5, 6, 7, 8 1
MP2 4, 5, 6, 12 2, 4, 17, 22, 23, 24
MP3 1, 2, 3, 4, 5, 6, 7, 8, 9, 10, 11, 13, 14, 15 3, 5, 18
MP4 8, 9, 10, 11 6, 30
MP5 7, 8, 9, 10, 11 7, 8, 9
MP6 1, 2, 3, 4, 5, 6, 7, 8, 9, 10, 13, 14, 15 10
MP7 1, 2, 3, 4, 5, 6, 7, 8, 9, 10, 11, 12, 13, 14, 15 11, 19, 20
MP8 2, 3, 4, 5, 6, 7, 8, 9, 10, 11, 12, 13, 14, 15 12, 21
MP9 1, 2, 3, 4, 5, 6, 7, 8, 9, 10, 11, 12, 13, 14 13, 14, 15, 16
MP10 3, 4, 5, 6, 8, 9, 10, 11, 12 25
MP11 1, 2, 3, 4, 5, 6, 7, 8, 9, 10, 11 26, 32
MP12 1, 2, 3, 4, 5, 6, 8, 9, 10, 11 27
MP13 1, 3, 4, 5, 6, 8, 9, 10, 11, 12 28
MP14 1, 2, 3, 4, 5, 6, 7, 8, 9, 10, 11, 12 29
MP15 1, 2, 3, 4, 5, 6, 7, 8, 9, 10 31
Figure 6: Classification results of each cycle. The results
show the percentage in the predictions of each cycles for
the 4 classes.
the Performance property then the metrics in MP2 are
sufficient.
MP3 was suggested when the four classes were
present in the classification results and class 4 was the
class of interest. The tool suggests to take into consi-
deration more than the linked metrics to the class, it
seems that these features help to the classification of
class 4.
MP4 was suggested when the input vectors were
only classified to class 2, this MP2 consists of the me-
trics linked to that class. This happens when the input
vectors are classified to only one class, the same can
be observed in cycle 1 but with class 3. MP5 has only
one more metric than MP4, Usability. It is also a MP
focused on System Performance property. MP11 was
also suggested when class 2 overwhelmed the number
of classifications during the classification phase.
MP7, MP8 and MP9 are very similar measure-
ment plans. These plans have the highest number
of metrics, MP7 15 metrics and MP8&9 14 metrics.
These plans are suggested when the classification re-
sults usually have more than 2 classes. This is because
the classes do not share any metric between them. A
measurement plan with the majority of the metrics is
expected to classify well the majority of the classes.
MP10, MP12, MP13, MP14 and MP15 where sug-
gested in the same case as the previously mentioned
plans but these plans where only suggested one time
during the process.
3.2 MINT Experiment
To test the efficiency of the MINT tool, we created ten
scripts enabling to generate different values for the ten
metrics that are relevant for the correlation processes
defined in the Figure 4. For each correlation, we cre-
ated 2 scripts: one that meets the condition that sa-
tisfies the recommendation and another that does not
satisfy it. The 10 scripts are summarized in Table 3.
Each script pushes the metric values into an event
bus that feeds the 5 correlation processes defined in
Section II.D.2.b. The results correspond to the de-
sired recommendations and the Figure 7 displays an
example of recommendation provided by the MINT
tool.
Figure 7: Recommendation triggered by script 1.
ICSOFT 2018 - 13th International Conference on Software Technologies
128

Table 3: Experiments scripts.
Correlation Script Metrics constraint
Code 1 Class complexity/maintability rating
Modularity > threshold
Code 2 Class complexity/maintability rating
Modularity < threshold
Specification 3 Number of reopened issues / number of issues
Quality > threshold
Specification 4 Number of reopened issues / number of issues
< threshold
Management 5 Issues by severity = Major or Critical
Quality Reliability rating > 1 Major bug
Management 6 Issues by severity 6= Major and 6= Critical
or Reliability rating < 1 Major bug
Security 7 Security vulnerability > Major vulnerability
Security incident > threshold
Security 8 Security vulnerability < Major vulnerability
or Security incident < threshold
Performance 9 Reponse time
t
> reponse time
t−1
bandwidth
t
= bandwidth
t−1
Performance 10 Reponse time
t
<= reponse time
t−1
or bandwidth
t
> bandwidth
t−1
This experiment showed the efficiency of the tool.
More work is planned to apply this tool to real data-
sets provided by real users in the context of the soft-
ware development process.
4 RELATED WORK
Many efforts have been done to define metrics for
software quality (Fenton and Pfleeger, 1996), (Kit-
chenham, 2010), (Bouwers et al., 2013). These works
can be associated with standardized quality models
such as ISO 9126 quantifying properties with soft-
ware metrics (Carvallo and Franch, 2006). Learning
techniques are currently arising to effectively refine,
detail and improve the used metrics and to target more
relevant measurement data. Current works such as
(Laradji et al., 2015)(Shepperd et al., 2014)(Malhotra,
2015) raise that issue by proposing diverse kinds of
machine learning approaches for software defect pre-
diction through software metrics. These studies have
shown the importance of gathering information on the
software engineering process in particular to ensure
its quality through metrics and measurements analy-
sis (Fenton and Pfleeger, 1996). Thanks to that, stan-
dardization institutes worked in that way to propose
two well-known norms, ISO/IEC25010 (Kitchenham,
2010) and OMG SMM (Bouwers et al., 2013) to guide
the measurement plan specification. These two stan-
dards have been reviewed by the research and indus-
trial community, and are adapted and applied in many
domains.
However, even if these techniques have introduced
considerable progress to improve the software qua-
lity, they have still some limitations. The measure-
ment plan is, in general, manually fixed by the project
manager, the implementation of the measures is de-
pendent on the developer and reduce the scalability,
maintainability and the interoperability of the measu-
rement process.
For software metrics correlation, there are many
works focused on the relations between internal and
external software metrics. In (Shweta and Singh, ),
the impact of software metrics on software quality is
presented and the internal and external attributes of
a software product are studied because the relations-
hip between them directly affects its behaviour. The
metrics are combination of these attributes. As the
number of metrics used in a software project incre-
ases, the management and controlling of the project
also increases. In (van der Meulen and Revilla, 2007),
the authors investigated the relationship between dif-
ferent internal and external software metrics by analy-
zing a large collection of C/C++ programs submitted
to a programming competition, the Online Judge. In
(Kevrekidis, ), they analyze the links between soft-
ware reliability and software complexity for evalua-
ting the effectiveness of testing strategies.
These works have been applied mainly to esta-
blish correlations between internal and external me-
trics, and to specific ones. These works are very use-
ful for our future work. Even though our approaches
Enhancing Software Development Process Quality based on Metrics Correlation and Suggestion
129

are generic and can be applied to any metric, we plan
to apply our approaches to evaluate the relation bet-
ween specific and well selected metrics.
5 CONCLUSION
This paper presents two approaches and two software
tools, Metrics Suggester and MINT, which analyse
the large amount of measurement data generated du-
ring the software development process. The analy-
sis is performed at different phases from the design
to the operation and using different measuring tools
(e.g., SonarQube and MMT). The data analysis plat-
form implements analytic algorithms (SVM and CEP)
to correlate the different phases of software develop-
ment and perform the tracking of metrics and their
value. Correlations cover all aspects of the system
like modularity, maintainability, security, timing, etc.
and evaluate the global quality of the software deve-
lopment process and define actions (suggestions and
recommendations) for improvements.
The Metrics Suggester tool is very valuable to re-
duce the energy and cost in gathering the metrics from
different software life cycle phases and allows to re-
duce the number of the collected metrics according to
the needs defined as profiles or clusters. It uses the
support vector machine (SVM) that allows to build
different classifications and provide the relevant mea-
suring profile, the MP.
MINT is a rule based analyser using the ESFM
formalism. It acts as a complex event processor that
corrects the occurrence of measurements on time and
provides a near real-time recommendation for the
software developers and managers.
The presented experimentation’s showed the ef-
ficiency of the two developed tools and their com-
plementarity. Future works regarding performance,
scalability and an extended number of metrics are ex-
pected.
ACKNOWLEDGEMENTS
This work is partially funded by the ongoing Euro-
pean project ITEA3-MEASURE started in Dec. 1st,
2015, and the EU HubLinked project started in Jan.
1st, 2017.
REFERENCES
Akbar, M. A., Sang, J., Khan, A. A., Fazal-e-Amin, Nas-
rullah, Shafiq, M., Hussain, S., Hu, H., Elahi, M.,
and Xiang, H. (2018). Improving the quality of
software development process by introducing a new
methodology-az-model. IEEE Access, 6:4811–4823.
Bouwers, E., van Deursen, A., and Visser, J. (2013). Eva-
luating usefulness of software metrics: an industrial
experience report. In Notkin, D., Cheng, B. H. C., and
Pohl, K., editors, 35th International Conference on
Software Engineering, ICSE ’13, San Francisco, CA,
USA, May 18-26, 2013, pages 921–930. IEEE Com-
puter Society.
Carvallo, J. P. and Franch, X. (2006). Extending the iso/iec
9126-1 quality model with non-technical factors for
cots components selection. In Proceedings of the 2006
International Workshop on Software Quality, WoSQ
’06, pages 9–14, New York, NY, USA. ACM.
Dahab, S. A., Maag, S., and Hernandez Porras, J.-J. (2018).
A novel formal approach to automatically suggest me-
trics in software measurement plans. In Evaluation of
Novel Approaches to Software Engineering (ENASE),
2018 13th International Conference on. IEEE.
Fenton, N. and Bieman, J. (2014). Software metrics: a ri-
gorous and practical approach. CRC Press.
Fenton, N. E. and Pfleeger, S. L. (1996). Software metrics -
a practical and rigorous approach (2. ed.). Internati-
onal Thomson.
Garc
´
ıa-Dom
´
ınguez, A., Barmpis, K., Kolovos, D. S.,
da Silva, M. A. A., Abherve, A., and Bagnato, A.
(2016). Integration of a graph-based model indexer in
commercial modelling tools. In Baudry, B. and Com-
bemale, B., editors, Proceedings of the ACM/IEEE
19th International Conference on Model Driven Engi-
neering Languages and Systems, Saint-Malo, France,
October 2-7, 2016, pages 340–350. ACM.
Garc
´
ıa-Munoz, J., Garc
´
ıa-Valls, M., and Escribano-
Barreno, J. (2016). Improved metrics handling in so-
narqube for software quality monitoring. In Distribu-
ted Computing and Artificial Intelligence, 13th Inter-
national Conference, DCAI 2016, Sevilla, Spain, 1-3
June, 2016, pages 463–470.
Grez, A., Riveros, C., and Ugarte, M. (2017). Foundations
of complex event processing. CoRR, abs/1709.05369.
Group, O. M. (2012). Structured metrics metamodel (smm).
(October):1–110.
Hauser, J. and Katz, G. (1998). Metrics: You are what you
measure! 16:517–528.
ISO/IEC (2010). Iso/iec 25010 - systems and software en-
gineering - systems and software quality requirements
and evaluation (square) - system and software quality
models. Technical report.
Kevrekidis, Kostas, e. a. Software complexity and tes-
ting effectiveness: An empirical study. In Relia-
bility and Maintainability Symposium, 2009.RAMS
2009.Annual.IEEE, 2009.
Khalid, S., Khalil, T., and Nasreen, S. (2014). A survey of
feature selection and feature extraction techniques in
machine learning. In Science and Information Confe-
rence (SAI), 2014, pages 372–378. IEEE.
Kitchenham, B. A. (2010). What’s up with software me-
trics? - A preliminary mapping study. Journal of Sys-
tems and Software, 83(1):37–51.
ICSOFT 2018 - 13th International Conference on Software Technologies
130

Laradji, I. H., Alshayeb, M., and Ghouti, L. (2015). Soft-
ware defect prediction using ensemble learning on se-
lected features. Information & Software Technology,
58:388–402.
Malhotra, R. (2015). A systematic review of machine le-
arning techniques for software fault prediction. Appl.
Soft Comput., 27(C):504–518.
Shepperd, M. J., Bowes, D., and Hall, T. (2014). Researcher
bias: The use of machine learning in software defect
prediction. IEEE Trans. Software Eng., 40(6):603–
616.
Shweta, S. S. and Singh, R. Analysis of correlation between
software complexity metrics. In IJISET - Internatio-
nal Journal of Innovative Science, Engineering and
Technology , Vol. 2 Issue 8, August 2015.
van der Meulen, M. and Revilla, M. A. (2007). Correla-
tions between internal software metrics and software
dependability in a large population of small C/C++
programs. In ISSRE 2007, The 18th IEEE Internati-
onal Symposium on Software Reliability, Trollh
¨
attan,
Sweden, 5-9 November 2007, pages 203–208.
Vapnik, V. N. and Vapnik, V. (1998). Statistical learning
theory, volume 1. Wiley New York.
Enhancing Software Development Process Quality based on Metrics Correlation and Suggestion
131
