
Nonlinear Feature Extraction using Multilayer Perceptron based
Alternating Regression for Classification and Multiple-output Regression
Problems
Ozde Tiryaki
1,2
and C. Okan Sakar
1
1
Department of Computer Engineering, Bahcesehir University, Istanbul, Turkey
2
NETAS Telecommunication Company, Kurtkoy, Istanbul, Turkey
Keywords:
Alternating Regression (Ar), Multiple-output Regression, Neural Networks, Kernel Canonical Correlation
Analysis (Kcca), Nonlinear Dimensionality Reduction.
Abstract:
Canonical Correlation Analysis (CCA) is a data analysis technique used to extract correlated features between
two sets of variables. An important limitation of CCA is that it is a linear technique that cannot capture
nonlinear relations in complex situations. To address this limitation, Kernel CCA (KCCA) has been proposed
which is capable of identifying the nonlinear relations with the use of kernel trick. However, it has been
shown that KCCA tends to overfit to the training set without proper regularization. Besides, KCCA is an
unsupervised technique which does not utilize class labels for feature extraction. In this paper, we propose
the nonlinear version of the discriminative alternating regression (D-AR) method to address these problems.
While in linear D-AR two neural networks each with a linear bottleneck hidden layer are combined using
alternating regression approach, the modified version of the linear D-AR proposed in this study has a nonlinear
activation function in the hidden layers of the alternating multilayer perceptrons (MLP). Experimental results
on a classification and a multiple-output regression problem with sigmoid and hyperbolic tangent activation
functions show that features found by nonlinear D-AR from training examples accomplish significantly higher
accuracy on test set than that of KCCA.
1 INTRODUCTION
Canonical correlation analysis (CCA) (Hotelling,
1992) is a multivariate statistical analysis technique
used to explore and measure the relations between
two multidimensional variables. In data analysis, un-
der the presence of two different input representations
of the same data or two data sources providing sam-
ples about the same underlying phenomenon, CCA
is used as an unsupervised feature extraction tech-
nique. It aims at finding a pair of linear transforma-
tions such that the transformed variables in the lower
dimensional space are maximally correlated.
An important limitation of CCA is that it cannot
explore the complex relationships between the sets
of variables because of its linearity. To address this
problem, kernel CCA was proposed (Akaho, 2001;
Melzer et al., 2001; Bach and Jordan, 2003) which
offers an alternative solution using a method known
as the kernel trick (Sch
¨
olkopf, 2000). The main idea
of KCCA is to map the original low-dimensional in-
put space to a high-dimensional feature space using
a nonlinear kernel function and then apply CCA in
the transformed space. Kernel CCA is capable of de-
tecting nonlinear relationships under the presence of
complex situations. KCCA has been used in a broad
range of disciplines like biology, neurology, content-
based image retrieval and natural language processing
(Huang et al., 2009; Li and Shawe-Taylor, 2006; Sun
and Chen, 2007; Cai and Huang, 2017; Chen et al.,
2012).
Another important limitation of CCA and KCCA
is that under the presence of class labels in super-
vised learning problems, they do not utilize the class
labels for feature extraction but only target to find
the maximally correlated covariates of both views.
Therefore, covariates explored by these unsupervised
methods preserve the correlated information at the ex-
pense of losing the important discriminative informa-
tion which can be helpful in separating class examples
from each other.
In this paper, we propose the nonlinear version of
the discriminative alternating regression (D-AR) net-
work (Sakar and Kursun, 2017) which is based on
Tiryaki, O. and Sakar, C.
Nonlinear Feature Extraction using Multilayer Perceptron based Alternating Regression for Classification and Multiple-output Regression Problems.
DOI: 10.5220/0006848901070117
In Proceedings of the 7th International Conference on Data Science, Technology and Applications (DATA 2018), pages 107-117
ISBN: 978-989-758-318-6
Copyright © 2018 by SCITEPRESS – Science and Technology Publications, Lda. All rights reserved
107

the alternating regression (AR) method (Sakar et al.,
2014b). The AR approach is first described in (Wold,
1966) and its neural network adaptations have been
applied in (Lai and Fyfe, 1998), (Pezeshki et al.,
2003) and (Hsieh, 2000) to extract robust CCA co-
variates. In the previously proposed linear D-AR
(Sakar and Kursun, 2017; Sakar et al., 2014b), two
neural networks each with a linear bottleneck hidden
layer are trained to learn both class labels and co-
variate outputs using alternating regression approach.
Having both class labels and covariate outputs in the
output layer improves the discriminative power of the
extracted features. Besides, feature extraction with-
out the use of sensitive sample covariance matrices
makes the network more robust to outliers (Sakar and
Kursun, 2017). The non-linear version of D-AR has
a nonlinear activation function in the hidden layers
of the alternating multilayer perceptrons (MLP). Co-
variate outputs are alternated between the correspond-
ing MLPs in order to maximize the correlation be-
tween two views. In our experiments, we compare the
classification and regression performance of the fea-
tures extracted by the proposed nonlinear D-AR with
that of linear D-AR, CCA, and KCCA on publicly
available emotion recognition and residential building
datasets. We use two nonlinear activation functions,
sigmoid and hyperbolic tangent, in the hidden layer
of nonlinear D-AR and present the results for differ-
ent training set sizes and number of covariate outputs.
The rest of this paper is structured as follows. In
Section II, we give brief information on the datasets
used; emotion recognition and residential building.
Section III provides background on CCA, KCCA,
MLP, and linear D-AR. In Section IV, we present the
details of the proposed nonlinear D-AR method. Ex-
perimental results are given in Section V. The conclu-
sions are given in Section VI.
2 DATASET
The Cohn-Kanade (CK+) facial expression database
(Lucey et al., 2010) is a commonly used benchmark-
ing dataset in emotion recognition tasks. This dataset
consists of 320 video clips recorded from 118 sub-
jects, each categorized with an emotion label. Each
video clip in this dataset belongs to one of the seven
emotions which are anger, contempt, disgust, fear,
happiness, sadness, and surprise. The samples in
this dataset can be represented using different fea-
ture extraction techniques. In our experimental study,
the first view consists of appearance-based features
(Sakar et al., 2014a; Karaali, 2012; Sakar et al., 2012)
which are obtained using the difference between the
first frame of the video clip (the neutral facial ex-
pression) and the corresponding last frame (the peak
frame of the emotion). Each sample in this repre-
sentation has 4096 (64×64) features (pixels). The
second view consists of the geometric set of features
(Sakar et al., 2014a; Ulukaya, 2011; Karaali, 2012),
which are constituted by subtracting the coordinates
of landmark points of the neutral face expression from
the coordinates of the landmark points of the target
expression. The feature vector in the second view
consists of 134 features obtained from 67 landmark
points, each of which represented with x and y coor-
dinates.
The Residential Building dataset (Rafiei and
Adeli, 2015) is one of the most recent regression
datasets in UCI Machine Learning Repository (Asun-
cion and Newman, 2007). The dataset consists of 372
instances with 31 features which are collected under 2
different views. While the first view containing phys-
ical and financial values belonging to the project has
12 features, the second view containing general eco-
nomic variables and indices consists of 19 features.
Residential building dataset is a multiple output re-
gression problem that contains two output variables
which are construction costs and sale prices of single-
family residential apartments. In this study, we con-
struct a single non-linear D-AR network that predicts
both of these outputs during the feature extraction
step.
3 METHODS
3.1 CCA
Canonical correlation analysis (CCA) (Hotelling,
1992) is a way of measuring the linear relationship
between two multidimensional views that are related
with each other. Given two datasets X (N×m) and Y
(N×n)
X = [x
1
x
2
x
3
··· x
N
]
Y = [y
1
y
2
y
3
·· · y
N
]
(1)
where N is the total number of the instances, m
and n are the number of features in datasets X and
Y respectively, CCA aims to find two sets of basis
vectors, one for the first view X and the other for the
second view Y , such that the correlations between
the projections of the variables onto these basis
vectors are mutually maximized. More formally,
CCA aims tohttps://www.sharelatex.com/project/
5a3293785c827c59c12b54c7 maximize the correla-
tion between the linear combinations w
T
x
X and w
T
y
Y :
ρ = max
w
x
,w
y
corr(w
T
x
X, w
T
y
Y ) (2)
DATA 2018 - 7th International Conference on Data Science, Technology and Applications
108

ρ = max
w
x
,w
y
E[(w
T
x
X)(w
T
y
Y )
T
]
q
E[(w
T
x
X)(w
T
x
X)
T
]E[(w
T
y
Y )(w
T
y
Y )
T
]
= max
w
x
,w
y
w
T
x
E[XY
T
])w
y
q
w
T
x
E[XX
T
]w
x
w
T
y
E[YY
T
]w
y
(3)
where E denotes the expectation. The total covariance
matrix C of (X, Y )
C =
h
C
xx
C
xy
C
yx
C
yy
i
= E
h
X
Y
X
Y
T
i
(4)
is a block matrix, where C
xx
and C
yy
are within-set
covariance matrices, C
xy
= C
T
yx
are betweenset covari-
ance matrices. We can define the equation in (4) as
ρ = max
w
x
,w
y
w
T
x
C
xy
w
y
q
w
T
x
C
xx
w
x
· w
T
y
C
yy
w
y
w.r.t w
T
x
C
xx
w
x
= 1
w
T
y
C
yy
w
Y
= 1
(5)
Using the Lagrangian relaxation method, the CCA
optimization problem given in (5) is reduced to an
eigenvalue problem in the form of Ax = λBx.
C
xy
C
−1
YY
C
yx
w
x
= λ
2
C
xx
w
x
C
yx
C
−1
XX
C
xy
w
y
= λ
2
C
yy
w
y
(6)
The canonical correlations between X and Y can
be found by solving the eigenvalue equations
C
−1
xx
C
xy
C
−1
yy
C
yx
w
x
= λ
2
w
x
C
−1
yy
C
yx
C
−1
xx
C
xy
w
y
= λ
2
w
y
(7)
where the eigenvalues λ are the canonical correla-
tions, the eigenvectors w
x
and w
y
are the normalized
canonical correlation basis vectors. The number of
non-zero solutions to these equations are limited to
the smallest dimensionality of X and Y . The projec-
tions of X and Y onto these canonical vectors, w
T
x
X
and w
T
y
Y , are called canonical variables or covariates.
3.2 Kernel CCA
CCA is limited to discovering linear relationships
since it maximizes the correlations between linear
combinations of the views. To address this prob-
lem, kernelized version of CCA called Kernel canon-
ical correlation analysis (KCCA) has been proposed
which is capable of identifying the nonlinear relation-
ships between the views (Akaho, 2001). KCCA of-
fers an alternative solution by using a method known
as the kernel trick to find nonlinear correlated projec-
tions. In KCCA, before performing CCA, first each
view is projected into a higher dimensional feature
space using a nonlinear kernel function, where the
data can be linearly separable. In this stage, KCCA
maps x
i
and y
i
to φ(x
i
) and φ(y
i
)
x = (x
1
, . . . , x
n
) 7→ S
x
= (φ
1
(x), . . . , φ
N
(x))
y = (y
1
, . . . , y
n
) 7→ S
y
= (φ
1
(y), . . . , φ
N
(y)).
(8)
Then, CCA is applied to the obtained representations
φ(x
i
) and φ(y
i
).
Using the definition of the covariance matrix
in equation (4), we can rewrite the within-set and
between-set covariance matrices, C
xx
and C
xy
, as
C
xx
= S
T
x
S
x
C
xy
= S
T
x
S
Y
(9)
w
x
and w
y
are the projections of the data onto the di-
rections α and β
w
x
= S
T
x
α
w
y
= S
T
y
β
(10)
Substituting into equation (5), we obtain the follow-
ing
ρ = max
α,β
α
T
S
x
S
T
x
S
y
S
T
y
β
q
α
T
S
x
S
T
x
S
x
S
T
x
α · β
T
S
y
S
T
y
S
y
S
T
y
β
(11)
Let K
x
= S
x
S
T
x
and K
y
= S
y
S
T
y
be the kernel matrices,
ρ becomes
ρ = max
α,β
α
T
K
x
K
y
β
q
α
T
K
2
x
α · β
T
K
2
y
β
w.r.t α
T
K
2
x
α = 1
β
T
K
2
y
β = 1
(12)
In order to resolve computational issues in this
high dimensional dataset, partial Gram-Schmidt or-
thogonolisation (PGSO) is used to approximate the
kernel matrices. α and β can be found by resolving
(K
x
kI)
−1
K
y
(K
y
kI)
−1
K
x
α = λ
2
α
β =
(K
y
kI)
−1
K
x
α
λ
(13)
where k is the regularization parameter. Similar to
CCA, KCCA is known to be sensitive to outliers
(Sakar et al., 2014a; Branco et al., 2005) while de-
riving the nonlinear correlation subspace. Another
important problem of KCCA is its poor generaliza-
tion ability on unseen test examples (Biemann et al.,
2010; Yeh et al., 2014). The previous studies showed
Nonlinear Feature Extraction using Multilayer Perceptron based Alternating Regression for Classification and Multiple-output Regression
Problems
109
that KCCA tends to overfit to the training set with-
out proper regularization such as using reduced kernel
technique (Lee and Huang, 2007; Yeh et al., 2014).
In our experiments, since we do not apply a regular-
ization for the proposed MLP based alternating re-
gression technique such as weight decay, not to fa-
vor KCCA with an advanced regularization step we
apply principal component analysis (PCA) as a pre-
processing step to the views and then apply KCCA to
the obtained PCA representations (Zhu et al., 2012;
He et al., 2005).
3.3 Multilayer Perceptron
The proposed nonlinear D-AR method is based on the
use of two alternating multilayer perceptrons. A mul-
tilayer perceptron (MLP) is a type of feed-forward ar-
tificial neural networks that generates a set of outputs
from a set of inputs (Rumelhart et al., 1988). The
MLP architecture consists of several layers of nodes
between the input and output layers. An activation
function is applied to the output of a neuron for deci-
sion making. The neuron can learn linear or nonlin-
ear decision boundaries based on the nonlinear acti-
vation function of the hidden layer. The most com-
monly used activation functions are sigmoid, hyper-
bolic tangent (tanh) and rectified linear unit (ReLU)
functions. While the sigmoid function maps the input
to the range of 0 to 1 , tanh maps to values between
-1 and 1. ReLU allows only positive values to pass
through by mapping the negative values to zero.
The output layer of the network gives out the pre-
dictions to which an activation function is applied to
produce probability estimations in classification prob-
lems. In binary classification problems, a single neu-
ron in the output layer is passed through sigmoid
function. In multi-class problems, the output layer
consists of multiple neurons each representing a spe-
cific class and softmax activation function is applied
to produce the probability estimates for each class.
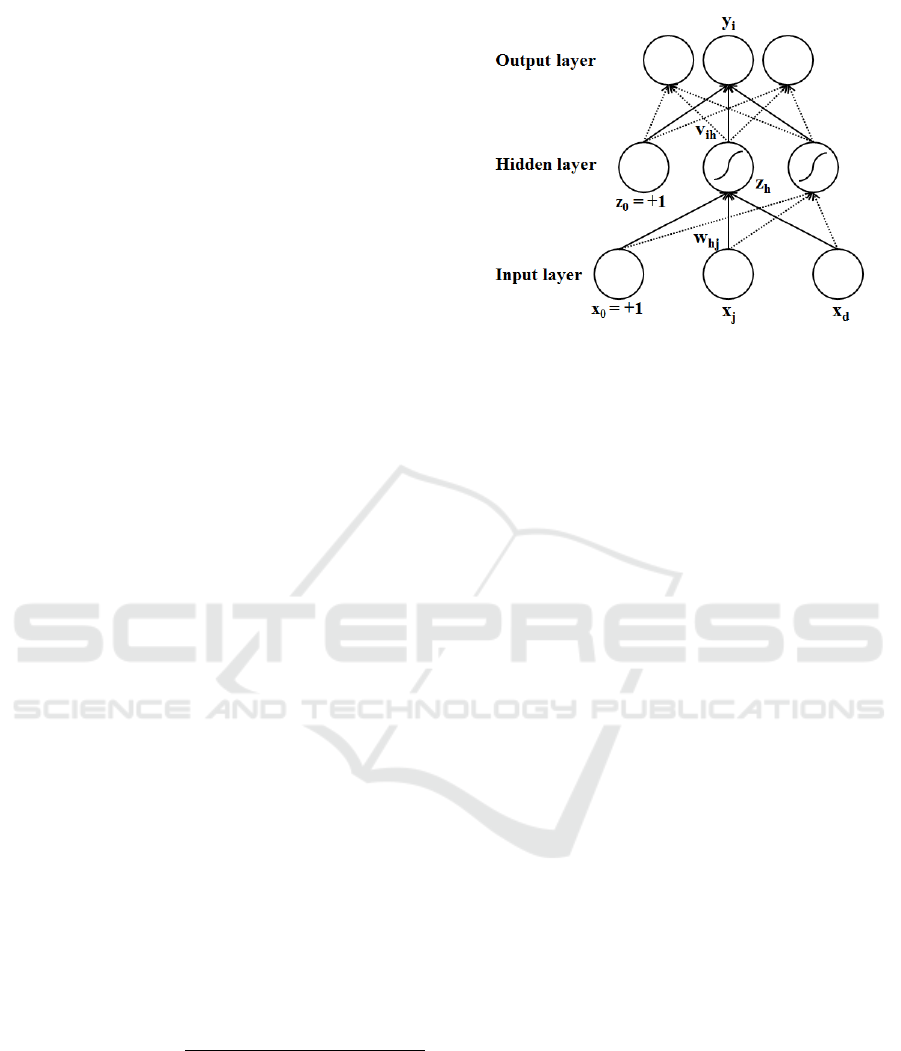
The basic network diagram of a multi-layer percep-
tron with one hidden layer is shown in Fig. 1. The
hidden and output layer nodes are calculated as
z
h
= sigmoid(w
T
h
x) =
1
1 + exp[−(
∑
d
j=1
w
h j
x
j
+ w
h0
)]
y
i
= v
T
i
z =
H
∑
h=1
v
ih
z
h
+ z
h
+ v
i0
(14)
In MLP, the backpropagation learning method,
which is a type of stochastic descent method (Rumel-
hart et al., 1986), is used to train the network. The
hidden layer weights, w, and output layer weights, v,
Figure 1: Multilayer perceptron architecture.
are updated according to the following rules until con-
vergence:
∆v
h
=
∑
t
(r
t
− y
t
)z
t
h
∆w
h j
= η
∑
t
(r
t
− y
t
)v
h
z
t
h
(1 − z
t
h
)x
t
j
(15)
3.4 Linear D-AR Method
To address the problems of CCA highlighted in intro-
duction section, a two-view feature extraction method
that aims to discover correlated and also discrimi-
native linear features by utilizing class labels in the
framework has already been proposed in (Sakar and
Kursun, 2017). In linear D-AR, both views have their
own MLPs where the input layer is composed of the
their own view features. With the help of the hid-
den layer, input layer of each MLP-based D-ARNet is
transformed into a lower dimensional subspace, then
the hidden layer is mapped to the output layer which
consists of both class labels and covariate outputs.
Covariate outputs are alternated between the corre-
sponding MLPs in order to maximize the correlation
between two views. Having class labels in the output
layer ensures to maximize the classification accuracy
as well, while maximizing the correlation with covari-
ate outputs. Class labels are not alternated between
views and original class labels are used in each itera-
tion. Training process of the network stops when the
correlation of the outputs between two views do not
change or iteration exceeds a certain limit.
The AR process starts with the first D-AR net-
work of view 1. Correlated outputs, ’s
x
’, hidden layer
weights, ’w
x
’, and output layer weights, ’v
x
’ are ini-
tialized with random values. Then, training process
starts for the first MLP with the given features, X,
in the input layer. Hidden layer values, z
x
, weights
w
x
and v
x
are updated for the first network during
DATA 2018 - 7th International Conference on Data Science, Technology and Applications
110

the training process and the final covariate outputs of
view 1 ’s
x
’ are calculated.
The total error function of the first D-AR Network
X can be written as
E
x
(w
x
, v
x
|X) = E
x
s
+ λE
x
r
(16)
where E
x
s
and E
x
r
are the errors of correlated output
nodes and class label, respectively, λ is the discrim-
ination factor which is used to trade off between the
correlation of the output units and the discriminative
ability of the network.
Since prediction of the correlated outputs is a re-
gression problem, sum-of-squares error function is
used to compute E
x
s
. On the other hand, depending on
the output variable type E
x
r
is calculated differently.
For classification problems like the emotion recogni-
tion task in this paper, cross-entropy function is used
to compute E
x
r
. For regression issues in which the out-
put is a numerical value, sum-of-squares error func-
tion is used. Thus, the total error function in (16) can
be re-written for classification problem as
E
x
(w
x
, v
x
|X) = E
x
s
+ λE
x
r
=
1
2
N
∑
t=1
k
∑
i=1
(s
y
it
− s
x
it
)
2
− λ
N
∑
t=1
p
∑
i=1
(l
it
logr
x
it
)
(17)
and for regression as
E
x
(w
x
, v
x
|X) = E
x
s
+ λE
x
r
=
1
2
N
∑
t=1
k
∑
i=1
(s
y
it
− s
x
it
)
2
+
1
2
N
∑
t=1
(r
x
0
t
− r
x
t
)
2
(18)
where N is the total number of instances, k is the
number of hidden layer nodes which represents the
number of the features extracted, ’w
x
’ and ’v
x
’ are the
hidden layer weights and output layer weights respec-
tively, l
it
is 1 if sample x
t
belongs to class i and 0 if
not, and r
x
it
is the predicted value of the ith class for the
sample t, r
x
0
t
is the predicted value of the tth sample
in regression problem, s
x
it
is the ith output of sample t
for View 1, X.
Hidden layer weights, w
x
, and output layer
weights, v
x
, of the MLPs are updated according to the
back-propagation algorithm (Rumelhart et al., 1986).
∂E
x
∂w
x
h j
=
k
∑
i=1
∂E
x
s
∂s
x
i
∂s
x
i
∂z
x
h
∂z
x
h
∂w
x
h j
+ λ
p
∑
i=1
∂E
x
r
∂r
x
i
∂r
x
i
∂z
x
h
∂z
x
h
∂w
x
h j
(19)
where w
x
h j
is the hidden layer weight between jth in-
put node and the hth hidden layer node of view 1, and
z
x
h
is the hth hidden node of view 1. The correlated
output units and predicted class labels of a given in-
stance x
t
are computed as follows:
s
x
it
=
k
∑
h=1
v
x
ih
z
x
ht
+v
x
i0
r
x
it
=
exp
∑
k
h=1
v
x
ih
z
x
ht
+ v
x
i0
∑
p
j=1
exp
∑
k
h=1
v
x
jh
z
x
ht
+ v
x
j0
(20)
where v
x
ih
is the output layer weight between hth
hidden and the ith correlated output node of view 1.
As it is seen in equation 24, the predicted values of
the class outputs, r
it
, are passed through softmax acti-
vation function in the output layer to obtain the prob-
ability estimates for each class. Output layer weights
are shared by the class label and correlated output
nodes with the aim of extracting discriminative fea-
tures while maintaining the correlated information of
the other view by producing the same outputs.
∆w
x
h j
=η
1
N
∑
t=1
k
∑
i=1
(s
y
it
− s
x
it
)v
x
ih
x
jt
+ λη
2
N
∑
t=1
k
∑
i=1
(l
it
− r
x
it
)v
x
ih
x
jt
∆v
x
ih
=η
1
N
∑
t=1
(s
y
it
− s
x
it
)z
x
ht
+ λη
2
N
∑
t=1
(l
it
− r
x
it
)z
x
ht
(21)
where η
1
and η
2
are the learning factors of the covari-
ate output and class labels respectively.
Same process applies for the second D-AR net-
work of view 2, however, this time the covariate out-
puts of view2, ’s
y
’, are not initialized randomly. In-
stead, covariate outputs of view 1 ’s
x
’ are fed into
’s
y
’, while keeping the class labels fixed in the out-
put layer. Once the training is completed for view
2, hidden layer values ’z
y
’, weights ’w
y
’ and ’v
y
’ are
updated for the second network and the final set of co-
variate outputs of view 2 ’s
y
’ are calculated. This time
s
y
are fed into first view outputs, ’s
x
’. This iterative
approach continues till the correlation of the outputs
between two views do not change or iteration exceeds
a certain limit.
One key note to highlight, as the alternated out-
puts tend to tune to the same direction to decrease
the minimum square error, they need to be decorre-
lated before being fed into the other D-AR network.
For this purpose, the cascading anti-Hebbian inhibi-
tion algorithm is used (Sakar and Kursun, 2017). The
Nonlinear Feature Extraction using Multilayer Perceptron based Alternating Regression for Classification and Multiple-output Regression
Problems
111

inhibition rule after each epoch is:
s
x
it
= s
x
it
−
i−1
∑
j=1
ρ(s
x
i
, s
x
j
)s
x
jt
(22)
where ρ(s
x
i
, s
x
j
) is the correlation coefficient be-
tween ith and jth outputs of view 1. If ’s
x
i
’ and ’s
x
j
’
are extremely correlated with each other, then the ith
output of view 1 is almost cleared.
4 PROPOSED NONLINEAR D-AR
METHOD
Even though the linear D-AR method avoids the use
of covariance matrices which are sensitive to outliers,
similar to CCA, D-AR is limited to exploring only the
linear relationships and cannot explore complex rep-
resentations. The method proposed in this paper is the
nonlinear version of (Sakar and Kursun, 2017). The
architecture of the proposed nonlinear D-AR method
is based on D-AR (Sakar and Kursun, 2017) and AR
(Sakar et al., 2014b) methods, implemented by two
multilayer perceptrons with nonlinear hidden layers.
The network diagram of the non-linear D-AR method
on multiple-output regression task is shown in Fig.
2. Using nonlinear activation function in the hidden
layer helps to explore complex relationships from the
views.
In the non-linear D-AR, different from linear D-
AR, the hidden layer values are passed through a non-
linear activation function as:
z
x
ht
= g
n
∑
i=1
x
t
i
w
x
ih
+ w
x
i0
(23)
where g is a nonlinear activation function such as
sigmoid, hyperbolic tangent or rectified linear unit,
and n is the number of features in view X. Update
rules of the hidden and output layer weights are de-
rived using gradient descent according to the activa-
tion function used in the hidden layer.
In this paper, we also propose to use the D-AR net-
work for multiple-output regression problem. Thus,
we aim to extract correlated features which carry
predictive information about multiple numerical out-
puts. For multiple-output regression problem total er-
ror function can be re-written as:
E
x
(w
x
, v
x
|X) = E
x
s
+ λE
x
r
=
1
2
N
∑
t=1
k
∑
i=1
(s
y
it
− s
x
it
)
2
+ λ
1
2
N
∑
t=1
m
∑
i=1
(r
x
0
ti
− r
x
ti
)
2
(24)
where m is the number of the outputs in the regres-
sion task. A single D-AR network is trained to mini-
mize the total error on the multiple outputs. Thus, we
aim to obtain a single set of features from each view
that contain important predictive information about
the target variables.
5 EXPERIMENTAL RESULTS
In our experiments, we have compared the discrim-
inative power of our proposed nonlinear D-AR al-
gorithm with linear D-AR, CCA and KCCA on the
Cohn-Kanade (CK+) facial expression recognition
dataset (Lucey et al., 2010) for classification and on
the Residential Building dataset (Rafiei and Adeli,
2015) for 2-output regression. We use two different
versions of nonlinear D-AR with sigmoid and Tanh
nonlinear activation functions in the hidden layer. For
evaluating the discriminative power of the features ex-
tracted with the methods used in this study, we use
random forest (RF) algorithm for both classification
and regression. For linear and nonlinear D-AR net-
works, the features extracted in the hidden layer of the
networks are fed to RF (Breiman, 2001). For CCA
and KCCA methods, the canonical variates are fed
into RF. The number of ensemble trees in RF algo-
rithm is selected as 100. Experiments are repeated for
different training set sizes and the number of covari-
ate outputs. For classification dataset, training sets are
selected as 35 (5 instance from each of the 7 classes),
70 (10 instance from each of the 7 classes) and 105
(15 instance from each of the 7 classes). For regres-
sion dataset, training sets are selected as 35 and 70.
The training and test data splits are repeated 10 times
and for statistical significance. For classification the
average of the accuracies and for regression the av-
erage of the total mean absolute errors obtained on
2-outputs (MAE) in these runs are reported.
For both linear and nonlinear D-AR networks, we
have selected different number of covariate outputs,
1 to 7, for our experiments. The hidden layer of the
networks contain 2 neurons in addition to the ones
representing covariate outputs, 3 to 9. For CCA and
KCCA, the number of covariate components are se-
lected from 3 to 9, which is the same with the num-
ber of hidden layer nodes in D-AR network. Princi-
pal component analysis (LII, 1901) is applied before
CCA and KCCA algorithms in order to improve the
robustness of the methods. We should note that in our
experiments the hidden layer is designed as a bottle-
neck layer in which the number of neurons is less than
that of the output layer. This can be seen as an im-
plicit regularization that enforces the networks tune to
DATA 2018 - 7th International Conference on Data Science, Technology and Applications
112
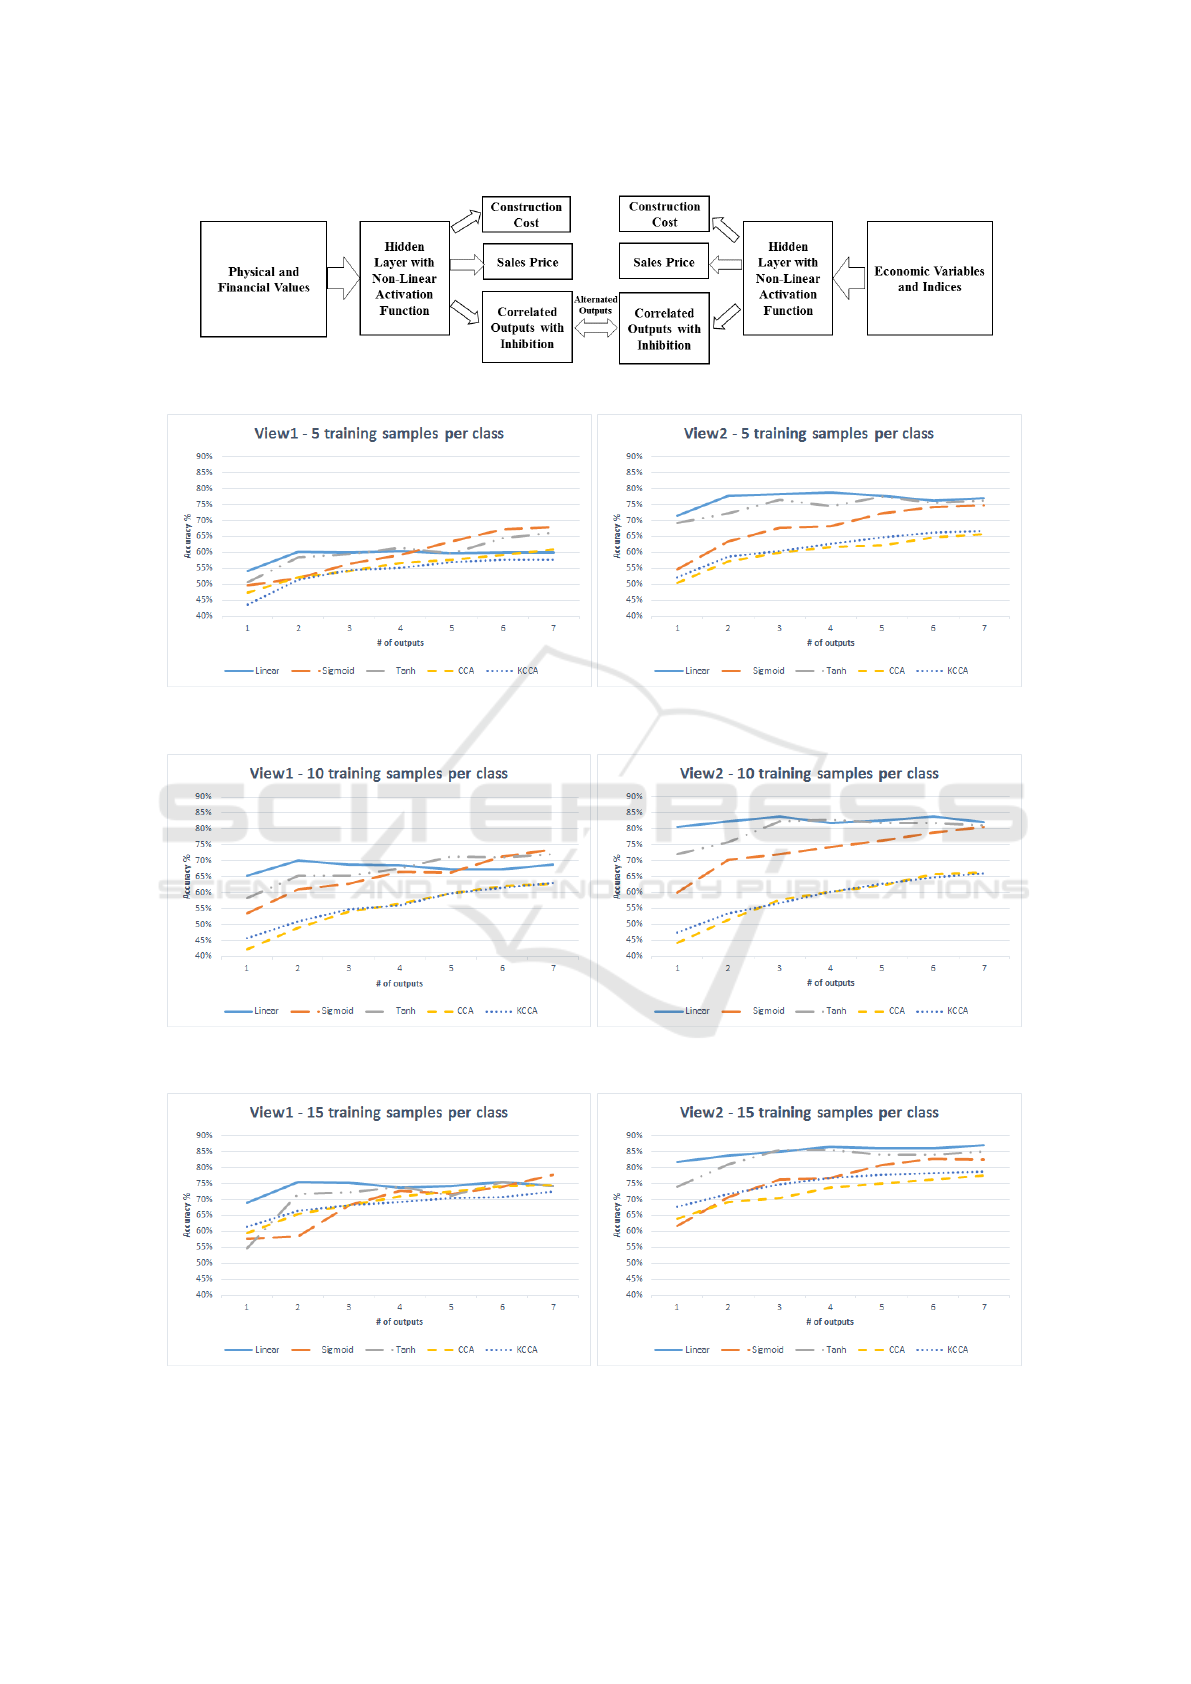
Figure 2: Block diagram of the non-linear version of D-AR on the multiple-output regression task: residential building dataset.
Figure 3: Cohn-Kanade (CK+) dataset: Number of covariate outputs versus accuracies obtained using 5 samples from each
class. (left) Accuracy of the covariates extracted from View 1 (right) Accuracy of the covariates extracted from View 2.
Figure 4: Cohn-Kanade (CK+) dataset:Number of covariate outputs versus accuracies obtained by using 10 samples from
each class. (left) Accuracy of the covariates extracted from View 1 (right) Accuracy of the covariates extracted from View 2.
Figure 5: Cohn-Kanade (CK+) dataset:Number of covariate outputs versus accuracies obtained using 15 samples from each
class. (left) Accuracy accuracy of the covariates extracted from View 1 (right) Accuracy of the covariates extracted from View
2.
Nonlinear Feature Extraction using Multilayer Perceptron based Alternating Regression for Classification and Multiple-output Regression
Problems
113
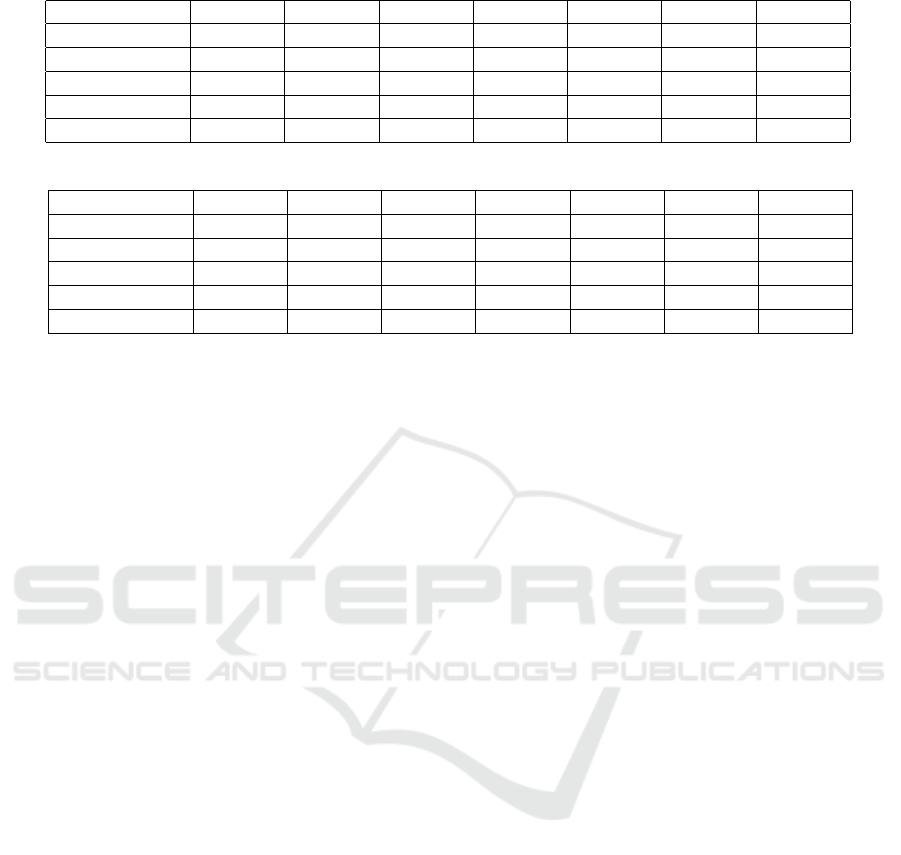
Table 1: Cohn-Kanade (CK+) dataset:Covariate output correlations of View 1 and View 2 for training set.
Method Output 1 Output 2 Output 3 Output 4 Output 5 Output 6 Output 7
CCA 100 100 100 100 100 100 100
KCCA 100 100 100 100 100 100 100
Linear D-AR 99 99 99 99 99 98 99
Sigmoid D-AR 90 89 40 35 29 16 18
Tanh D-AR 92 91 89 84 1 38 51
Table 2: Cohn-Kanade (CK+) dataset:Covariate output correlations of View 1 and View 2 for test set.
Method Output 1 Output 2 Output 3 Output 4 Output 5 Output 6 Output 7
CCA 52 39 47 41 44 31 30
KCCA 67 46 45 43 32 34 37
Linear D-AR 80 62 62 48 48 43 11
Sigmoid D-AR 82 81 24 30 21 18 14
Tanh D-AR 79 76 62 45 11 23 30
most generalizable information at the expense of los-
ing some rare relations which might be due to outliers
in some cases.
5.1 Cohn-Kanade (CK+) Dataset
Fig. 3 shows the test set accuracies versus the number
of covariate outputs obtained using 5 samples from
each class. While the left chart displays the accuracy
when the covariates extracted from view 1 are fed to
RF algorithm, the right chart displays the accuracies
obtained with view 2 covariates. Figures 4 and 5 dis-
play the accuracies when training set is selected as 10
and 15 samples from each class, respectively. In gen-
eral, it is seen that view 2 has better classification ac-
curacy when compared to view 1 for all methods and
training set sizes. Thus, we can conclude that the dis-
criminative power of the features extracted from view
2 are higher than those extracted from view 1.
As it can be seen from the figures, the accuracy
obtained with the features of linear D-AR network
surpasses CCA which is in parallel to the results ob-
tained with different classifiers in (Sakar and Kur-
sun, 2017). We also see that the accuracies obtained
with the features of both versions of nonlinear D-
AR network, sigmoid and tanh, are higher than that
of KCCA. In figure 5, it is seen that when we have
sufficient number of classes from each set (15), the
discriminative performances of the methods are get-
ting closer to each other when compared to figures 3
and 4. On the other hand, when we have limited in-
formation for each view, D-AR networks learn more
from each other and gain more advantage over CCA
and KCCA. During training phase of D-AR networks,
both views interact and learn from each other and fur-
ther improve their own discriminative accuracy using
correlated outputs and class labels together.
With the increase in the number of covariate out-
puts, the accuracy first increases, stabilizes after some
point and then fluctuates. Another important obser-
vation is that the accuracy of the nonlinear D-AR
with sigmoid function increases more with increas-
ing number of covariate outputs when compared to
its linear version. This is because the linear D-AR is
limited to explore linear relationships and cannot ex-
plore additional complex relations with limited train-
ing sample size. We should also note that although in
general linear D-AR provides the highest accuracy for
view 2, it does not improve the accuracy of the other
view significantly. On the other hand, with increasing
number of covariates, the nonlinear D-AR improves
the performance of both view 1 and view 2 which
shows that the networks guide each other well during
the alternating regression procedure. As a result of
this interaction, in view 2, nonlinear D-AR achieves
the performance of linear D-AR with more covariate
outputs, and in view 1, the features of nonlinear D-AR
surpass the features of linear D-AR in classification
performance.
Table 1 and 2 display the covariate correlations
of View 1 and View 2 explored by CCA and KCCA
along with the correlations of the covariate outputs
of the D-AR networks for the training and test sets,
respectively. The training set correlations of CCA
and KCCA presented in these tables show that these
methods overfit to the training set and do not gener-
alize well on the test set. All 3 versions of the D-AR
networks have higher correlations on the test set than
CCA and KCCA. These results are in parallel with the
accuracies obtained on the emotion recognition task.
5.2 Residential Building Dataset
As we have two outputs in this dataset, the results are
computed and shown in terms of the sum of MAEs on
output 1 and output 2. Fig. 6 shows the sum of the
DATA 2018 - 7th International Conference on Data Science, Technology and Applications
114
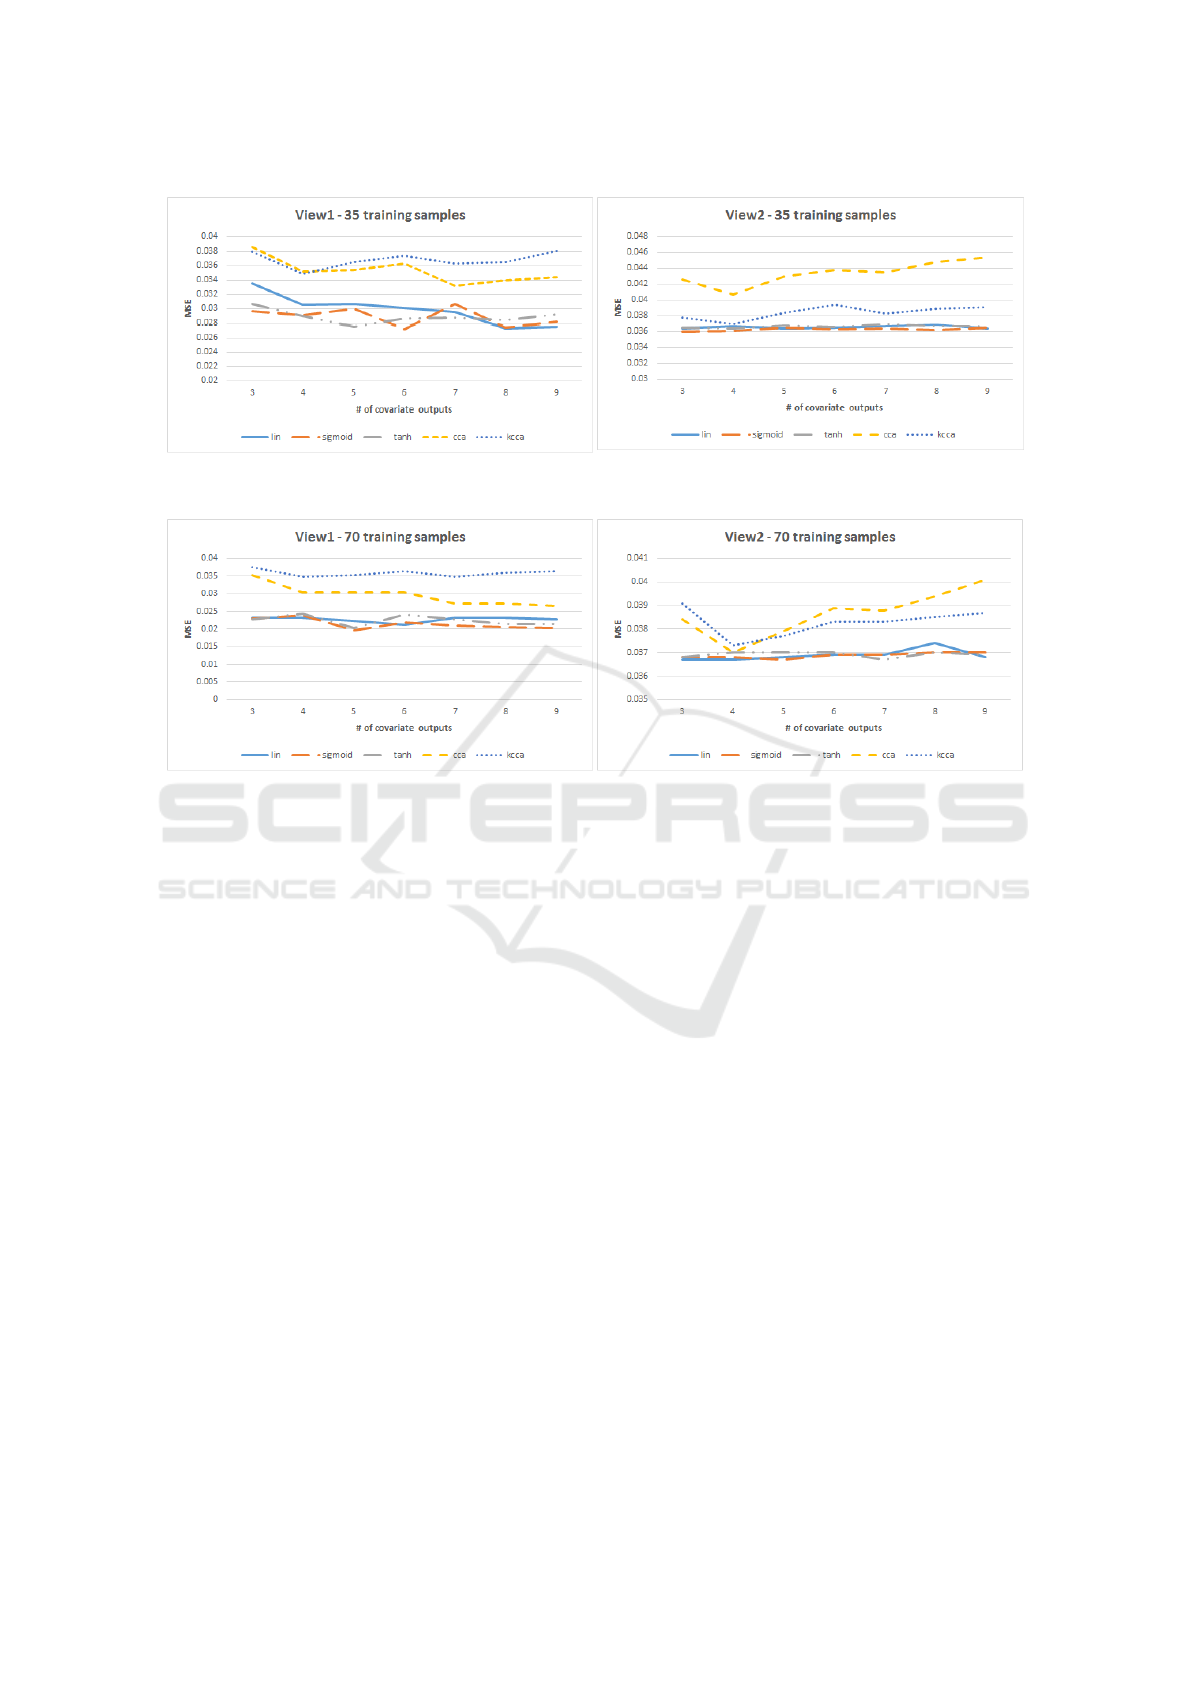
Figure 6: Residential Building dataset: Number of covariate outputs versus MSE obtained using 35 training samples. (left)
MSE of the covariates extracted from View 1 (right) MSE of the covariates extracted from View 2.
Figure 7: Residential Building dataset:Number of covariate outputs versus MSE obtained by using 70 training samples. (left)
MSE of the covariates extracted from View 1 (right) MSE of the covariates extracted from View 2.
mean absolute errors (MAE) obtained on 2-outputs
versus the number of covariate outputs using 35 train-
ing samples. While the left chart displays the sum of
MAE when the covariates extracted from view 1 are
fed to RF algorithm, the right chart displays the sum
of MAE obtained with view 2 covariates. Fig. 7 dis-
plays the sum of MAE when 70 training samples are
used for training.
As it can be seen from the figures, the MAE ob-
tained with CCA features is higher than that of lin-
ear D-AR which is in parallel to the classification re-
sults of the Cohn-Kanade (CK+) dataset. We also see
that the MAE calculated with the features of both ver-
sions of nonlinear D-AR network, sigmoid and tanh,
are less than that of KCCA. As seen in Figure 6, non-
linear and linear versions of D-AR network of View 2
are very similar for all values of covariate outputs. On
the other hand, for lower values of covariate outputs
the features extracted from View 1 using linear D-AR
network has higher error rate when compared to the
non-linear versions.
In figure 7, it is seen that when we have suffi-
cient number of training samples, performances of the
methods are getting closer to each other when com-
pared to figure 6. Similar to classification experiment,
when we have limited information for each view, D-
AR networks learn more from each other and gain
more advantage over CCA and KCCA. During train-
ing phase of D-AR networks, both views interact and
learn from each other and further improve their own
performance. With the increase in the number of co-
variate outputs, the MAE first decreases, stabilizes af-
ter some point and then fluctuates.
6 CONCLUSIONS
Kernel canonical correlation analysis (KCCA) aims
to find the nonlinear relationships between two multi-
dimensional views that are related with each other.
Although KCCA features can be used for classifica-
tion and regression problems, KCCA tends to over-
fit to the training set without proper regularization.
Besides, KCCA is an unsupervised technique which
does not utilize class labels or numerical target vari-
ables for feature extraction.
In this paper, we propose the nonlinear version
of the discriminative alternating regression (D-AR)
method which uses target information during feature
extraction. The nonlinear D-AR combines two alter-
nating multilayer perceptrons (MLP) with nonlinear
Nonlinear Feature Extraction using Multilayer Perceptron based Alternating Regression for Classification and Multiple-output Regression
Problems
115

hidden layers. We also propose to use D-AR network
for multiple-output regression task. The discrimina-
tive and predictive performance of the features ex-
tracted with the proposed nonlinear D-AR network is
compared to that of linear D-AR, CCA and KCCA al-
gorithms. We use random forest algorithm as the base
classifier. Experimental results on publicly available
emotion recognition and residential building dataset
show that the features of the nonlinear D-AR network
give significantly higher accuracies and less errors
than that of KCCA on classification and regression
problems, respectively. Another important finding is
that although KCCA explores highly correlated co-
variates on the training set, all versions of the D-AR
network have higher correlations on the test set than
CCA and KCCA, which is in parallel with the test
set performances obtained on the supervised learning
tasks.
As a future research direction, advanced regu-
larization techniques can be applied to both KCCA
and the proposed network to improve their robust-
ness against outliers. The robustness of KCCA can
be improved using a reduced kernel method while the
proposed method can be improved using weight de-
cay mechanism or another backpropagation algorithm
such as resilient backpropagation with weight back-
tracking.
ACKNOWLEDGEMENTS
This research has been supported by Turkish
Scientific and Technological Research Council
(TUBITAK) project 215E008.
REFERENCES
Akaho, S. (2001). A kernel method for canonical correla-
tion analysis. In In Proceedings of the International
Meeting of the Psychometric Society (IMPS2001.
Springer-Verlag.
Asuncion, A. and Newman, D. (2007). Uci machine learn-
ing repository. irvine, ca: University of california,
school of information and computer science. URL
[http://www. ics. uci. edu/ mlearn/MLRepository.
html].
Bach, F. R. and Jordan, M. I. (2003). Kernel independent
component analysis. J. Mach. Learn. Res., 3:1–48.
Biemann, F., Meinecke, F. C., Gretton, A., Rauch, A.,
Rainer, G., Logothetis, N. K., and Mller, K. R. (2010).
Temporal kernel cca and its application in multimodal
neuronal data analysis. 79.
Branco, J. A., Croux, C., Filzmoser, P., and Oliveira, M. R.
(2005). Robust canonical correlations: A comparative
study. Computational Statistics, 20(2):203–229.
Breiman, L. (2001). Random forests. Machine Learning,
45(1):5–32.
Cai, J. and Huang, X. (2017). Robust kernel canonical cor-
relation analysis with applications to information re-
trieval. Eng. Appl. Artif. Intell., 64(C):33–42.
Chen, J., Bushman, F. D., Lewis, J. D., Wu, G. D., and
Li, H. (2012). Structure-constrained sparse canonical
correlation analysis with an application to microbiome
data analysis. 14.
He, Y., Zhao, L., and Zou, C. (2005). Face recognition
based on pca/kpca plus cca. In Advances in Nat-
ural Computation, pages 71–74, Berlin, Heidelberg.
Springer Berlin Heidelberg.
Hotelling, H. (1992). Relations Between Two Sets of Vari-
ates, pages 162–190. Springer New York, New York,
NY.
Hsieh, W. W. (2000). Nonlinear canonical correlation anal-
ysis by neural networks. Neural Netw., vol. 13, no. 10,
pp. 10951105.
Huang, S. Y., Lee, M. H., and Hsiao, C. K. (2009). Non-
linear measures of association with kernel canonical
correlation analysis and applications. Journal of Sta-
tistical Planning and Inference, 139(7):2162 – 2174.
Karaali, A. (2012). Face detection and facial expression
recognition using moment invariants.
Lai, P. L. and Fyfe, C. (1998). Canonical correlation anal-
ysis using artificial neural networks. Proc. 6th Eur.
Symp. Artif. Neural Netw., Bruges, Belgium, Apr, pp.
363367.
Lee, Y. J. and Huang, S. Y. (2007). Reduced support vector
machines: A statistical theory. IEEE Transactions on
Neural Networks, 18(1):1–13.
Li, Y. and Shawe-Taylor, J. (2006). Using kcca
for japanese—english cross-language information re-
trieval and document classification. J. Intell. Inf. Syst.,
27(2):117–133.
LII, K. P. F. S. (1901). Liii. on lines and planes of closest fit
to systems of points in space. The London, Edinburgh,
and Dublin Philosophical Magazine and Journal of
Science, 2(11):559–572. PCA beginnings.
Lucey, P., Cohn, J. F., Kanade, T., Saragih, J. M., Am-
badar, Z., and Matthews, I. A. (2010). The extended
cohn-kanade dataset (ck+): A complete dataset for
action unit and emotion-specified expression. 2010
IEEE Computer Society Conference on Computer Vi-
sion and Pattern Recognition - Workshops, pages 94–
101.
Melzer, T., Reiter, M., and Bischof, H. (2001). Nonlinear
feature extraction using generalized canonical correla-
tion analysis. In Artificial Neural Networks — ICANN
2001, pages 353–360, Berlin, Heidelberg. Springer
Berlin Heidelberg.
Pezeshki, A., Azimi-Sadjadi, M. R., and Scharf, L. L.
(2003). A network for recursive extraction of canon-
ical coordinates. Neural Netw., vol. 16, nos. 56, pp.
801808.
Rafiei, M. and Adeli, H. (2015). Novel machine learning
model for estimation of sale prices of real estate units.
ASCE, Journal of Construction Engineering & Man-
agement, 142(2), 04015066.
DATA 2018 - 7th International Conference on Data Science, Technology and Applications
116

Rumelhart, D. E., Hinton, G. E., and Williams, R. J. (1986).
Parallel distributed processing: Explorations in the
microstructure of cognition, vol. 1. chapter Learning
Internal Representations by Error Propagation, pages
318–362. MIT Press, Cambridge, MA, USA.
Rumelhart, D. E., Hinton, G. E., and Williams, R. J. (1988).
Neurocomputing: Foundations of research. chapter
Learning Internal Representations by Error Propaga-
tion, pages 673–695. MIT Press, Cambridge, MA,
USA.
Sakar, C. O. and Kursun, O. (2017). Discriminative fea-
ture extraction by a neural implementation of canoni-
cal correlation analysis. IEEE Transactions on neural
networks and learning systems, Vol.28, No.1.
Sakar, C. O., Kursun, O., and Gurgen, F. (2014a). Ensemble
canonical correlation analysis. Applied Intelligence,
40(2):291–304.
Sakar, C. O., Kursun, O., and Gurgen, F. (2014b). Feature
extraction based on discriminative alternating regres-
sion. In PRoa Romero L. (eds) XIII Mediterranean
Conference on Medical and Biological Engineering
and Computing 2013. IFMBE Proceedings, MEDI-
CON’2013.
Sakar, C. O., Kursun, O., Karaali, A., and Erdem, C. E.
(2012). Feature extraction for facial expression recog-
nition by canonical correlation analysis. In Proc. IEEE
20th Signal Process. Appl. Conf., Mugla, Turkey pp.
1-3.
Sch
¨
olkopf, B. (2000). The kernel trick for distances. In Pro-
ceedings of the 13th International Conference on Neu-
ral Information Processing Systems, NIPS’00, pages
283–289, Cambridge, MA, USA. MIT Press.
Sun, T. and Chen, S. (2007). Locality preserving cca with
applications to data visualization and pose estimation.
25:531–543.
Ulukaya, S. (2011). Affect recognition from facial expres-
sions for humancomputer interaction. MSc Thesis,
Bahcesehir University.
Wold, H. (1966). Nonlinear estimation by iterative least
squares procedures. Research Papers in Statistics
(Festschrift for J. Neyman), F. N. David, Ed. New York,
NY, USA: Wiley, pp. 411444.
Yeh, Y. R., Huang, C. H., and Wang, Y. C. F. (2014). Het-
erogeneous domain adaptation and classification by
exploiting the correlation subspace. IEEE Transac-
tions on Image Processing, 23(5):2009–2018.
Zhu, X., Huang, Z., Shen, H. T., Cheng, J., and Xu,
C. (2012). Dimensionality reduction by mixed ker-
nel canonical correlation analysis. Pattern Recogn.,
45(8):3003–3016.
Nonlinear Feature Extraction using Multilayer Perceptron based Alternating Regression for Classification and Multiple-output Regression
Problems
117
