
Stability Analysis of a Regulated Oxygen Mask
Geoffray Battiston, Dominique Beauvois, Gilles Duc and Emmanuel Godoy
Laboratoire des Signaux et Systèmes (L2S), Centrale-Supélec, CNRS, Université Paris-Sud,
Université Paris-Saclay, 3 rue Joliot Curie, 91192 Gif sur Yvette, cedex, France
Geoffray.Battiston@centralesupelec.fr, Dominique.Beauvois@centralesupelec.fr,
Keywords: Stability Analysis, Pneumatic Systems.
Abstract: We analyse the stability of a regulated oxygen mask distributing oxygen in response to an inhalation demand.
The mask pressure exhibits troublesome vibrations after the demand reaches a certain flow value. Starting
from a simple nonlinear model, we perform a local linear stability analysis which highlights that the real part
of two eigenvalues is positive when this system is chattering. We propose then adjustments of some
parameters of this purely mechanical system in order to avoid this phenomenon. These adjustments have been
tested and validated experimentally.
1 INTRODUCTION
In an airplane, in order to avoid hypoxia accidents
which can be due to fire or cabin depressurization,
some international aviation agencies (like NATO,
1991 or EASA, 2012) impose the availability and
performance of an oxygen supply for aircraft pilots.
We analyze the stability of a regulated oxygen mask
distributing oxygen in response to an inhalation
demand. The mask pressure exhibits troublesome
vibrations after the demand reaches a certain flow
value. Starting from a simple nonlinear model, we
perform a local linear stability analysis which
highlights that the real part of two eigenvalues is
positive when this system is chattering. We propose
then adjustments of some parameters of this purely
mechanical system in order to avoid this
phenomenon.
The regulated oxygen mask studied in this paper
satisfies all the requirements but still presents a mask
pressure vibration issue which can disturb an inhaling
pilot. For comfort reasons, these vibrations must be
suppressed. The regulator of the mask is made of
purely mechanical elements and for cost reasons we
can only adjust its physical parameters.
As in many studies of pneumatic systems, we
cope with relief valves which introduce amplitude
constraints in addition to nonlinearities linked to the
nature of the flows in the pneumatic circuit. It is
known that valves coupled with a phase shifting
element like a long tube or volume can be affected
with various dynamical behaviours like chattering,
fluttering, pressure surge, etc. (a complete review for
pressure relief valves can be found in Hös et al.,
2017). Chattering, which concerns us the most here,
is basically the situation where the valve starts
touching its support. The study of the chattering
phenomenon is linked to this grazing bifurcation and
can be found in multiple papers (see for instance,
Budd, 1996, Chin et al., 1994, Casas et al., 1996 or
Molenaar et al., 2001) or books (see Bernardo et al.,
2008).
The classical method for such a study is, usually
first, to perform a stability analysis of a linearized
model of this nonlinear system to find the possible
instabilities, Hopf bifurcations (see for instance,
Maeda, 1970, MacLeod, 1985), secondly to
eventually use nonlinear tools (normal form
reduction, center manifold reduction, Lyapunov
exponents, etc.) to analyze the trajectory of the
system variables until a grazing bifurcation appears
(Hayashi et al., 1997, Licsko et al., 2009). Thirdly,
the grazing bifurcation can be studied by finding a
Poincaré map which describes the essential dynamics
of the oscillating valve that collides with its support
(see the suggestions about chattering in the papers
cited above). In this paper, we will only focus on the
first step, which is finding the conditions provoking
the chattering effect, and see if it is possible to find
any stability condition for the regulated mask and
how it can be fulfilled by modifying some physical
parameters.
Battiston, G., Beauvois, D., Duc, G. and Godoy, E.
Stability Analysis of a Regulated Oxygen Mask.
DOI: 10.5220/0006848203170324
In Proceedings of the 15th International Conference on Informatics in Control, Automation and Robotics (ICINCO 2018) - Volume 1, pages 317-324
ISBN: 978-989-758-321-6
Copyright © 2018 by SCITEPRESS – Science and Technology Publications, Lda. All rights reserved
317
Note that a first idea is to perform the linear
stability analysis on a very accurate model to
understand accurately the sensitivity of the vibrations
and determine conditions on the parameters for their
apparition. However it appeared we can still get a
similar analysis and accurate conclusions with a
simplified model which we present here.
The model equations are presented in section 2. A
stability analysis for this model is performed in
section 3 in order to find the conditions of stability
and which parameters must be modified to satisfy
them. In section 4, the results of one modification on
the regulator are shown and the direct consequence
for the pilot is studied in section 5.
2 MODEL OF THE OXYGEN
REGULATOR
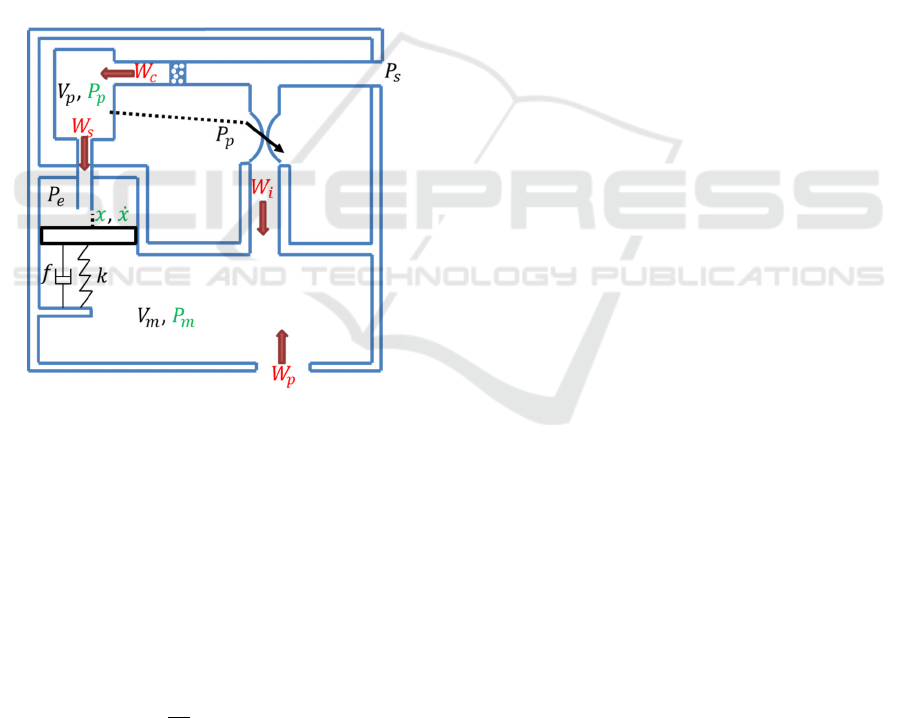
Figure 1: Definition sketch of the mathematical model. In
red, the mass flows, in green, the future state variables. The
dashed line represents a pressure measurement.
A schematic diagram of the oxygen mask is given on
Fig.1: the flow demand
is detected with a
comparator balancing a constant rest pressure
and
the mask pressure
evaluated in the mask volume
where the pilot breathes; its behaviour is described
by the virtue of a mass conservation equation, which
simply integrates all the mass flow values entering the
corresponding volume:
=
+
(1)
where the mass flow
of the pilot’s inhalation is
negative.
is described later. represents the
oxygen gas constant and the gas temperature
(whose variation in the whole pneumatic circuit is
neglected for simplicity).
The comparator is basically modelled as a spring
mass system with viscous friction (damping f) and
positive preconstraint
, consisting in a spring of
stiffness k and a rigid disk of mass m, on which three
static pressures applies,
,
() and
() over two
distinct surfaces
and
. For a displacement
greater than 0, we obtain:
=−
−(+
)+
(
−
)
+
−
(2)
Before an inhalation, the comparator is closed,
and
=
(it will become obvious later with
equations (6) and (7)). Because of the spring
preconstraint, it opens when the difference
−
equals some threshold
which corresponds to
the limit of opening =0 and is given by:
+
(
−
+
)
−
=0
(3)
We subtract the last two equations and neglect
−
−
in front of
−
(which is justified
experimentally) and get the equation for the moving
comparator when >0:
=−
−+
(
−
−
)
+
−
(4)
At =0, the comparator enters in contact with a
tube which may lead to a bounce (the chattering
effect) or a simple closing. This acts as a lower limit
for a saturation effect but also as a threshold to open
the comparator.
The vertical displacement
x
of the comparator can
open this evacuation tube (in which the propagative
effects are neglected due to its small length), in which
the pressure will be approximated by
(due to the
small speed of the oxygen flow inside it).
For physicists, this system can be qualified as an
extended flapper nozzle valve due to the presence of
the
term. For reasons linked to the Reynolds
number of the flow going through this dispositive, its
modeling is in general far trickier that the simple
proportional term
−
as above (see McCloy
and Martin, 1980). In this case, all the nonlinearities
linked to this kind of systems (Reynolds number, flat
of the support) will be caught into
which in the case
of our study will be considered constant and
estimated via experimental measurements.
The tube is connected to a small volume, the
whole gathered into a mathematical volume
. The
mass flows
leaves
thanks to the opening of the
comparator, and the flow
enters
to refill it.
ICINCO 2018 - 15th International Conference on Informatics in Control, Automation and Robotics
318

is determined with a Saint-Venant law for
sonic flows:
=2
2
+1
=
(5)
with
the support internal radius and the Laplace
coefficient.
is more accurately modelled with an
isothermal Hagen-Poiseuille law in which the
pressure
is the constant regulator supply pressure:
=
(
−
)
(6)
Hence the mass conservation equation in volume
can be written as:
=
(
−
)
(7)
In this configuration, physics always imposes the
working region:
≥
, that is
≥0. Indeed, if
=0, then
=0 and
increases until it reaches
. Moreover, the regulator never starts with a
pressure
greater than
.
Now, we introduce the regulating actuator, which
delivers the mass flow
filling the mask volume
depending on the difference between
and
:
=
−
−
,
≤
−
0,
>
−
(8)
where
is the threshold for
−
to start
delivering a mass flow.
There are finally one threshold for the comparator
and one for the actuator. Indeed, these thresholds
have a destabilizing effect due to the mechanical
delay imposed to the system response. From
experimental observations, the instability we seek to
prevent only occurs when these two thresholds are
overcome. Nevertheless, if we wanted to characterize
the chattering phenomenon, we would have to take
them into account.
3 STABILITY ANALYSIS
We write the state vector of this system, the input
vector , and the external conditions vector as:
=
,=
,=
(9)
From Eq. (1) to (8), the state equations are
deduced:
=
−
−
−
+
+
−
+
+
(
−
)
−
−
+
(10)
with =
(
−
)
/−
/. Writing state
variables at the equilibrium with a bar, the
equilibrium conditions for this system are:
=
−
−
+
−
(11)
−
−
=−
=
(12)
−
=
(13)
That is:
=(
(
−
)
+
−
−
)/
(14)
=−
/
+
−
(15)
=
/
−
(16)
We linearize equations (10) around these
equilibrium points and get the Jacobian
J
of this
system:
=
+−−
−
−−−
)2(00
000
0010
xkPk
V
rT
Pk
V
rT
k
V
rT
m
S
m
S
m
f
m
k
spc
p
ps
p
i
m
sm
(17)
The characteristic equation of the linearized
system is:
(
)
=
+
+
+
+
(18)
with:
=−
(
2,2
)
−
(4,4)
(19)
=
(
2,2
)
(
4,4
)
−
(2,1)
(20)
=
(
2,1
)
(
4,4
)
−
(
4,1
)
(2,4)
(21)
=−
(
4,1
)
(
2,3
)
(3,4)
(22)
Stability Analysis of a Regulated Oxygen Mask
319

Those four coefficients are positive. It can be
noticed using (16) that:
(
4,4
)
=−
2
+
=−
+
(23)
the derivative of which is:
(
4,4
)
=−
1−
(24)
(15) shows that the steady state value
decreases
with
=−W
below
i.e. the derivative (24) is
strictly positive when the regulator is delivering
oxygen. So
J
(4,4) is then strictly increasing with the
demand once
<
.
The Routh criterion is now used to infer the
conditions for stability of the linearized model. The
five Routh terms of the first column of the Routh chart
are:
1
−
(
+
−
)/(
−
)
Routh terms 1, 2 and 5 are positive, so that
stability is guaranteed if terms 3 and 4 are positive
too. Routh term 4 is written under the given form to
make appear Routh term 3.
A detailed calculation gives:
−
=
+
+
+
+
+
−
+
(
+
)
+
+
(25)
A change of sign can come from the third term of
the numerator of (25). We choose a sufficient
condition for positivity which at the same time avoids
dealing with lengthy equations:
−
>0
(26)
(26) shows that Routh term 3 is always positive if
and are increased or
,
,1/
,1/ are
decreased.
Using the positivity of Routh term 3 and
, we
immediately get a condition for positivity of
remaining Routh term 4:
+
−
<0
(27)
Unless the first term of (27) is null, which is
physically impossible since it would prevent the
regulator from working, if multiplied by
condition (27) can be written as:
<
(28)
where:
=
(
)
(
+
+
)
=−
+
+
+
+
+
×
+
+
×
+
+
This condition must be respected for all
and
can be simplified even more using the monotonicity
of
and (4,4) and adding an interval condition
which can be justified by mechanical restrictions:
3
<
<
(29)
From this consideration, it can be claimed that :
<
(
+
10
/3)
=′
(30)
and:
>
4
+
+
2
+
×
2
+
×
+
2
=′
(31)
ICINCO 2018 - 15th International Conference on Informatics in Control, Automation and Robotics
320
Fre
q
A sufficient condition for stability for all
is
then:
<′
(32)
Clearly, in order to satisfy (32),
and
, which
appear only in
, can be modified. It is also possible
to show that for the current parameter values, ′ is
increasing with .
From stability conditions (26) and (32), we
conclude that among all the possibilities of parameter
shift, an increase of can lead to stability for the
system.
4 EXPERIMENTAL AND
SIMULATION RESULTS
In this section, we compare experimental and
simulation results before and after the increase of the
spring’s stiffness. Increasing is one mechanical
simple operation since it just requires a replacement
of the comparator’s spring.
The exact value of
and approximate value of x
are available through experiments. This enables us to
compare the averaged trajectory of the pressures with
the simulation.
Experiments and simulations were performed for
a linear negative ramp demand
. They show the
multiplication of by 2 actually works pretty well
since after a modification of the spring value, the
regulator stopped chattering. This can be clearly seen
in Fig. 2.
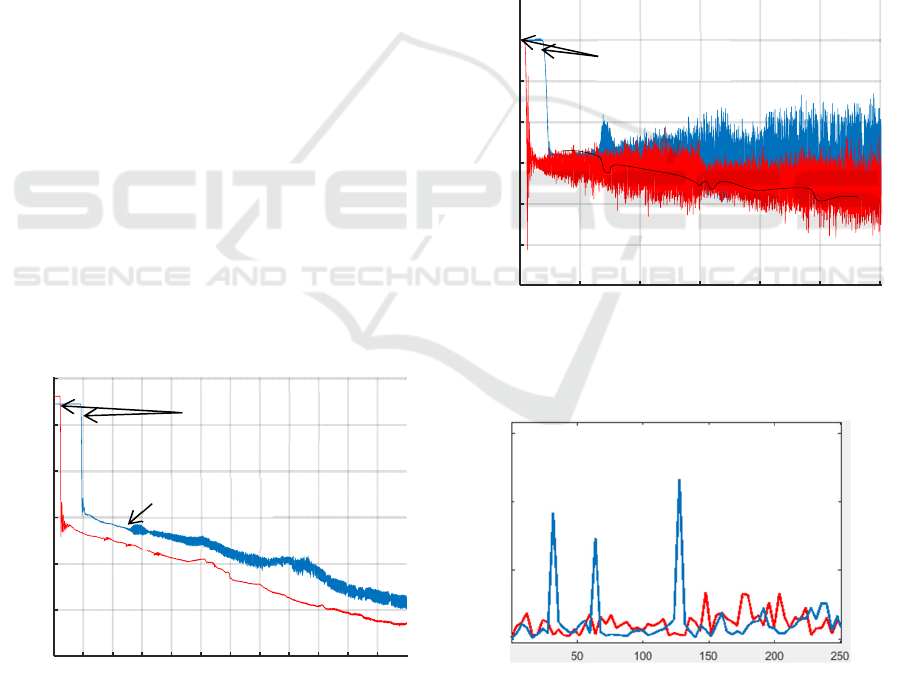
Figure 2: Measurements of
before (blue) and after (red)
the modification of the spring’s stiffness.
We precise that no numerical values are given due
to confidentiality reasons.
Fig. 3 shows noisy measurements of
(in red)
with a smaller envelope using the modified spring ;
the spectrum of
plotted on Fig. 4 confirms that
chattering was eradicated since the three frequency
peaks at 32, 64 and 128 Hz have vanished leaving
only noise due to the sensor and the flow
recirculation. Note that the spectrum has been plotted
here for the same constant mass flow demand
.
This comparison remains the same for all mass flows,
excepted that the regulator endeavors the well- known
phenomenon of period adding before the
modification (see Budd, 1996).
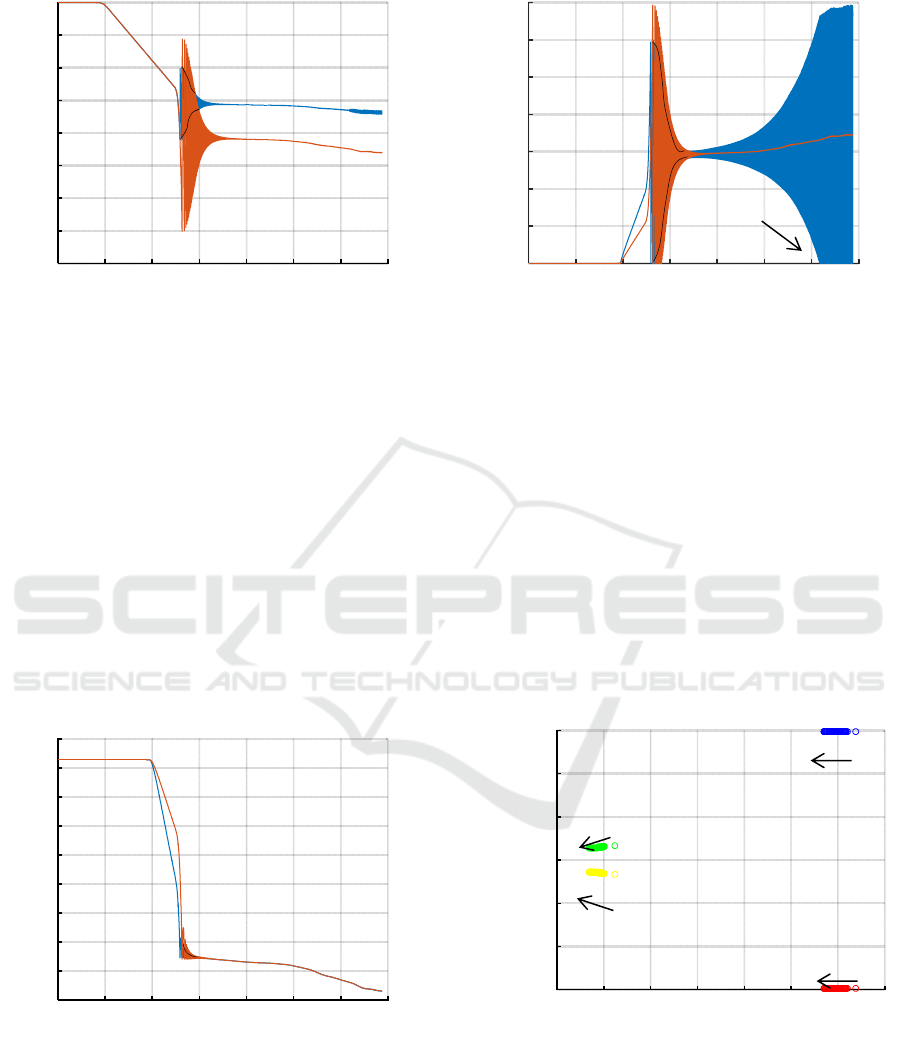
Simulation results plotted on Fig. 5 show that
chattering of
is barely visible at the end of the blue
curve, while it doesn’t exist after the modification,
whereas it cannot be seen on the curves of
on
Fig. 6.
Figure 3: Measurements of
before (blue) and after (red)
the modification of the spring’s stiffness. The black line
highlights the envelope of the blue curve.
Figure 4: Amplitude spectrum of
before (blue) and after
(red) the modification of the spring’s stiffness (x-axis
represents the frequency in Hz).
Time
Opening of the
comparator
Beginning of
chattering
Time
Beginning of
ramp demand
Amplutide
Stability Analysis of a Regulated Oxygen Mask
321
Time
Real part
Figure 5: Simulation results for
before (blue) and after
(red) the modification of the spring’s stiffness. The black
lines highlight the envelope of the blue curve.
In addition a good way to show the chattering is
to plot the displacement of the comparator (Fig. 7),
which is touching its support when goes to zero.
It is also possible to plot the eigenvalues of the
linearized model at regularly increasing time samples
when the ramp demand
decreases slowly after the
convergence of the transient oscillations and see how
they move. Before modification (Fig. 8), there are
two positive real part eigenvalues showing the
instability of the system. These two eigenvalues
remains in the left-half plane after the modification of
(Fig. 9). This fact confirms that the system has been
stabilized.
Figure 6: Simulation results for
before (blue) and after
(red) the modification of the spring’s stiffness. The black
line highlights the envelope of the blue curve.
Figure 7: Simulation results for before (blue) and after
(red) the modification of the spring’s stiffness.
(measurements for x and are not available). The black
lines highlight the envelope of the blue curve.
Another consequence of this manipulation can be
observed through the transient oscillations, which can
be seen on Fig. 2, 3, 5 and 6 at the end of the early
fall of pressures. Their envelope have been increased
with . This means that the mask pressure will
oscillate a bit more just after the opening of the
comparator even if the chattering is suppressed. This
may disturb the pilot at the beginning of an inhalation,
and a nonlinear analysis could be performed to see to
which parameters the amplitude of the opening
oscillations are the most sensitive and if the
modification of the former to attenuate the latter still
respect the stability conditions.
Figure 8: Eigenvalues of the system before modification.
The arrows show the sense of evolution with the ramp
demand.
-5 -4 -3 -2 -1 0 1 2
-6000
-4000
-2000
0
2000
4000
6000
Start of
chattering
0
Time
Time
Imaginary part
ICINCO 2018 - 15th International Conference on Informatics in Control, Automation and Robotics
322

Imaginary part
Real part
Figure 9: Eigenvalues of the system after modification. The
arrows show the direction of evolution with the ramp
demand.
5 MATHEMATICAL ANALYSIS
OF THE SIMULATION
RESULTS
It is possible to come back on some observations
made in the previous paragraph by looking at the
equilibrium equations (8)-(9)-(10). Parameter does
not appear in equations (8) and (9), that is the
equilibrium values for and
remain the same
whatever . This explains why pressures before and
after modification superpose each other on Fig. 6.
From (9),
increases while
decreases since its
derivative is strictly negative:
=−
+1<0
(33)
From (14), with an increase of , the value of
decreases. This is coherent with Fig. 5.
From numerical values, the determinant of the
characteristic equation corresponding to equation (2)
is
−4<0. Before and after the modification,
the mechanical part of the system presents more or
less damped poles. This partly explains the
oscillations of ,
and
(indeed, equation (2) is
not a simple second order linear differential equation
since it is perturbed by
through the nonlinear
dynamics of the whole system). The determinant
becomes even more negative by increasing , which
goes in the way of having more transient oscillations.
Note that the transient oscillations are a different from
the chattering effect. Since at the equilibrium,
has
been lowered after the modification, it takes more
time for
to reach this new value, which explains
the result of Fig. 5. The consequence in practice is a
bigger difficulty to breathe in the mask.
Besides the longer fall of
, we can note also a
longer fall of
, more difficult to analyse
mathematically due to the coupling of equations (4)
and (7). A nonlinear analysis would be necessary to
understand how the fall of
works.
All these elements show that after the
modification, the regulation will send oxygen later
(due to the longer decrease of
), the mask will be
more difficult to breathe in (decrease of
), with
more transient oscillations.
6 CONCLUSION
After proposing a mathematical model for a regulated
oxygen mask, we performed a linear stability analysis
around its equilibrium points. Thanks to the Routh
criterion we found conditions to prevent the regulated
oxygen mask from chattering by assuring its stability,
and deduced which parameters can be modified to
fulfil it. The easiest action is to increase the stiffness
of the comparator and we experimentally showed that
performing this action was sufficient to get rid of the
chattering effect. However, the counterpart of the
suppression of chattering is a bigger difficulty to
breathe in the mask and the increase of the envelope
of opening oscillations. Further studies of the
nonlinear dynamics of this system could help us
finding the sensitivity of the opening oscillations to
some parameters that could be compared with the
stability conditions of the Routh criterion. If these
conditions were contradictory, a compromise should
be found, based on the feeling of the breathing pilot.
REFERENCES
Bernardo, M., Budd, C., Champneys, A. R., & Kowalczyk,
P. (2008), Piecewise-smooth dynamical systems: theory
and applications, Vol. 163, Springer-Verlag, London.
Budd, C. J. (1996), “Non-smooth dynamical systems and
the grazing bifurcation”, Nonlinear mathematics and its
applications, Guildford 1995, Cambridge University
Press, Cambridge, 219-235.
Chin, W., Ott, E., Nusse, H. E., & Grebogi, C. (1994),
“Grazing bifurcations in impact oscillators”, Physical
Review E 50(6), 4427-4444.
Casas, F., Chin, W., Grebogi, C., & Ott, E. (1996),
“Universal grazing bifurcations in impact oscillators”,
Physical review E 53(1), pp. 134.
-3.5 -3 -2.5 -2 -1.5 -1 -0.5 0
-1.5
-1
-0.5
0
0.5
1
1.5
10
4
Stability Analysis of a Regulated Oxygen Mask
323

EASA (2012). “Certification Specifications for Large
Aeroplanes CS-25”, available at: https://www.easa.
europa.eu/system/files/dfu/CS-25_Amdt%203_19.09.0
7_Consolidated%20version.pdf
Hayashi, S., Hayase, T., & Kurahashi, T. (1997), “Chaos in
a hydraulic control valve”, Journal of fluids and
structures, 11(6), 693-716.
Hős C.J., Champneys A.R., et al (2017), “Dynamic
behaviour of direct spring loaded pressure relief valves
connected to inlet piping: IV review and
recommendations”, Journal of Loss Prevention in the
Process Industries, Volume 48, 2017, 270-288.
Licsko, G., Champneys, A., Hos, C. (2009), “Nonlinear
Analysis of a Single Stage Pressure Relief Valve”,
International journal of applied mathematics, 39(4),
12-26.
Maeda, T. (1970), “Studies on the dynamic characteristic of
a poppet valve: 1st report, theoretical analysis”, Bulletin
of JSME, 13(56), 281-289.
McCloy, D. and Martin, H.R. (1980), Control of fluid
power: analysis and design, Chichester, Sussex,
England, Ellis Horwood, Ltd. New York, Halsted Press.
MacLeod, G. (1985), “Safety valve dynamic instability: an
analysis of chatter”, J. Pressure Vessel Technol 107(2),
172-177.
Molenaar, J., de Weger, J. G., & van de Water, W. (2001),
“Mappings of grazing-impact oscillators”,
Nonlinearity, 14(2), 301.
NATO (1991). “Functional Requirements of aircraft
oxygen equipment and pressure suits STANAG 3198”,
available at: http://standards.globalspec.com/std/399
286/nato-stanag-3198.
ICINCO 2018 - 15th International Conference on Informatics in Control, Automation and Robotics
324
