
Rainfall Prediction Model based on Radar Image Analysis Processing
Oudomseila Phok, Jiwan Lee and Bonghee Hong
Department of Electrical and Computer Engineering, Pusan National University, Busan, Republic of Korea
Keywords: Radar Image, Correlation Analysis, Multiple Linear Regression, Predictive Model, Big Data.
Abstract: The radar image represents the intensity of the rainfall measured at the observatory by the image pixel color
value. It is the goal of this paper to find that the radar image values at a given point calculate the rainfall at a
given time. Correlation analysis between radar images and rainfall data provided by rainfall gauges installed
at very rare intervals is performed first. Based on this correlation analysis, we find out how to calculate the
rainfall in the area where AWS is not installed by radar image. The biggest challenge of this paper is to find
a predictive model of rainfall that takes into accounts the movement patterns of radar images affected by wind
direction, wind speed, temperature and humidity.
1 INTRODUCTION
Rainfall forecasts in the weather forecasts are not al-
ways accurate, so there is great dissatisfaction with
the citizens. Existing rainfall is predicted using radar
reflectivity data and terrestrial meteorological data
collected by weather radar observation network.
However, there is a problem that the accuracy of rain-
fall forecasts judged by rainfall radar images and
forecasters' experience based on surface AWS data is
low as can be seen in Table I.
Table 1: Sample rainfalls of Radar and AWS data.
Date Radar Rain Surface Rain
2017-09-11 6:00 3.85mm 1mm
2017-09-11 6:10 6.8mm 3mm
2017-09-11 6:20 6.53mm 4.5mm
2017-09-11 6:30 20.3mm 4.5mm
This paper aims to develop rainfall forecasting
model through correlation analysis between weather
radar value and ground rainfall observation value.
Simple linear regression analysis shows that it is dif-
ficult to analyze the correlation between radar reflec-
tivity data and surface rainfall.
To conduct the analysis using real data, we used
the weather radar observations in Busan city (KMA,
2017). Actual rainfall radar image value is csv file,
image value is color pixel and classified into 32 kinds
according to rainfall type. The color of the radar im-
age is mm of rainfall per hour and is updated every
10 minutes (KMA, 2017).
Figure 1: Radar Image for representing rainfall (KMA,
2017).
This paper deals with the problem of using rainfall
radar image pixel color values to calculate rainfall at
a given location and to develop a model to forecast
Phok, O., Lee, J. and Hong, B.
Rainfall Prediction Model based on Radar Image Analysis Processing.
DOI: 10.5220/0006809903150319
In Proceedings of the 3rd International Conference on Internet of Things, Big Data and Security (IoTBDS 2018), pages 315-319
ISBN: 978-989-758-296-7
Copyright
c
2019 by SCITEPRESS – Science and Technology Publications, Lda. All rights reserved
315
future rainfall along the direction of rainfall. To ana-
lyze the relationship between rainfall radar images
and rainfall at specific points, we develop rainfall cal-
culation model by correlation analysis with AWS (au-
tomatic weather observation equipment) (KMA,
2017) and future wind speed-based prediction model
considering various weather variables such as wind
direction, wind speed, temperature and humidity.
Section 2 shows the results of correlation analysis
between the rainfall radar image and the observed
rainfall on the ground. We also define the problem of
finding the best corresponding aerial position where
the rainfall difference between the location of the
ground observation point and the aerial position of the
rainfall radar image is minimized. In Section 3, we
show the difference between the rainfall calculated by
the rainfall radar image and the rainfall measured by
AWS (Automatic Weather System) on the ground.
Based on these experimental results, it is shown that
rainfall forecasting model based on radar image should
be made as non-deterministic function. Section 4 ex-
plains the related research cases and concludes with a
remaining breakthrough research topic in Section 5.
2 CORRELATION COEFFICIENT
ANALYSIS
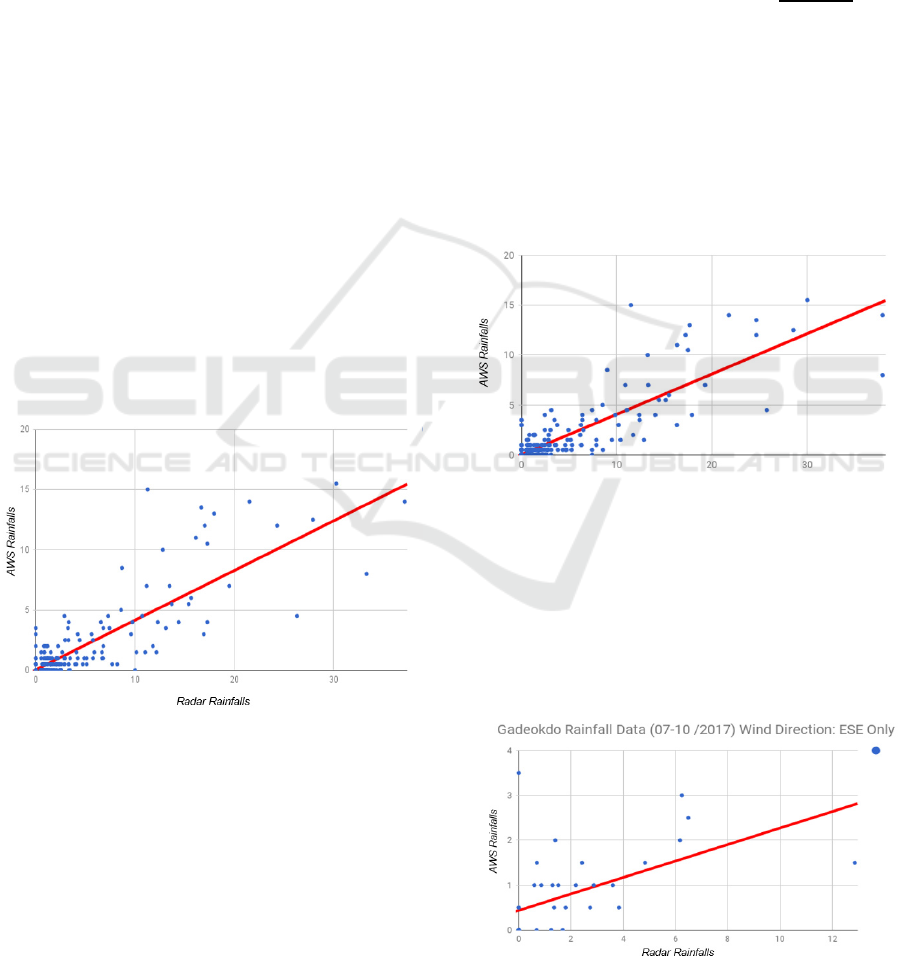
Figure 2: Correlation Analysis (Correlation Coefficient =
0.8501).
The correlation index between rainfall radar images
and AWS measured rainfall is not constant. The rain-
fall data of the rainy season of July, August, Septem-
ber and October of 2017 were analyzed and the cor-
relation index with the radar image was analyzed and
it was 0.8501 as shown in Figure. 2. The more rain-
fall, the lower the correlation. In order to generate bet-
ter model, we need to consider attributes that could
influence the amount of rain, which are, wind speed,
wind direction., temperature, and humidity.
2.1 Correlation with Wind Speed
We also analyzed the results of the analysis of wind
speed as a weighting factor in the correlation analysis
between rainfall radar image and AWS rainfall data.
As shown in Figure. 3, the correlation index increases
as the wind speed is included as a weight. The radar
rainfall considering the wind speed can be calculated
by following the Eq. (1).
_
=
+(
) (1)
k is a constant to determine how much the wind-
speed should affect the calculation and we used k=12
in this current research. d is determined whether the
rain is decreasing or increasing in the current time
frame. d = -1 in the case of rainfall is decreasing
where d = 1 in the case of rainfall is increasing. The
correlation coefficient between rainfall and rainfall
radar images affected by wind speed slightly in-
creased to 0.8574.
Figure 3: Correlation analysis considering wind speed (Cor-
relation Coefficient = 0.8574).
2.2 Correlation with Wind Direction
The correlation index between the rainfall radar image
considering the wind direction and rainfall was found
to be rather low. Figure 4 shows that correlation coef-
ficient is 0.5321 as a result of correlation index analysis
considering east-southeast (ESE) wind direction.
Figure 4: Correlation analysis using ESE wind direction
(Correlation Coefficient = 0.5321).
IoTBDS 2018 - 3rd International Conference on Internet of Things, Big Data and Security
316
2.3 Correlation with Temperature
We also conducted the research using temperature as
a weighting factor in the correlation analysis between
rainfall radar image and AWS rainfall data. As shown
in Figure. 5, the correlation index increases as the
temperature is included into the calculation. The radar
rainfall considering the temperature can be calculated
by following the Eq. (2).
_
=
−
(2)
k is a constant to determine how much the tem-
perature should affect the calculation. In this experi-
ment we used k = 100. The correlation coefficient be-
tween AWS rainfall and radar image rainfall affected
by temperature has been increased to 0.8754.
Figure 5: Correlation analysis considering temperature
(Correlation Coefficient = 0.8754).
2.4 Correlation with Humidity
In addition to windspeed, wind direction and temper-
ature, we also analyzed the correlation index between
the rainfall radar and AWS rainfall using ASOS hu-
midity data as weight. As shown in Figure. 6, the cor-
relation index increases as the humidity is included
into the calculation. The radar rainfall considering the
humidity can be calculated by following the Eq. (3).
_
=
−
ℎ
(3)
k is a constant to determine how much the tem-
perature should affect the calculation. In this experi-
ment we used k = 100. The correlation coefficient be-
tween AWS rainfall and radar image rainfall affected
by temperature has been increased to 0.8799.
Figure 6: Correlation analysis considering temperature
(Correlation Coefficient = 0.8799).
2.5 MLR Predictive Model
Finally, we used Multiple Linear Regression analyze
to generate a more efficient prediction model, consid-
ering all major factors such as windspeed, tempera-
ture and humidity. This model achieved Correlation
Coefficient result of 0.88. The equation of this model
is detailed in Eq. (4) and Table II.
Y = -2.683 + 0.372X
1
- 0.002X
2
+ 0.03X
3
+ 0.025X
4
(4)
Table 2: Description of MLR Model variables.
Variable Description
Y Predicted Surface Rain (mm/10min)
X
1
Radar Rain (mm/10min)
X
2
Windspeed (m/s)
X
3
Temperature (°C)
X
4
Humidity (%)
A method for finding the correspondence between
the location of the rainfall radar image and the loca-
tion of the rainfall observation point has been re-
quired. Correlation analysis confirmed that the rain-
fall is not the same even if the latitude and longitude
coordinates of the radar image are the same for the
ground rainfall observation point. Through these ex-
periments, we propose a very breakthrough method to
devise a method to locate the radar image nearest to
the rainfall of the latitude and longitude coordinates.
Let P (x, y) be the position of the longitude and
latitude of the observation point of the rainfall on the
surface. Let the observed rainfall measured at the lo-
cation P (x, y) where the rainfall system is installed is
Rainfall Prediction Model based on Radar Image Analysis Processing
317

RF (x, y). Let AP (a, b) be the aerial position of the
radar image. Let the rainfall radar value observed at
AP (a, b) be PR (a, b). It is necessary to obtain the
latitude and longitude coordinates (a, b) of the radar
image in which the difference between RF (x, y) and
PR (a, b) becomes minimum for a given P (x, y). This
analysis is based on the given longitudinal coordi-
nates (x, y). The aerial position (a, b) of the radar im-
age at which the value of min (RF (x, y) - PR (a, b))
would be minimum is obtained and then a new learn-
ing model is newly created for different weather con-
ditions of wind direction, wind speed and temperature
and humidity.
It is necessary to find out the same zone of the
similar rainfall forecasts. In other words, it must be
resolved to find and determine the boundary point
where the minimum of the difference between RF (x,
y) and PR (a, b) is maintained spatially and tempo-
rally. It is a break-through research theme to further
discover that these boundary points are formed differ-
ently depending on the weather changes and the topo-
graphic form.
3 EXPERIMENTS
3.1 Experimental Environment
As we have mentioned in the previous section, in this
experiment, we used the input data used the weather
data in Busan region such as rainfall, windspeed, hu-
midity, wind direction and temperature daily during
July, August, September and October of 2017. To
compare and generate the result of the MLR model,
we pick all of the rainy days from each of those
month. All these data were calculated using method
shown in Section 2.
3.2 Experimental Results
As a result of both regression analysis and correlation
analysis, correlation index between rainfall radar im-
age and AWS image is 0.8 or more. However, it can
be seen that the correlation index changes as the rain-
fall layer image value moves away from the observa-
tion point. When the wind speed, humidity, and tem-
perature are included as a weight, the correlation in-
dex increases but the wind direction does not affect
the correlation coefficient. The most important prob-
lem is to make an optimal algorithm of best matching
a given ground AWS location with the corresponding
aerial rainfall radar image.
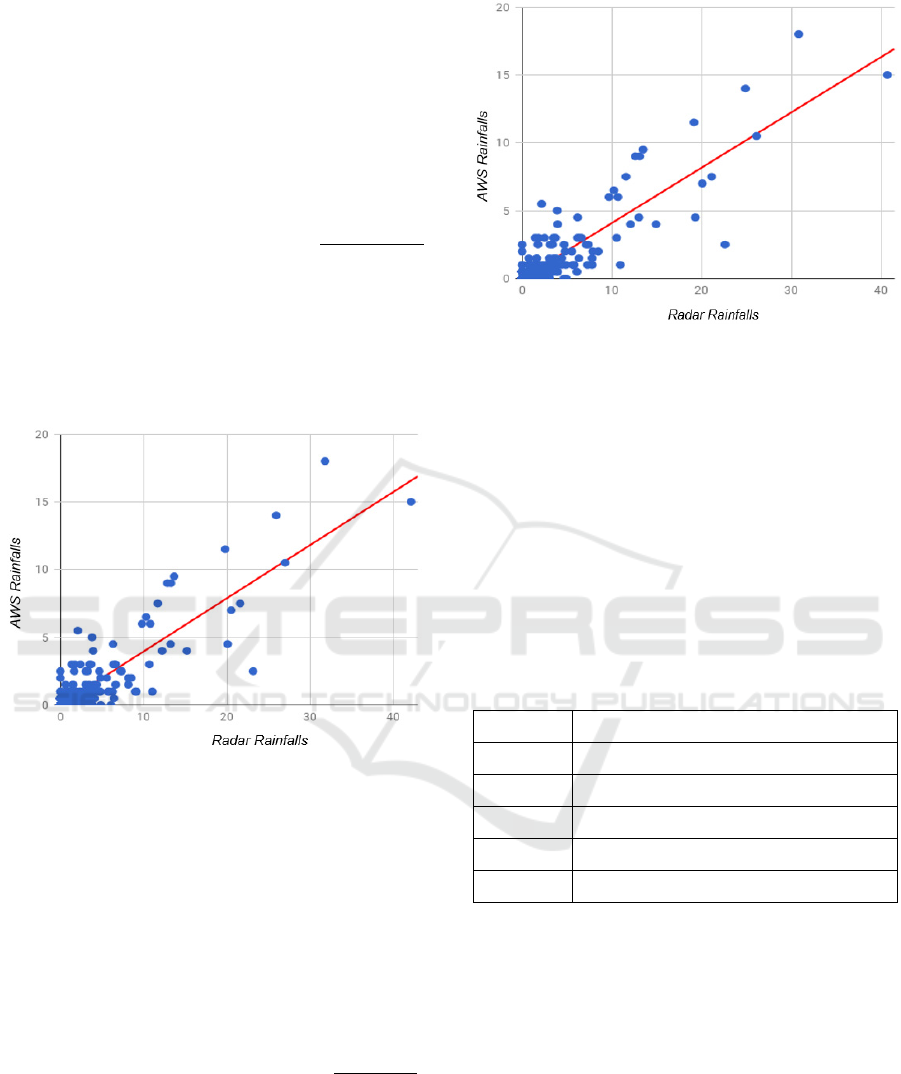
Figure 7: Multiple Linear Regression Model Result.
Figure. 7, compare the rainfall estimates using the
correlation-based MLR model with the actual rainfall
using the rainfall radar image value as the x value of
the function. Rainfall radar images are physically and
logically different from aerial rainfall locations as
aerial observations. It is important to develop a rain-
fall prediction model that can accurately calculate the
rainfall at a certain point because the rainfall radar
image is synthesized from radar images produced
from several radar observation devices. The rainfall
prediction model should be a non-deterministic func-
tion that finds the aerial location (a, b) of the radar
image with minimum difference between RF (x, y)
and PR (a, b). Rainfall forecasting model based on
rainfall radar image should be solved by development
of data analysis model considering surrounding ter-
rain in addition to wind velocity, wind direction, and
temperature and humidity. By having this experi-
mental result, we will be able to use it and focus on
increase the accuracy of our predictive model through
further research on analyzing the solution to fix the
radar and AWS location problem.
4 RELATED WORKS
In previous works, some researchers have tried to use
other method to estimate rainfalls. One of the method
is using data mining and deep learning method to pre-
dict the rainfall. The researcher of this method had
tried to combine radar data and AWS data with wind
speed and wind direction during the CNN training
process. However, a beneficial model was not found,
and the research end up using only AWS data. The
model was able to forecast rain in the next hour with
over 90% accuracy but does not provide the amount
of rainfalls data (Suryong, 2017). Another method is
through using road CCTV camera which achieved
over 87% of accuracy. However, the method requires
IoTBDS 2018 - 3rd International Conference on Internet of Things, Big Data and Security
318

CCTV camera in the observation location and the ra-
dar weather data was not utilized to improve the ac-
curacy rate in the estimation process (Lee, 2016).
5 CONCLUSIONS
The purpose of this paper is to solve the method of
forecasting the amount of rainfall on the ground using
radar images. However, it is difficult to find a effec-
tive rainfall forecast model only by analyzing radar
images and existing rainfall data. Finding a big data
analysis model as a method of forecasting the accu-
rate rainfall is a breaking-through theme because the
location of airborne radar image values does not co-
incide with the rainfall point on the ground and rain-
fall drop points depend on the wind direction and
wind speed.
ACKNOWLEDGEMENTS
This work was funded by the Korea Meteorological
Administration Research and Development Program
under Grant KMIPA2017-5030.
REFERENCES
Korea Meteorological Administration: July, August,
September, October 2017 Radar Image, Radar Footage
Open Portal, url: https://data.kma.go.kr.
Korea Meteorological Administration: July, August,
September, October 2017 AWS Data, AWS Observation,
url: http://www.weather.go.kr/weather/observation/
aws_table_popup.jsp.
Kwon Suryong, Jwae Oujong, Han Yelim. 2017. Rainfall
forecasting using data mining and deep learning, Grad-
uation Final Report of Pusan National University.
Jiwan Lee, Yongdeok Shin, Bonghee Hong., Jan. 2016.
Extraction of weather information on road using CCTV
video, IEEE 2016 International Conference on Big
Data and Smart Computing.
Rainfall Prediction Model based on Radar Image Analysis Processing
319
