
Energy Building Stock Simulation and Planning for Small
Municipalities
A Web-based Urban Energy System Model for Potential Analysis and Citizen
Participation
Simon Schneider, Thomas Zelger and Pierre Laurent
Department Renewable Energy, Fachhochschule Technikum Wien, Höchstädtplatz 6, 1200 Vienna, Austria
Keywords: City Energy Simulation, Building Stock, Archetypes, Future Energy Scenarios, Citizen Participation.
Abstract: City planning for sustainable energy and development goals in small municipalities suffers from unresolved
complexities, insufficient data and prohibitive cost. We propose a low-cost urban energy system for building
stock assessment and urban energy planning by combining archetype-based dynamic energy demand and
coverage simulation with incentive-based citizen participation as a means to improve data quality. Combining
a white-box based physical approach with multi-dimensional archetypes for individual building energy
demand and supply estimation with statistical top-down validation and calibration, we obtain an energy
simulation method that requires less data on the building stock than other typical methods.
1 INTRODUCTION
Changing energy use is a physical necessity. The
Paris Climate 2015 established moderate goals for
this transition until 2050. In spite of efforts around the
globe, progress is dramatically slower than necessary
and time is running out.
In small cities, resources, expertise and data may
not be as abundantly available as in large “Smart
Cities”. Consequently, city planners struggle to
implement effective measures to pursue their
sustainability goals. This paper aims to highlight a
feasible approach of energy simulation through
archetype classification on the example of the city of
Korneuburg, Austria. The city of around 13 thousand
inhabitants aims to achieve their self-proclaimed goal
of energy self-sufficiency by the year 2036
(Stadtgemeinde Korneuburg, 2014).
The first step to this end is to establish certainty
of the current energy usage: Once known, cities can
develop roadmaps from the current to the desired
situation. This encompasses all emission-related
aspects of energy usage such as mobility, buildings
and industry.
City planners need a framework to predict energy
demands and coverages for entire cities and compare
possible effects of future measures (Sousa et al.
2012). Examples of such projects are abundant (see
Tardioli et al., 2015, Caputo et al., 2012), and yet it
remains difficult to generalize the approaches to small
cities. A number of factors limit the usage of such
tools: First, the required data for the framework may
not be readily available and its aggregation cost-
prohibitive or hindered by privacy concerns (Ballarini
et al., 2011 and Ballarini et al., 2014). Second, the
expertise required to operate such tools may not be
available within smaller administrative bodies.
Finally, the resources required to sustain complex
energy estimation and planning systems may not be
available.
Typical approaches and solutions fall in one of
three categories: (i) High-accuracy physical energy
estimation tools that incorporate all energy aspects of
a city. They tend to be expensive, as they require
detailed and extensive physical data and expertise
(engineering method), (ii) well established tools for
narrow areas of city planning such as heating demand
estimation, grid planning, etc. Their ability to
visualize energy system states and changes are
therefore limited. And (iii): Holistic city planning
solutions –typically trading detail for accessibility.
344
Schneider, S., Zelger, T. and Laurent, P.
Energy Building Stock Simulation and Planning for Small Municipalities.
DOI: 10.5220/0006804403440351
In Proceedings of the 7th International Conference on Smart Cities and Green ICT Systems (SMARTGREENS 2018), pages 344-351
ISBN: 978-989-758-292-9
Copyright
c
2019 by SCITEPRESS – Science and Technology Publications, Lda. All rights reserved

Existing research on quantifying a city’s building
stock energy system focuses heavily on demand
estimation, specifically heating energy demand. A
holistic city simulation must also include methods of
quantifying how these energy demands are met, and
their corresponding greenhouse gas emissions.
Finally, existing building stock should be compared
to varying future scenarios. The energy framework
for small municipalities is required to answer: What
energy usage and associated emissions are attached to
the current building stock? Which saving potentials
are available and where? What could happen if we
assume certain transition rates (which can represent
political measures)? The energy framework is also
required to provide a number of technical and
practical features and constraints to be feasible in a
non-scientific context: Data management: Possibility
to integrate different data types, and versioning of this
data, user-friendly interfaces: Comfortable, intuitive
and robust design
The importance of the last two points cannot be
understated. It must be ensured that data aggregation
can continue on the running system and can be done
in an economically feasible way.
2 METHODOLOGY
Three key components form the proposed energy
framework are: (i) An energy database, (ii) an energy
building simulation engine and (iii) a web-based
front-end user interface, later referred to as the “web-
platform”. The focus of the following section is to
describe the energy simulation method. Thereafter, a
brief overview on the data model and web platform is
given.
2.1 Energy Simulation
According to (Swan and Ugursal., 2009) and
(Tardioli et al., 2015), large scale building stock
energy simulation can be classified into three
categories: White-box based approaches employ
physical energy models on a city scale, typically
extrapolating from single buildings through
distribution, archetype or sample methods.
Black-Box based approaches use statistical
methods such as regression, decision trees and
artificial neural networks to estimate energy
consumption based on existing data (Tardioli et al.,
2015). Although physical models have their merit in
obtaining detailed results for specific buildings, the
amount of parameters and computation time required
usually prohibits their use for city scale application
(Kavgic et al., 2010, Keirstead et al., 2012, Pervez et
al.,2014). A purely black-box based approach (as
employed Humeau et al., 2013 and Powell et al.,
2014) extrapolating from existing data is not
sufficient, as there is no data on future, more efficient
buildings to extrapolate from. Finally, grey-box based
approaches can be seen as a combination of both
white- box and block-box based techniques.
Figure 1: The components of the implemented energy web-
platform and their interaction.
For single building simulation, and more so for
estimation of future building and plot potentials, a
physical approach is necessary. It is however virtually
impossible to collect sufficient data on each building
to apply physical methods individually (Ballarini et
al., 2011 and Ballarini et al., 2014). Instead, the first
important modelling decision is to appropriate each
building from the building stock with a virtual
building type, typically referred to as an archetype
(Swan and Ugursal, 2009), designed to reflect
determining features such as
Surface-to-Volume ratio (compactness)
The share of solar transmitting surfaces on the
building envelope and their orientation
The thermal transmission properties (of building
materials)
Usage of the building (for residential, commercial
and other purposes)
Energy system (including all energy uses such as
heating, cooling, (de-)humidification, end-use,
etc.)
The relative influence of these parameters have
been extensively investigated and discussed: (Schüler
et al., 2015) found through statistical regression
analysis on 57.000 buildings in Geneva that
microclimate, which they describe through the
parameters of average building height, horizontal
density and average irradiation, play an important
role. (Aksoezen et al., 2014) argued that the most
influential building parameters on energy demand are
Energy Building Stock Simulation and Planning for Small Municipalities
345
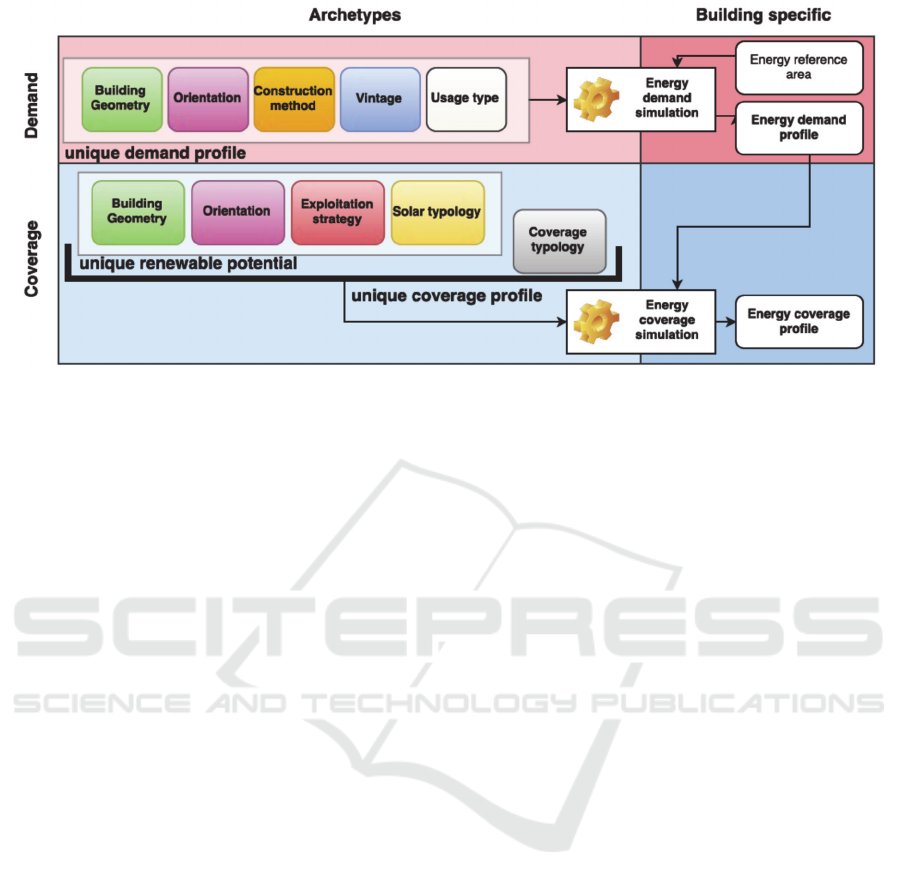
Figure 2: Energy simulation data model divided in demand archetype classification (light red) and building energy demand
calculations (dark red), as well as coverage archetype combination from parameters on the renewable energy potential of the
building and common coverage typology through conventional energy systems (grey box).
compactness and building age. In any case,
archetypes allow direct control over the trade-of
between modelling effort and model accuracy
(Korolija et al., 2013).
The energy simulation method proposed in this
work is combining data from the geoinformation
system of the municipality of Korneuburg, statistical
data on city quarters and archetypes to quantify the
energy use intensity of the building stock (compare
Caputo et al., 2012 for a detailed description of this
approach).
The archetypes developed in this study divide
between demand archetypes and coverage or supply
archetypes. The demand archetypes are
characterized by the combinations of (i) typical
building geometries, (ii) typical physical properties of
the thermal hull, (iii) typical usage profiles, (iv)
construction method and (v) orientation of the
building (as can be seen in Figure 2). Typical physical
properties are assumed according to vintage of the
building as surveyed in (Zelger and Waltjen, 2009)
and reflect typical building materials from a certain
time. The parameters of building construction method
and usage type follow the same categorization in this
source.
Similarly to (Kazas et al., 2015), the orientation
parameter was quantified into eight equally sized
segments, as can be seen in Figure 3. Since
orientation could only be derived from GIS building
footprints, it was defined by the direction of the
largest building façade. As there is no possibility to
distinguish between a building and its rotation by
180° from a rectangular building footprint alone, the
two cardinal directions opposite each other cannot be
distinguished with this method and subsequently,
orientation of archetypes can only be equally
distributed between the two. For the most part, this is
of no concern, as archetypes are mostly, but not
generally, mirror symmetrical and thus invariant to
180° rotation. However, for highly unsymmetrical
building geometries this approach is not directly
applicable.
One of the key predictors of a building stock’s
energy demand is building age: As pointed out by
(Aksoezen et al., 2014), the dependency of heating
energy demand on building age is non-linear.
However, a statistical approach with archetypes
allows for estimations with low margins of error.
In the case of Korneuburg, data on building age
was available as a statistical distribution for around
hundred districts (“sub-zones”) with five to fifty
individual buildings each from (Galosi et al., 2012).
Since the data model needs to depict not only
present but also future conditions, the coverage
simulation is required to factor in energy demand,
coverage systems, as well as renewable energy
potentials on site. To this end, we employed coverage
archetypes, that are similar yet more numerous than
the energy demand archetypes described above, and
combined from two parts: The first part is a
parametric typology of “common” coverage systems
such as gas or oil powered heating systems. They are
“common” in the sense that they typically cover the
energy demand of the building stock, but this is
purely semantical. The methodological distinction to
the other parametric types is that opposed to the latter,
the “common“ coverage systems do not have any
constraints in their application
SMARTGREENS 2018 - 7th International Conference on Smart Cities and Green ICT Systems
346
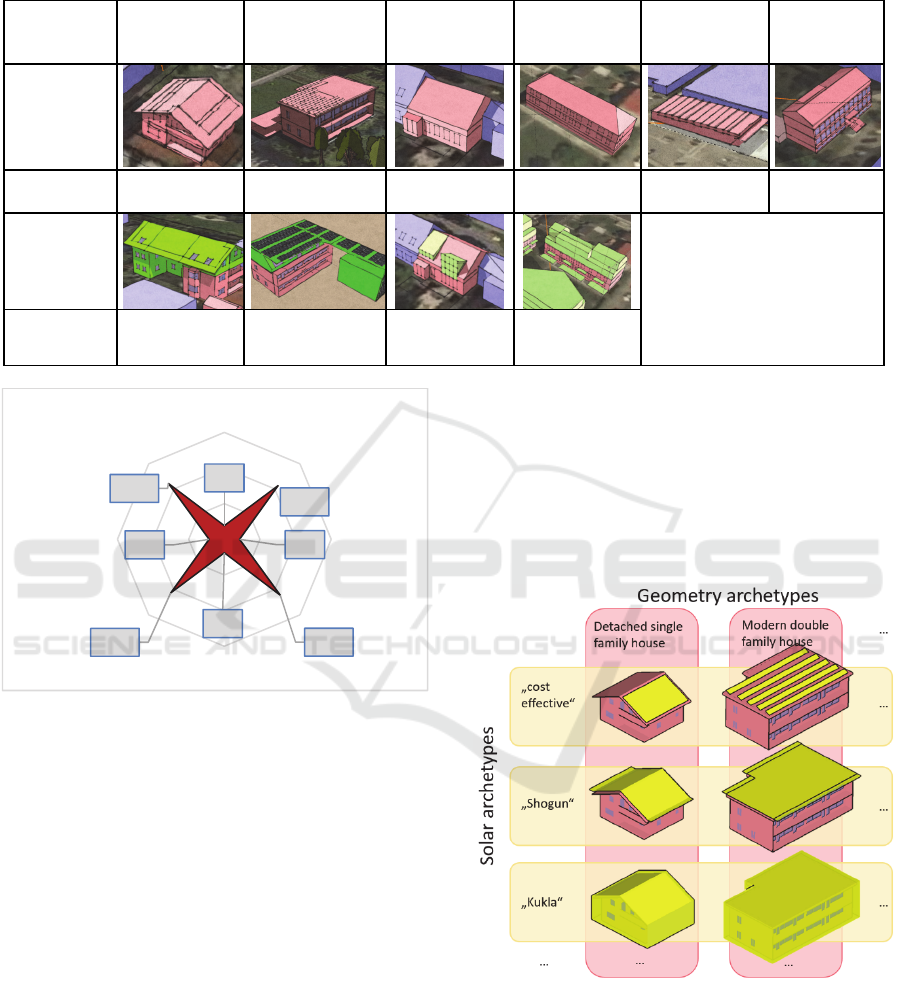
Table 1: Geometric types constituting the building stock of the city of Korneuburg, as well as possible densification variants.
Geometry
Detached
single family
house
Modern double
family house
Attached
Single family
house
Multifamily
house
Retail Office
Building
stock
Gross floor
areas [m²]
209 418 108 760 750 510
Densifi-
cation
variants
Retail and Office Densification
geometry types currently in
development
Gross floor
areas [m²]
500 662 162 1064
Figure 3: Distribution of building orientations in
Korneuburg. Most parts of the city align with the river Danu
be (flowing from North West to South East).
Not so for the group forming the “unique renewable
potential” (Figure 2). These parameters determine to
extent to which renewable energy potential can be
used for any given building. The “solar” parameter
describes different rulesets that determine which
areas of a building geometry type can be used for
solar energy. These rules are not specific to certain
building geometries. However, since surface
suitability for solar usage depends heavily on building
geometry, specific solar type rulesets with certain
geometries in mind can yield better results than
generic rules. Figure 4 shows how three different
solar ruleset types are applied to two different
geometries.
Since the orientation of the building archetype’s
geometries is unknown and statistically distributed, it
is necessary to distinguish between areas of technical
solar potential (the last step of solar ruleset types) and
the actual feasibility of these potential areas due to
irradiation depending on orientation. All roof and
façade potential areas are divided in primary areas
(with the highest irradiation of the roof or façade
areas respectively) and secondary areas (the rest). In
a last step, the actual feasibility is determined by
combining the possible orientations with a certain
Figure 4: Exemplary application of three solar typologies
onto different building geometries: The "cost effective"
typology classifies 90% of the south-most facing, sloped
roof surface, and/or 40% of horizontal roof areas at optimal
orientation (tilt and azimuth) as solar potential. “Shogun”
classifies all roof areas (automatically adding 1m wide
canopies), and the hypothetical “kukla” typology assumes
all building surfaces as solar potential (resulting solar
potential areas in yellow).
190
1066
214
1110
190
1066
214
1110
North
NortEast
East
SouthEast
SouthEast
SouthWest
West
NorthWest
Energy Building Stock Simulation and Planning for Small Municipalities
347

“exploitation strategy”, which determines the share of
primary and secondary roof and façade surfaces
actually used, as well as which technology, thermal,
photovoltaic or hybrid is being applied to each. Figure
5 shows primary and secondary areas for different
orientations.
Figure 5: Primary (green) and secondary (purple) solar roof
potential areas for different orientations according to an
exploitation strategy.
The resulting simulation method for individual
buildings provides dynamic calculation methods for
thermic building simulation in a single thermal zone
and yields energy usage, energy supply, humidity and
temperatures in a quarter-hour resolution, as well as
primary energy balances and greenhouse gas
emissions. It was developed upon (Rondoni, et.al.
2015), which was validated using a TRNSYS
reference model.
For the purposes of city-scale scenarios, the
calculation is separated in two steps: First, the
detailed energy demand of all predefined archetypes
is calculated. Then, results are aggregated according
to the spatiotemporal distribution of these archetypes
throughout the city and the years of the scenario to
obtain a city estimate. The building stock is derived
from the archetypes to match its actual energy
reference area. Area-specific values are assumed to
equal those of their corresponding archetype. The
results can be compared to top-down energy use data
from the local energy supplier to calibrate the
archetypes and their distribution throughout the city.
The last important feature of the energy
simulation method is future energy scenarios. This is
accomplished through virtual “measures”, which is a
transition rule with the following parameters: (i) a
building parameter such as geometry or energy
system to transition, (ii) a filter that determines which
archetypes should be affected, (iii) a target value for
the parameter, and (iv) a transitioning rate per year
and (v) a timespan in between years.
2.2 Database and Web-platform
As (Swan and Ugursal, 2009) and (Kavgic et al.,
2010) have pointed out, it is generally difficult to
obtain reliable information from end-users and
residents due to privacy and collection issues and
cost. As (Aksoezen et al., 2014) put it: “There is a
missing link in practically all models between the
estimated energy consumption and the real energy
consumption”.
The approach of this study is to make the results
of the simulation available to the end-users and
residents themselves on a dedicated web-platform.
Here, the citizens are incentivised to voluntarily
partake in the data collection in two ways:
First, the web platform offers detailed simulation
of individual buildings, also in virtual refurbishment
variations as a service to residents. They can use this
service to explore the opportunities for their own
home. Since it is in their self-interest to obtain as
reliable results as possible, they are incentivised to
produce as detailed information about their building
as possible.
The second incentive is through collaborating on
a common goal. As projects such as Wikipedia have
impressively shown, members of a community have
an innate desire to contribute in a meaningful way
towards a common goal. In the case of the web
platform of the particular city of Korneuburg, the goal
is to achieve municipal energy self-sufficiency by
2036 (Stadtgemeinde Korneuburg, 2014). It is
important to point out, that this goal was not imposed
by the city administration or other government, but
rather was the result of an inclusive development
project by citizens, politicians and other stakeholders
to shape the roadmap into the city’s future.
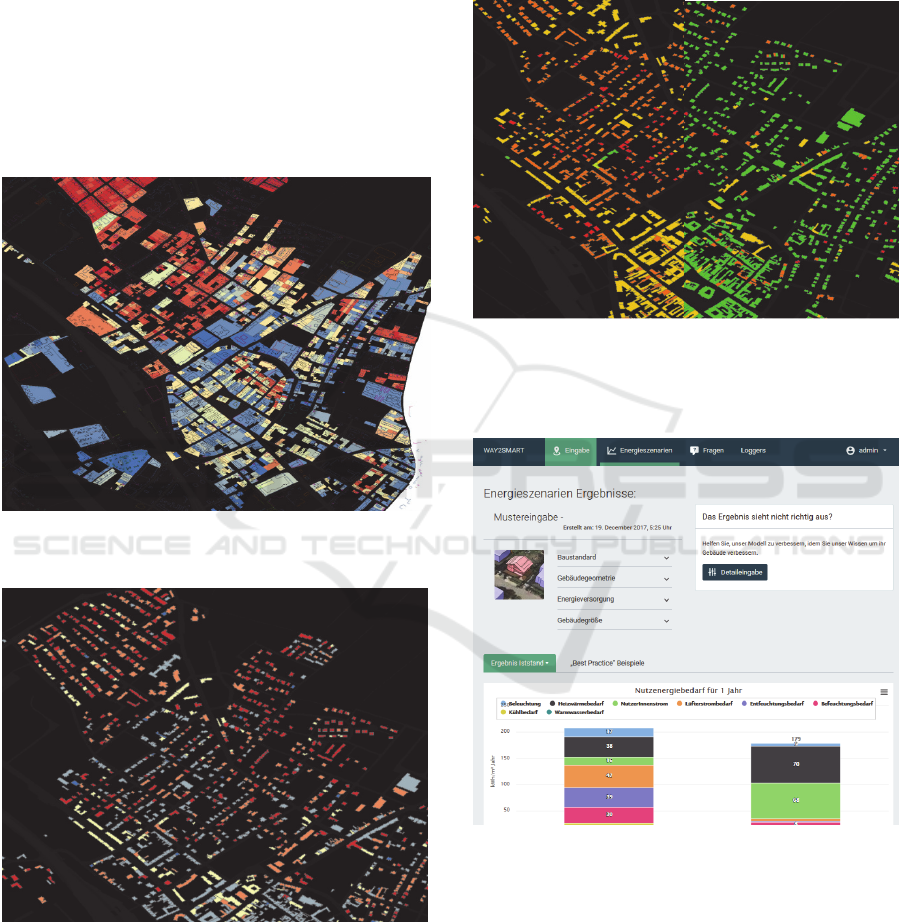
3 RESULTS
With this city energy model it is possible to quantify
and visualize the building stock’s energy demand
(Figure 8), energy use intensity and greenhouse gas
emissions (Figure 7). Furthermore, future scenarios
can be evaluated by adjusting the existing archetypes
and transitioning them with archetypes that reflect
future, more energy-efficient buildings. Different
densification strategies can also be examined (Figure
6), as well as the quantitative effect of retrofitting
measures. For the goal of energy-autonomy, as in the
case of Korneuburg, it is possible to investigate
different mixes of archetypes, whether they are
sufficient to meet the goals and how possible
SMARTGREENS 2018 - 7th International Conference on Smart Cities and Green ICT Systems
348
transitioning roads require different rates of
retrofitting and other energy policy measures.
Citizens are incentivised to visit the energy web
platform, as they can investigate their city for
themselves and discover the (im)possibilities of
certain futures. By providing examples of best-
practice buildings, the web platform aims to connect
the overarching goals of a city to the individual action
space of their residents. If they decide to, they can
even provide detailed data on their own building, such
as energy audits, archetypical information and energy
bills – thus improving the database, which is
primarily based on statistical assumptions (Figure 9).
Figure 6: Densification potential of plots within existing
density regulations from high (red) to low (blue).
Figure 7: Greenhouse gas emissions per building and year
from blue (< 40 kg CO
2
equiv./m²a) to red (> 180 kg
CO
2
equiv./m²a).
Since resource efficiency is a major concern, the
data model is able to combine different datasets.
Apart from user input, it is also possible to
incorporate measurement and sensory data, which can
be used to validate the underlying modelling
assumptions. A role-management system enables
control over rights and privileges of all participants.
Municipal energy planners can then use the platform
to maintain their building energy data.
Figure 8: Heating energy demand from green (< 15
kWh/m²a) to red (> 150 kWh/m²a) for the existing building
stock (left) and a future city scenario with 80% of the
building stock retrofitted to passivhouse standard (right).
Figure 9: Web-platform user interface for detailed building
simulation and result presentation.
4 DISCUSSION
With this approach we aim to combine the strengths
of top-down statistical methods (i.e. bridging the gap
between simulation and reality and giving insight in
user behaviour), and engineering methods, which are
the only ones capable to evaluate the impact of new
Energy Building Stock Simulation and Planning for Small Municipalities
349

building solutions (Swan and Ugursal, 2009). The
number of archetypes derived in this study from
building parameters is around 58 excluding and 180
including the orientation parameter. For comparison,
(Mata et al., 2014) compiled 593 archetypes including
residential and non-residential buildings in France,
Germany, Spain and the UK.
The current implementation of the simulation
method focuses on the individual building. In reality,
a plot can and often does house multiple buildings.
Their energy demand can still be calculated
separately, however their potential for renewable
demand coverage and densification through
refurbishments are interconnected. The potential of
ground heat pumps for example depends on the area
of unsealed land, which remains when subtracting the
building’s footprints from the plot area.
Another example is densification: Construction
laws impose thresholds on building density for plots
of land. However, the plot specific densification
potential cannot be algorithmically allocated to each
building. This suggests plots instead of buildings to
constitute the central aggregation point for data. This
will require the development of plot archetypes,
which in turn can be comprised of various building
archetypes.
One notable example of an energy web-platform
is the “energy app” developed by the city of Glasgow
(Glasgow City Council, 2015). Although the method
of building stock estimation is different, it
incorporates similar features for citizens to explore
and interact with – especially the interactive 3D
online map.
3D based methods, most notably CityGML, have
demonstrated great potential for integrating GIS and
other georeferenced data (e.g. LIDAR) with energy
metadata for energy simulation purposes, as
(Agugiaro, 2014) demonstrated for the city of Trento.
(Monsalvente et al., 2015) developed a „modular
physical [building simulation] model in INSEL“,
which can be generated automatically and connects
directly to the CityGML open source standard.
However, its physical model can only be employed
for buildings with a level of detail (LOD) of at least
two, which includes roof shapes. Since roof geometry
is not commonly obtainable data in small
municipalities, the proposed approach in this paper
focuses on building footprints, which correspond to a
building LOD of zero, in combination with a small
number of geometric archetypes.
However, obtaining a sufficient number of
archetypes can be challenging for larger cities, or
cities with a very diverse and heterogeneous building
stock. However different, the approaches are not
mutually exclusive, as the building input data for
energy demand are very similar (compare Wate and
Coors, 2015). The authors aim to develop our
simulation method to be compatible with the
CityGML standard, and it’s energy application
domain extension (ADE).
5 CONCLUSIONS AND
OUTLOOK
Combining a white-box based physical approach with
multi-dimensional archetypes for individual building
energy demand and supply estimation with statistical
top-down calibration capabilities, we obtain an
energy simulation method that requires less data on
the building stock than other typical methods.
Nevertheless, further refinement on archetypes and
distributions will be necessary.
Once the platform opens up to a wide base of
users from the municipality, it will be interesting to
study the actual engagement of the users, as well as
the quality and quantity of their supplied data.
As with most projects on building stock, data
collection and processing is time-consuming and
error-prone. We fully agree with the suggestion of
(Keirstead et al., 2012) for “a centralized repository
for cities’ energy related data”. We believe that open
source standards such as CityGML are necessary and
need to be developed and put to use faster in order to
meet our goals in the future. To this end, we aim to
develop our simulation method to be compatible with
the CityGML standard, and it’s energy application
domain extension (ADE).
ACKNOWLEDGEMENTS
The authors gratefully acknowledge the Austrian
Climate and Energy Fund for providing funding for
the research project “Way2Smart Korneuburg”.
REFERENCES
Stadtgemeinde Korneuburg, 2014. Leben im
Zusammenfluss, Leitbild der Stadt Korneuburg,
Korneuburg, 2014.
Sousa, L., Eykamp, C., Leopold, U., Baume, O., Braun, C.,
iGUESS – A web based system integrating Urban
SMARTGREENS 2018 - 7th International Conference on Smart Cities and Green ICT Systems
350

Energy Planning and Assessment Modelling for multi-
scale spatial decision making. In proceedings. 6th
International Congress on Environmental Modelling
and Software - Leipzig, Germany. July 2012.
Tardioli, G., Kerrigan, R., Oates, M., O`Donnell, J., Finn,
D. 2015. Data driven approaches for prediction of
building energy consumption at urban levels. In Energy
Procedia. 6
th
International Building Physics
Conference, IBPC 2015.
Caputo, P., Costa, G., Ferrari, S., 2012. A supporting
method for defining energy strategies in the building
sector at urban scale. In Energy Policy’55 (2013) p.
261-270.
Ballarini, I., Corgnati, SP., Corrado, V., Talà, N., 2011.
Improving energy modeling of large building stock
through the development of archetype buildings. In
Proceedings of Building Simulation 2011. 12th
Conference of International Building Performance
Simulation Association, Sydney, 14-16 November
2011. p. 2874-81.
Ballarini, I., Corgnati, SP., Corrado, V., 2014. Use of
reference buildings to assess the energy saving
potentials of the residential building stock: The
experience of TABULA project. Energy Policy.
2014;68(0):273-84.
Swan, L., Ugursal, I., 2008. Modeling of end-use energy
consumption in the residential sector: A review of
modelling techniques. Renewable and Sustainable
Energy Reviews, 2009:13(0):1819-1835.
Kavgic, M., Mavrogianni, A., Mumovic, D., Summerfield,
A., Stevanovic, Z., Djurovic-Petrovic, M., 2010. A
review of bottom-up building stock models for energy
consumption in the residential sector, Building and
Environment’45(7):1683-1697, 2010.
Keirstead, J., Jennings, M., Sivakumar, A., 2012. A review
of urban energy system models: Approaches,
challenges and opportunities. Renew Sustain Energy
Rev’16(6):3847-66, 2012.
Pervez H. S., Nursyarizal B. N., Perumal N., Irraivan E.,
Taib I., 2014. A review on optimized control systems
for building energy and comfort management of smart
sustainable buildings, Renewable and Sustainable
Energy Reviews, Volume 34, June 2014, Pages 409-
429.
Humeau, S., Wijaya, TK., Vasirani, M., Aberer, K., 2013.
Electricity load forecasting for residential customers:
Exploiting aggregation and correlation between
households. In Conference proceedings. Sustainable
Internet and ICT for Sustainability. 2013.
Powell, K. M., Sriprasad, A., Cole, W. J., Edgar, T. F.,
2014. Heating, cooling, and electrical load forecasting
for a large-scale district energy system. Energy.
2014:74(0):877-85.
Schüler, N., Mastrucci, A., Bertrand, A., Page, J., Maréchal,
F., 2015. Heat demand estimation for different building
types at regional scale considering building parameters
and urban topography. In Energy Procedia. 6
th
International Building Physics Conference, IBPC 2015.
Aksoezen, M., Daniel, M., Hassler, U., Kohler, N. Building
age as an indicator for energy consumption. Energy and
Buildings. 2015:87(0):74-86.
Korolija I, Marjanovic-Halburd L, Zhang Y, Hanby VI. UK
office buildings archetypal model as methodological
approach in development of regression models for
predicting building energy consumption from heating
and cooling demands. Energ Buildings.
2013;60(0):152-62.
Zelger, T., Waltjen, T., 2009. PH-Sanierungs-
bauteilkatalog: Auswertung gebäudesanierungs-
bezogener HdZ-Forschungsberichte mit konstruktiven,
bauphysikalischen und bauökologischen Ergänzungen.
Bmvit . Wien. 37/2009.
Kazas, G., Fabrizio, E., Perino, M., 2015. Energy demand
profiles assessment at district scale: A stochastic
approach for a block of buildings demand profiles
generation. In Energy Procedia. 6
th
International
Building Physics Conference, IBPC 2015.
Galosi A., Klepic V., Köbl K., Rößler M., Ziegler M.,
Zelger T., 2012. Energieautarke Gemeinde Korneuburg
2036, Technikum Wien, Wien.
Rondoni, M., Santa, U., Klammsteiner, U., Demattio, M.,
Bancher, M., Told, A., Zelger, T. 2015. ProCasaClima
2013: CasaClima building simulation software,
Building Simulation Applications 2015 - 2nd IBPSA-
Italy Conference, Bolzano, Italy.
Mata, É., Kalagasidis, A., Johnsson, F., 2014. Building-
stock aggregation through archetype buildings: France,
Germany, Spain and the UK. In Building and
Environment’81 (2014) p.270-282.
Glasgow City Council, 2015. Buiding a Future City –
Evaluation Report. Glasgow. (Accessed online
29.12.2017: http://futurecity.glasgow.gov.uk/reports/ ).
GlasgowEnergyApp (Accessed online 29.12.2017
https://www.glasgowenergyapp.org/metrics/index.htm
l).
Agugiaro, G. 2014: From sub-optimal datasets to a citygml-
compliant 3D city model: Experiences from Trento,
Italy. ISPRS Technical Commision IV Symposium,
2014, Suzhou, China.
Monsalvente, P., Robinson, D., Eicker, U., 2015. Dynamic
simulation methodologies for urban energy demand. In
Energy Procedia. 6
th
International Building Physics
Conference, IBPC 2015.
Wate, P., Coors, V., 2015. 3D Data Models for Urban
Energy Simulation. In Energy Procedia. 6
th
International Building Physics Conference, IBPC 2015.
Open Geospatial Consortium. OGC City Geography
Markup Language (CityGML) En-coding Standard,
2012. (Accessed online 29.12.2017:
http://www.opengeospatial.org/standards/citygml).
Energy Building Stock Simulation and Planning for Small Municipalities
351
