
Development of a Comprehensive Walking Path System
in Hong Kong
Lilian S. C. Pun-Cheung
Department of Land Surveying and Geo-Informatics, The Hong Kong Polytechnic University,
Hunghom, Kowloon, Hong Kong Special Administrative Region, Hong Kong
Keywords: Walkability, GIS, Pedestrian, Network Analysis.
Abstract: Walkability has been defined as the extent to which the urban environment is pedestrian friendly. This
article presents a case in Hong Kong of how to develop a walking path system to enable users to choose a
pedestrian-friendly route. It is found that different details of land configuration can result in varying paths.
Such differences can be significant in contributing not only to an accurate system, but also in convincing
and stimulating people to walk more according to their own preference.
1 INTRODUCTION
Walking is a significant transportation mode, and all
human beings are pedestrians for varying time
periods on roads (Gota et al., 2010). People have to
walk for some distances, even when they use
motorized transport. Previous studies have shown
that public transit users, on average, make at least
four walking trips per day (Centre for Science and
Environment, 2009).
In recent years, there has been increasing
emphasis on environmental and policy initiatives in
public health to promote walking activity. Walking
is both a means and an indicator to combat global
epidemics of non-communicable chronic diseases
(NCDs) and overweight (Sallis et al., 2012).
Walking can also be considered the basis of the
sustainable city, providing social, environmental and
economic benefits (Forsyth and Southworth, 2008;
Moura et al., 2017).
Walkability has been defined as the extent to
which the urban environment is pedestrian friendly.
The idea of walkability is that people should become
more active in walking in open urban environments
(Moura et al., 2017). Pedestrian safety, comfort, and
convenience are three elements taken into
consideration for walkability assessment (Loo and
Lam, 2012). A typical walkability assessment tool is
essential, which allows different variables and their
relative weights to vary in order to yield meaningful
analysis. Recent literature has demonstrated a range
of scoring or checklist methodologies to assess the
walkability, which enable city planners to audit
communities and routes and identify the isolated
neighbourhoods to improve walkability (Su et al.,
2017).
Geographic information system (GIS) is a
collection of spatial data plus the corresponding
functions for storage and retrieval, using algorithmic
and functional tools to model spatial relationships
and spatial reconnaissance (Bartelme, 2012). GIS
can be used to assess pedestrian environment that
may have impacts on walkability. Nowadays, people
are used to search for effective walking routes
through Internet and user-friendly Web-based GIS
applications such as Google Maps, Baidu Maps, and
Microsoft Bing Maps. However, computing and
suggesting a pedestrian-friendly walking route is a
challenge due to the complexity and diversity of
walking path attributes. Although analysis of route
paths has been widely used in GIS applications, the
integration of various factors (i.e. pedestrian flow,
green area, width, brightness, covered area,
airconditioner, air pollution) with the analysis of
route path is still lacking in the GIS arena (Lwin and
Murayama, 2013).
This article presents the development of a
walking path system using Central District in Hong
Kong as a case study to enable users to choose a
pedestrian-friendly route.
Pun-Cheng, L.
Development of a Comprehensive Walking Path System in Hong Kong.
DOI: 10.5220/0006785505010506
In Proceedings of the 4th International Conference on Vehicle Technology and Intelligent Transport Systems (VEHITS 2018), pages 501-506
ISBN: 978-989-758-293-6
Copyright
c
2019 by SCITEPRESS – Science and Technology Publications, Lda. All rights reserved
501

2 STUDY AREA AND
METHODOLOGY
Hong Kong is one of the most densely populated
city in the world with compact and layered urban
structure, mixed land use, and heavy reliance on
public transport (Ng et al., 2016). Researches
indicated that Hong Kong is a highly walkable city
(Kriken et al., 2010; Gota et al., 2010). Through
pedestrian-based connections and efficient
transportation network, facilities are within easy
reach (Lau et al., 2005). Besides, Hong Kong is a
three-dimension city, with streets and walkways at
multiple levels, above and below ground level, as
shown in Figure 1 (Frampton et al., 2012). However,
Hong Kong pedestrians tend to be unfamiliar with
neighbourhood’s pedestrian environment, and less
likely to try different routes, which may be due to
the lack of route choice or attracted built
environment (Guo and Loo, 2013).
Figure 1: Hong Kong is a three-dimension city (Frampton
et al., 2012).
Both government and non-government
organizations (NGOs) have taken efforts on
improvements of pedestrian environment and
walking efficiency, to make the city smarter and
more liveable. For example, the Government has
fostered the concept of “Walk in HK” under a
coordinated strategy, including four themes, namely
“Make it smart”, “Make it connected”, “Make it
enjoyable” and “Make it safe”, aiming to develop
Hong Kong into a walkable city. An app to plan and
search for the best walking routes in Causeway Bay
as a pilot has also been developed to echo with the
Chief Executive's 2017 Policy Address. A local
think tank named Civic Exchange developed a
walkability measurement tool CEx WALKScore
with assessment checklists, and four neighbourhoods
(Central, Mong Kok, Kwun Tang, Choi Hung) were
selected to conduct walk audits (Ng et al., 2016). A
similar study had been conducted by Ng et al. in
2012, in which four local districts (Central, Tsim
Sha Tsui, Mong Kok, Ma On Shan) were chosen as
examples to create a system on how to assess each
route. Another NGO named Walk DVRC Ltd.,
promotes an urban planning model that gives
pedestrians and trams priority over other vehicular
traffic, for a more walkable and liveable Central
Business District (CBD) that begins with the
revitalisation of a decaying Des Voeux Road
Central.
The aim of this study is to provide a
comprehensive review and scientific analysis of
walkability in Hong Kong. To assess walkability,
GIS will be used to geovisualize varying urban
environmental attributes. Spatial network analysis is
performed to model and simulate the characteristics
of each link associated with diverse attributes.
Most street network data are readily available
from existing official sources from the Transport
Department (TD), MTR station maps, HK
Tramways Interactive Map, GeoInfo Map from the
Lands Department as well as Google Maps.
However, many of these do not cover minor narrow
streets, indoor and underground paths. These are
then supplemented by field survey. Each path
segment as denoted from junction to junction is
demarcated as belonging to one of the following
types – along vehicular roads, crosswalk, footbridge,
subway, escalator, staircase and lift. Path attributes
like pedestrian flow, traffic flow, degree of
greenness, width, brightness, covered, air-
conditioning and so on are defined. Table 1 shows
the data and sources, description of data, and
purpose to use in the project.
To create a walking path network database,
edges (line features) and nodes (point features) are
defined. Edges are basic elements in network to
represent each walking path segment. Nodes are the
intersections at points of edges. All elements are
properly connected in topological structure. The
permitted directions of route are determined by
assigning values to restrictions. Impedance is
defined to measure resistance of finding walking
paths. This parameter can be user-defined such as
time, distance, and greenness. Link impedance is the
amount of resistance that one has to overcome to
travel origin-destination (OD) pairs, while node
impedance is the resistance for travelling through an
intersection, such as traffic light.
VEHITS 2018 - 4th International Conference on Vehicle Technology and Intelligent Transport Systems
502
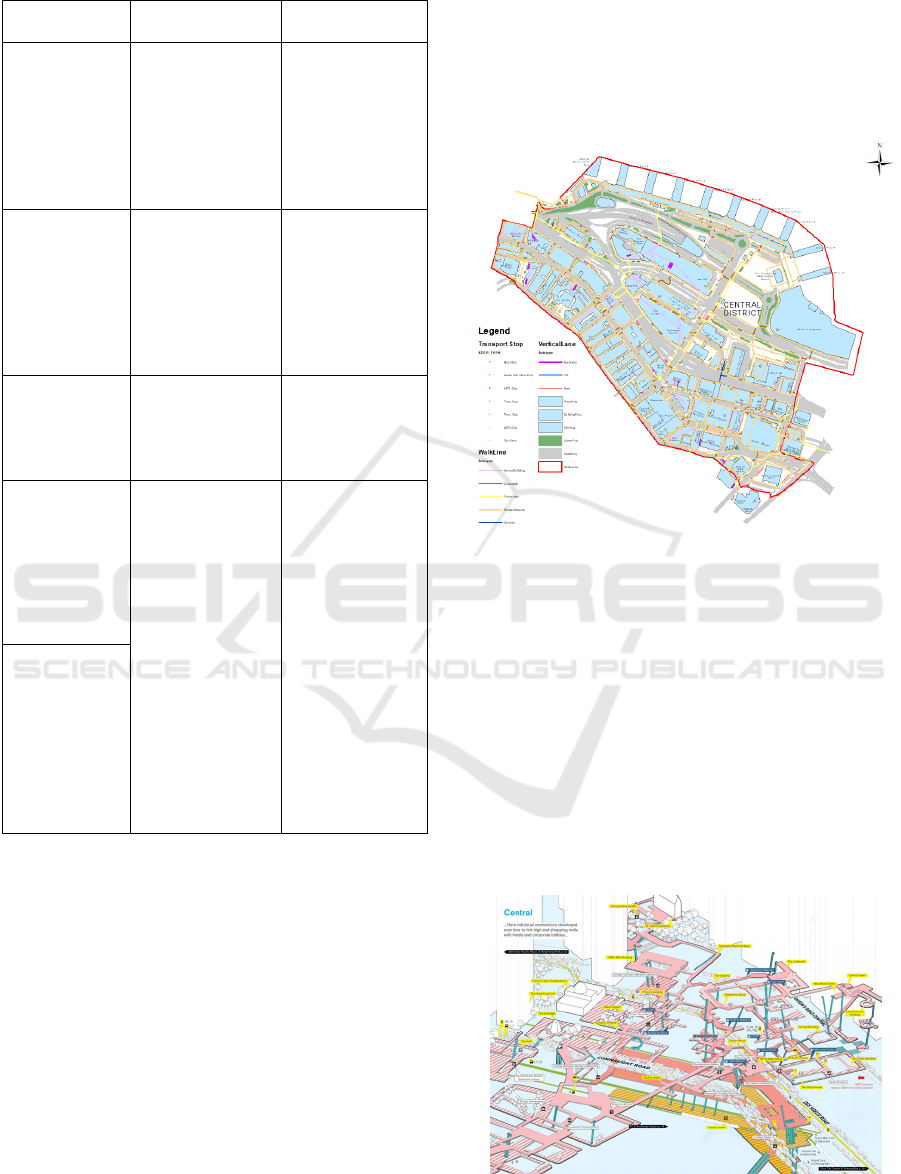
Table 1: Data, descriptions, and applications of their use.
Data and
Source
Description Purpose
Administrative
Boundary (TD,
HKSAR)
(i) administrative
boundary
including name,
coordinate, feature
type; (ii) polygon
in an ESRI
shapefile
(i) to create a
database of
building address;
(ii) to find
desirable and
available place;
(iii) to perform an
address search
Transport Stop
(TD, HKSAR)
(i) transport name,
type, coordinate;
(ii) point in an
ESRI shapefile
(i) to create a
database of
transport stops;
(ii) to perform an
analysis of
walking distance
from transport
stop to destination
Road Dataset
(TD, HKSAR)
(i) road name,
type, coordinate,
data level; (ii)
polygon in an
ESRI shapefile
(i) to build a road
network model;
(ii) to calculate
walkability score
by building zone
Walking Line
(Field Audit)
(i) Walking path
name, type,
coordinate, data
level, attributes
including
pedestrian flow,
traffic flow, green
area, width,
brightness,
covered area, air-
conditioner, travel
time; (ii) polyline
in an ESRI
shapefile
(i) to build a
walking path
network; (ii) to
measure network
distances between
a user-defined
point and
locations of
destinations; (iii)
to analyse
walkability for
each path
segment; (iv) to
perform an
analysis of route
based on
pedestrian choice
Vertical Lane
(Field Audit)
3 CASE STUDY
A detailed analysis of the pedestrian environment
can help improve and increase the walkability of a
city. Central District is a representative and good
example as it encompasses varying environments
and is a busy working district where environments
need to be improved to stimulate people walking for
a longer distance and time. To be specific, the study
area of about 0.8 km² is sandwiched between
Queen's Road Central and Central Ferry Piers.
Streets include major arterials (e.g. Queen’s Road
Central, Des Voeux Road Central), and quiet alleys
(e.g. Man Yee Lane, Theatre Lane). It is considered
as a walkable district, with very good connectivity
and accessibility. In total, 729 walking path
segments and 79 links to different vertical levels
have been digitized. It is also well served by public
transportation, with a total number of 128 stops of
different modes including MTR exits, tram, bus,
ferry and taxi (Figure 2).
Figure 2: Network Lines in Central by ArcGIS.
The database has following advantages: (i) more
paths (i.e. footbridge, escalator, across commercial
buildings) are named; (ii) more routes (i.e. across
parks/blocks) are established; (iii) detailed attributes
(i.e. path name).
This area is predominantly commercial with
predominantly high rise office buildings, shopping
centres, public buildings, hotels, stores, bars, parks.
People may go from one place to another without
ever having to leave a continuous network of
elevated or underground pedestrian passageways and
interconnected malls and office lobbies as shown in
Figure 3 (Frampton et al., 2012).
Figure 3: Three Dimensional Drawings of the Elevated
Walkways in Central Area (Frampton et al., 2012).
Development of a Comprehensive Walking Path System in Hong Kong
503
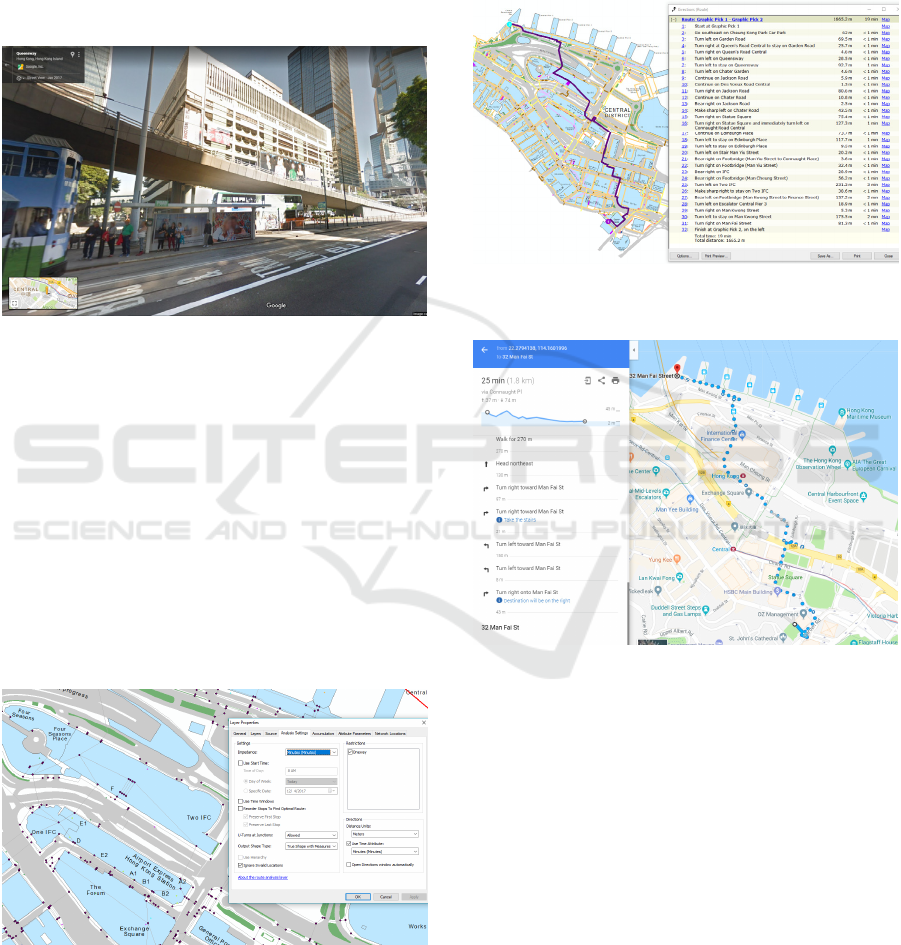
Multiple walking routes are possible between
each pair of origin and destination. However, not all
pedestrian paths are well connected or designed,
such as dead-end streets, narrow paths along driving
road. Figure 4 shows a walking path along
Queensway for the tram stop ‘Johnston Road (Luard
Road)’, which was captured from Google Map. The
path is narrow with no fence between walking path
and driving road.
Figure 4: Walking Path along Queensway for Tram Stop
‘Johnston Road (Luard Road)’.
4 PRELIMINARY RESULT
In this research, ‘Network Analyst’ function in
ArcGIS is performed to select the best route. Take
quickest route for example, ‘Time Cost’ is used as
restriction attribute that functions as an impedance
over the network (Figure 5). Given information
about travel time for each walking path segment,
spatial network analysis determines the quickest
route between each OD pair based on optimization
algorithm.
Figure 5: ‘Time Cost’ is used as restriction attribute that
functions as impedances over the network.
Random OD pairs have been selected to generate
quickest route in our system, and results are
compared with Google Map. Figure 6 and Figure 7
shows a route from ‘Cheung Kong Park’ to ‘Central
Government Pier’, using our system and Google
Map respectively. It is clear that our database has
resulted in a more detailed and accurate route due to
more paths (i.e. footbridge, escalator, across
commercial buildings) and associated attributes.
Figure 6: Route from ‘Cheung Kong Park’ to ‘Central
Government Pier’ in our system.
Figure 7: Route from ‘Cheung Kong Park’ to ‘Central
Government Pier’ in Google Map.
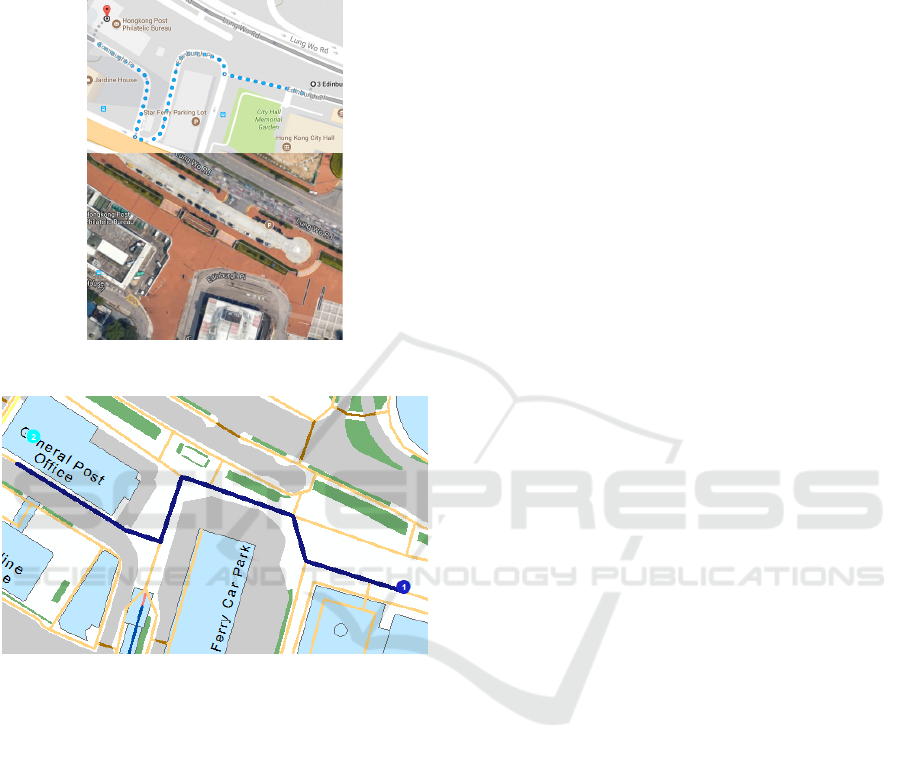
In another example, Google Map roughly models
walking paths surrounding ‘Edinburgh Place’
(Figure 8), while our route is more detailed (Figure
9). Those detailed routes point out the merits and
demerits of pedestrian environment, which allow us
to identify district-specific and common walkability
issues, raise public awareness, seek for solutions
with a view to improving walkability in Hong Kong.
These routes have also been verified by commuters
in the region as to the path segments they actually
walk on. To promote walking, a system enabling
multiple criteria route finding is crucial to let users
understand where and how they should walk
according to their own preference. One may choose
a fastest while others may choose a safer or more
VEHITS 2018 - 4th International Conference on Vehicle Technology and Intelligent Transport Systems
504
leisurely or less polluted route. To examine the
degree to which each path segment can contribute to
the selected criterion, a walkability score could be
calculated as a weighted factor for each path
segment.
Figure 8: Route along ‘Edinburgh Place’ in Google Map.
Figure 9: Route along ‘Edinburgh Place’ in our system.
5 CONCLUSION
To develop a genuine multiple criteria navigation
system for walking, a detailed investigation and
quantification of varying environmental variables is
deemed necessary. With this, we believe people are
more stimulated to consider walking as a habit in
their everyday activities, and for tourists who would
like to explore the city better.
Apart from an accurate and updated spatial
database of paths and attributes, an agreement of
ranking / weighting varying environmental factors is
also important. Many concepts such as safe, leisure,
healthy are rather subjective and further studies on
human reception and behaviour are needed to
develop a system of generally agreeable standards.
ACKNOWLEDGEMENTS
The work described in this paper was supported
substantially by a grant from the Research Grant
Council of the Hong Kong SAR Government
(Project No. B-Q43R) and Internal Research Grants
of the Hong Kong Polytechnic University (Project
No. G-YN99 and 1-ZE24).
REFERENCES
Bartelme, N., 2012. Geographic information systems. In
Springer Handbook of Geographic Information
(pp.145-174). Berlin, New York: Springer.
Centre for Science and Environment, 2009. Footfalls:
Obstacle course to livable cities. Retrieved November
03, 2017, from http://www.indiaenvironmentportal.
org.in/content/footfalls-obstacle-course-livable-cities
Forsyth, A., Southworth, M., 2008. Cities afoot --
pedestrians, walkability and urban design. Journal of
Urban Design, 13(1), 1-3.
Frampton, A., Solomon, J., Wong, C., 2012. Cities without
ground: a Hong Kong guidebook. San Francisco:
ORO Editions.
Gota, S., Fabian, H., Mejia, A., Punte, S., 2010.
Walkability Surveys in Asian Cities. Retrieved
November 03, 2017, fromhttp://cleanairasia.org/
walkability-study-in-asian-cities-4/
Guo, Z., Loo, B., 2013. Pedestrian environment and route
choice: evidence from New York City and Hong
Kong. Journal of Transport Geography, 28, 124-136.
Jiang, Y., 2011. Application of GIS network analysis in
water pollution control of Huaihe River Basin. 2011
19th International Conference on Geoinformatics, 1-4.
Kriken, J., Enquist, P., Rapaport, R., 2010. City Building:
Nine Planning Principles for the Twenty-First
Century. New York: Princeton Architectural Press.
Lau, S., Wang, J., Giridharan, R., 2005. “Smart and
sustainable city -- a case study from Hong Kong”. In
Yang, J., Brandon, P., Sidwell, A. (Eds.), Smart and
Sustainable Built Environments (pp.33-42). Oxford:
Blackwell Scientific.
Loo, B., Lam, W., 2012. Geographic accessibility around
elderly health care facilities in Hong Kong: a micro-
scale walkability assessment. Environment and
Planning B: Planning and Design, 39(4), 629-646.
Lupien, A., Moreland, W., Dangermond, J., 1987.
Network analysis in geographic information systems.
Photogrammetric Engineering and Remote Sensing,
53(10), 1417-1421.
Lwin, K., Murayama, Y., 2013. Smart eco-path finder for
mobile GIS users. (Report) URISA Journal, 25(2), 5-9.
Moura, F., Cambra, P., Gonalves, A., 2017. Measuring
walkability for distinct pedestrian groups with a
participatory assessment method: a case study in
Lisbon. Landscape and Urban Planning, 157, 282-
296.
Development of a Comprehensive Walking Path System in Hong Kong
505

Ng, S., Lai, C., Liao, P., Lao, M., Lau, W., Govada, S.,
Spruijt, W., 2016. Measuring and improving
walkability in Hong Kong: Introduction of CEx
WALKScore -- an assessment tool. Hong Kong: Civil
Exchange, UDP International.
Ng, S., Lau, W., Brown, F., Tam, E., Lao, M., Booth, V.,
2012. Walkable City, Living Streets. Hong Kong: Civil
Exchange.
Sallis, J., Floyd, M., Rodríguez, D., Saelens, B., 2012.
Role of built environments in physical activity,
obesity, and cardiovascular disease. Circulation,
125(5), 729-737.
Su, S., Pi, J., Xie, H., Cai, Z., Weng, M., 2017.
Community deprivation, walkability, and public
health: Highlighting the social inequalities in land use
planning for health promotion. Land Use Policy, 67,
315-326.
VEHITS 2018 - 4th International Conference on Vehicle Technology and Intelligent Transport Systems
506
