
Prediction of Learning Success Via Rate of Events
in Social Networks for Education
M. E. Sousa-Vieira, J. C. L
´
opez-Ardao, M. Fern
´
andez-Veiga, O. Ferreira-Pires
and M. Rodr
´
ıguez-P
´
erez
Department of Telematics Engineering, University of Vigo, Spain
Keywords:
Online Social Networks, Collaborative Learning, Learning Analytics, Success/Failure Prediction.
Abstract:
The widespread use of computing and communications technologies has enabled the popularity of social net-
works oriented to learn. Earlier studies have shown the power of online learning systems data to develop
prediction methods that try to identify successful students patterns of accomplishment and engagement to
allow timely pedagogical interventions. Our learning platform, SocialWire, collects a detailed record of the
students’ activity so, in this paper, we compare and combine the power of different statistical learning techni-
ques, using some of the features recorded as predictors of learning success or failure.
1 INTRODUCTION
Information technology is changing the ways we le-
arn. The widespread use of computing and commu-
nications technologies has enabled the formation of
personal communications or online social networks
(OSNs), and it is behind the popularity of social net-
works oriented to learn (Vassileva, 2008; Hart, 2011).
Effective methodologies for social learning rely
on two essential components: (i) a properly designed
software platform which integrates contents, users
and educational experiences in a productive social le-
arning environment (SLE); (ii) an understanding of
how the social learning activities have to be desig-
ned so as to improve the experience and quality of
the learning outcomes of students. For the first part,
since popular management systems (LMSs) do not of-
fer full functionality for embedding online social net-
work (OSN) features adequate to our purposes, re-
cently we have developed our own learning platform,
SocialWire (Sousa et al., 2016). For the second re-
quirement, it is necessary to apply learning analytics
(usually based on social networks analysis or machine
learning methods) in order to understand the effects of
the methodology on students’ performance.
In this work, we address these two issues. We des-
cribe SocialWire (SocialWire), a SLE which has been
purposely designed to provide a complete social le-
arning paradigm, including features not available in
other learning environments. Beyond the typical fea-
tures of a LMS related to online formal learning, So-
cialwire allows the creation, assessment and reporting
of a range of collaborative activities based on social
interactions among the students, offering reward me-
chanisms by means of ranking and reputation. Mo-
reover, custom-made plugins collect detailed records
of the students’ and teachers’ activity while they are
engaged in the system.
These data can be used to analyze the individual
behavior of users for identifying the behavior pat-
terns that lead to success in learning (Lykourentzou
et al., 2009; Macfadyen and Dawson, 2010; Brinton
and Chiang, 2015) or to quantify how the informa-
tion flow shapes the learning results, discovering the
most influential students or finding out how collabora-
tion among groups of students arise and the impact of
the relationships on learning performance (Laat et al.,
2007; Cadima et al., 2012; Hommes et al., 2012;
Chung and Paredes, 2015; Skrypnyk et al., 2015; Eid
and Al-Jabri, 2016; Sousa et al., 2017b; Sousa et al.,
2017a). Taking into account these findings, learning
failure prediction methods can be implemented to al-
low timely pedagogical interventions.
In this paper we report our experience using So-
cialWire during two consecutive years of a compu-
ter networking course directed to undergraduates of
the second year of the Telecommunications Engi-
neering degree. We describe the methodology em-
ployed along the course and we propose a lear-
ning success/failure prediction method that combines
the power of different statistical learning techniques
using some of the features of the student’s activity al-
374
Sousa-Vieira, M., López-Ardao, J., Fernández-Veiga, M., Ferreira-Pires, O. and Rodríguez-Pérez, M.
Prediction of Learning Success Via Rate of Events in Social Networks for Education.
DOI: 10.5220/0006780703740382
In Proceedings of the 10th International Conference on Computer Supported Education (CSEDU 2018), pages 374-382
ISBN: 978-989-758-291-2
Copyright
c
2019 by SCITEPRESS – Science and Technology Publications, Lda. All rights reserved

ong the course as predictors.
The rest of the paper is organized as follows. In
Section 2 we give an overview of the core social
engine, and describe the general principles of our
learning-enhanced social platform. The methodology
employed in a real testbed (two consecutive editions
of an undergraduate course on Computer Networks)
is reported in Section 3. Section 4 contains the main
results of the data mining applied to our datasets. The
proposed success/failure prediction methods are ex-
plained in Section 5. Finally, concluding remarks and
guidelines for further work are included in Section 6.
2 THE LEARNING PLATFORM
Socialwire (Sousa et al., 2016) is a SLE purposely
designed to provide a complete networked learning
paradigm, including features not available in other
SLEs. For instance, Socialwire uses games and so-
cial meritocracy as conducting threads. The software
platform is based on ELGG (Elgg), a popular engine
for developing OSNs, and allows the creation, asses-
sment and reporting of a range of collaborative activi-
ties based on social interactions among the students,
offering a reward mechanism by means of ranking
and reputation.
The platform was developed upon four blocks:
• The online social network. SocialWire leverages
on the core of ELGG for reusing the fundamental
elements of a generic OSN. Every group (class-
room group) defined in the system has its own
wall to maintain open communication among all
its members. The group can also use common
tools in the social web for its virtual classroom
activities: classroom blog, collaborative publis-
hing and document editing, creation of web pages,
social tagging, files repositories with hierarchi-
cal structure (including a viewer for images, au-
dio, video and the usual document formats), and
event calendars. All the activity unfolded in the
classroom gets eventually reflected on the public
wall, so it can be commented, highlighted or vo-
ted. Sharing videos, uploading a file, save and
send a link are extremely simple actions which the
user can invoke through an user interface delibe-
rately similar to an OSN user interface. The user-
friendliness is higher, as a bonus, and the learning
curve of the platform itself is greatly softened.
• The formal learning processes. To furnish Social-
Wire with the usual features of a LMS, we have
developed custom software modules that extend
the bare OSN based on ELGG. Specifically, there
exist modules for proposing and submitting tasks
(either online or offline), for the creation and as-
sessment of quizzes and questionnaires, for the
creation and processing of forms or polls, for buil-
ding an e-portfolio, for designing rubrics for eva-
luation, and more. Another software module gives
the teachers the possibility of structuring the lear-
ning units in their courses, for instance weekly,
monthly, by topic,... and adding to each unit as
many resources as they like.
• The informal learning processes. SocialWire
opens the possibility of carrying out other sort of
activities requiring a higher degree of social in-
teraction. This is done by means of the questions
and answers module and the contests module. Be-
sides the usual grading procedure used in formal
courses (on a numeric scale or by discrete levels),
in SocialWire the students can receive “points” or
“marks” for their works. The points accumula-
ted along the course determine their position in
the students’ ranking. This ranking serves pri-
marily to send behavioral signals to the students
about their relative performance, in a way that di-
rectly stimulates comparisons and that automati-
cally conveys the meaning of social reputation.
• The collaborative work processes. Most of the
popular software platforms for collaborative work
fail to give real, effective support for working col-
laboratively. First, the users are not given a vir-
tual workspace where direct communication and
sharing between colleagues can happen, so they
must resort to external programs to solve this (or
in extreme cases, physical meetings). Secondly,
teachers are not provided with the opportunity
to manage, coordinate, assess, evaluate, share or
communicate with the workgroups. SocialWire
does permit subgroups, i.e., smaller groups within
an existing group. The instructors are in charge of
deciding how many groups will be created, their
sizes and their membership policies, if any is due.
Every activity supported by SocialWire can be as-
signed to a group or to an individual, and in the
former case any group member is entitled to parti-
cipate in the role of group’s representative. Addi-
tionally, every subgroup is internally a group and
has a private space so that their members and the
instructors can communicate.
For the goals of this paper, two of the plugins
of SocialWire are of key importance. These are the
event collector plugin, and the event viewer plugin.
The first is a plugin that runs in the background
and records all the relevant activity of the students
(and teachers too), both the interactions between an
user and the learning objects stored in the platform
Prediction of Learning Success Via Rate of Events in Social Networks for Education
375

and the interactions between two users. Every pos-
sible action by an user of SocialWire is logged as
an event in a format compliant to the TinCan stan-
dard, so that a full Learning Record Store (LRS) of
the user’s activities can be easily reconstructed. This
entails a structure of the form Subject+Verb+Object
for every event, where the user is the subject and the
possible verbs (actions) are login, follow, create,
update, remove, response , comment, uncomment,
like, unlike, upload, download and view. The
second plugin is a graphical viewer for the set of
LRSs stored in the platform, with features for plotting
graphs or trends, and also for filtering the collection
of events according to multiple criteria. As an illustra-
tion, Figure 1 reproduces a screenshot of the activity
logs, and an example of the viewer —a histogram of
the number of interactions of a student with each re-
source type along the course— appears in Figure 2.
3 APPLICATION
The SocialWire platform has been used to teach one
computer networking course over several consecu-
tive academic years. In this work we consider the
2015/2016 and 2016/2017 editions. The course is
directed to undergraduates of the second year of the
Telecommunications Engineering Degree, and has a
weekly schedule that lasts 14 weeks.
Lectures are organized as follows:
• A two-hour in-class lecture, that mixes descrip-
tive content (the Internet architecture, basic prin-
ciples and concepts, anatomy of the main proto-
cols) with some elementary mathematical details
for analyzing network performance.
• A two-hour laboratory session, in small study
groups. This is a complementary session where
the students solve written exercises, work with
real networking equipment and make a small pro-
gramming assignment.
The students (and teachers) belong to a single
group in SocialWire, wherein general communication
about the topics covered takes place. To encourage
networked learning activities and collaborative work,
each year the teachers plan different activities in So-
cialWire whereby the students may gain points (the
resulting ranking is made public to the group). In the
two editions considered in this work three types of
online activities were proposed:
• Tasks previous to the in-class or the laboratory
sessions. By means of this activity teachers
successfully encourage the students to prepare
some of the material covered in the in-class or the
laboratory sessions in advance.
• Quizzes previous to the partial exams. Quizzes
are just practice exams for self-training.
• Collaborative answering of questions. This acti-
vity consist on posing and solving questions or
doubts about the subject. The students can send
their questions, an so do the instructors occasio-
nally. Each apt answer gets a number of points
that depends on its quality, completeness and also
of the difficulty of the question. Teacher can re-
ward the timeliness in answering a question,too.
Face-to-face interaction (in the classroom and in
the laboratory session) is still the bulk of the course,
for a total of 50 hours. But the social networking acti-
vities occupy a significant fraction of the independent
study time by the students (an average of 10-12 hours
is spent in the online activities by the students, though
there is a wide variability). More importantly, there is
actually a connection between the more formal face-
to-face learning activities and the online tasks, in that
many discussions and homework problems start in the
classroom but take place further through the online
platform, and are finished there.
Though this subject may be passed with a single
final examination covering all the material (and if the
programming assignment meets the minimum requi-
rements), students are encouraged to follow the conti-
nuous assessment path. In the two academic years,
the weight of the continuous assessment was 40%,
and the remaining 60% being awarded as the result
of a final exam held on two different dates (last week
of May and first week of July, non-exclusive). The
continuous assessment weight is split into a 10% for
the programming assignment, a 20% from the partial
exams and a 10% of the final grade comes out from
the game points gathered by engaging in the social
activities commented previously to increase the level
of participation. While it is true that one point in the
final grade might seem a too scarce pay off for the
best student, we believe it is important that the full
score is easily achievable by a significant fraction of
the class. Thus, in order to convert the point marks
into a grade, if P
av
is the average number of ranking
points per student and P
max
is the maximum, we com-
pute M = min{P
av
,P
max
/2}. In the conversion scale,
M represents 0.5 grade points, and every student ha-
ving at least 2M game points gets the full 1 grade
possible with this part. In doing so, we try to pre-
serve the incentive-driven effect whereby the average-
performing student is still engaged and the best stu-
dents attain due pay offs.
In Table 1 we show some data related to the co-
horts of students involved in the study, the size of the
CSEDU 2018 - 10th International Conference on Computer Supported Education
376

Figure 1: Screenshot of the events collector plugin (filtering of activities in the SLE platform).
Figure 2: Screenshot of the events collector plugin (number of interactions of a student with the learning resources).
cohort, the number of second-taking students and the
number of students that participated in the activities
scheduled for continuous assessment.
4 ANALYSIS OF THE DATASETS
Although we have a detailed record of all the student’s
activity related to the course, we have analyzed some
features which could be related to the students’ ulti-
mate performance at the end of the course.
• ST: Second-taking (or not), i.e., whether the stu-
dent has previously taken this course or is a fresh-
man.
• CA: Continuous assessment (or not), i.e., whether
the student chooses continuous assessment during
the term rather than a single examination at the
end.
• GP: The total number of points received in the
tasks, quizzes and answers to the questions posed
through the platform.
• RC: A variable keeping track on whether the stu-
dent watches the learning resources companion to
the lectures (for instance, slides, short videos, tu-
torials, etc.)
• RL: An analogous variable, this time for the acti-
vity of watching learning resources specifically
prepared for the laboratory sessions (e.g., reading
the manuals, downloading the software tools, etc.)
• RT: The student reads the tasks.
• RP: The student reads the documents and resour-
ces which are necessary for completing the pro-
gramming assignment.
• RE: The student reads the solutions of partial ex-
ams.
• SE: Slope of all the events related to any part of
the course. In addition to the already mentioned
events —which have been covered by the varia-
bles above— this also includes events such as rea-
ding some blog article, or reading some news with
content related to the topics of the course. The
slope is simply the number of events per unit time.
In order to select the features most correlated with
the achievements of the course, we have carried out
two statistical tests.
First, we measured the statistical correlations be-
tween the features under study and the final grades
obtained in the subject. The sample correlations
ˆ
ρ
were computed and the linear regression statistical
test was used to quantify such correlations. This test
Prediction of Learning Success Via Rate of Events in Social Networks for Education
377

Table 1: Cohorts data.
Academic years 2015/16 - 2016/17
Size Second-taking Continuous assessment
180 - 182 82 - 92 168 - 176
Table 2: Correlation between features and student’s performance.
Academic years 2015/16 - 2016/17
ˆ
ρ (
ˆ
β,t,P(> |t|))
ST 0.0186 - 0.1551 (0.0709,0.2491,8.041 · 10
−1
) - (−0.6632,−0.2107,3.651 · 10
−2
)
CA 0.2831 - 0.1891 (2.1518,3.9391,1.171 · 10
−4
) - (2.1031,2.5851,1.053 · 10
−2
)
GP 0.5231 - 0.7253 (0.0895, 8.1882,4.982 · 10
−14
) - (0.0841,14.1371,2.001 · 10
−16
)
RC 0.0696 - 0.1563 (0.0055,0.9312,3.531 · 10
−1
) - (0.0125,2.1241,3.501 · 10
−2
)
RL 0.2039 - 0.3234 (0.0228,2.7791,6.042 · 10
−3
) - (0.0642,4.5861,8.431 · 10
−6
)
RT 0.3577 - 0.4842 (0.0358,5.1121,8.191 · 10
−7
) - (0.0667,7.4271,4.301 · 10
−12
)
RP 0.3299 - 0.5141 (0.0306,4.6641,6.071 · 10
−6
) - (0.0492,8.0401,1.161 · 10
−13
)
RE 0.3311 - 0.3424 (0.0779,4.6822,5.631 · 10
−6
) - (0.0705,4.8892,2.231 · 10
−6
)
SE 0.3764 - 0.5401 (0.1041,5.4221,1.901 · 10
−7
) - (0.1977,8.6083,3.631 · 10
−15
)
quantifies the statistical significance of a linear fit of a
response variable on one factor variable. The estima-
ted linear coefficient is denoted by
ˆ
β. Under the null
hypothesis (meaning that there is no such linear de-
pendence) the test statistic follows a t-distribution and
high values are very unlikely (Hastle et al., 2008). As
we can see in Table 2 there is a significant positive de-
pendence between almost all the considered factors,
namely GP, RL, RT, RP, RE, and SE and the students’
performance. Actually, the correlation for ST for the
subset of data corresponding to the 2015/2016 edition
is almost zero, whereas it is negative for the subset
of data taken for the 2016/2017 edition. This con-
firms that many of the students who take the course
for a second time perform clearly better. The low
values obtained for the variable RC are not surpri-
sing, after all, since the learning resources which go
along the lectures are commonly read and downloa-
ded by nearly all the students. And the low values
for the variable CA are due to the fact that an overw-
helming fraction of the students prefer the continuous
assessment option, especially in the academic year
2016/2017.
Second, we measured the correlation between the
features under study on the students who pass or fail
the subject. To answer this question, we applied the
Smirnov’s statistical test. This is a classical hypothe-
sis test for comparing the equality between two proba-
bility density functions, or its lack of equality. Speci-
fically, under the null hypothesis that the two distribu-
tions (students who pass/fail) are equal, the value of
the Smirnov’s statistic follows a known distribution.
In that probability distribution, values of the p-value
greater that the level of significance (5%) do not allow
to reject the equality hypothesis (Hastle et al., 2008).
In view of the results shown in Table 3, equality bet-
Table 3: Significant differences between the features of stu-
dents that pass or fail the subject.
Academic years 2015/16 - 2016/17
(D, p-value)
ST (0.1257,4.926 · 10
−1
) - (0.1181,5.828 · 10
−1
)
CA (0.0634,9.943 · 10
−1
) - (0.0524,9.998 · 10
−1
)
GP (0.4577,1.803 · 10
−8
) - (0.6035,4.008 · 10
−14
)
RC (0.1795, 1.159 · 10
−1
) - (0.2688,3.821 · 10
−3
)
RL (0.2293,1.921 · 10
−2
) - (0.2761,2.714 · 10
−3
)
RT (0.3681,1.262 · 10
−5
) - (0.4243,3.384 · 10
−7
)
RP (0.2971,8.156 · 10
−4
) - (0.5015,6.968 · 10
−10
)
RE (0.2881,1.301 · 10
−3
) - (0.4232,3.679 · 10
−7
)
SE (0.3627,1.775 · 10
−5
) - (0.5922,1.292 · 10
−13
)
ween the two distributions is rejected in both editions
in GP, RL, RT, RP, RE and SE.
The results obtained in both cases suggest that GP,
RL, RT, RP, RE, SE are highly correlated with the
achievements in the course and could be good predic-
tors of the student’s grade. Or, in the reverse direction,
that few or no participation in the social platform by
a student could be an early alert of bad learning re-
sults. In Section 5 we explain how these features are
used in this work to build learning success/failure pre-
diction methods, based on popular statistical learning
techniques.
5 LEARNING SUCCESS/FAILURE
PREDICTION
To check the power of the above selected measures
to predict students success/failure, we have conside-
red three popular statistical learning classifiers (Han
et al., 2012), namely logistic regression (LR), linear
CSEDU 2018 - 10th International Conference on Computer Supported Education
378

Table 4: Performance results of thecombined technique.
2015/16 2016/17 2015/16 → 2016/17 2016/17 → 2015/16
Accuracy
GP+RL+RT+RP+RE+SE 0.7804 0.9077 0.7945 0.9196
GP+PE 0.7955 0.9111 0.8001 0.9057
PE 0.8737 0.9276 0.8674 0.9208
Sensibility
GP+RL+RT+RP+RE+SE 0.8233 0.9344 0.9159 0.9826
GP+PE 0.8478 0.9442 0.8899 0.9658
PE 0.9977 0.9985 0.9999 0.9993
Precision
GP+RL+RT+RP+RE+SE 0.7847 0.9131 0.7038 0.8828
GP+PE 0.7858 0.9092 0.7428 0.8792
PE 0.7791 0.8825 0.7697 0.8752
discriminant analysis (LDA) and support vector ma-
chines (SVM). These classifiers function in two pha-
ses: during the training phase they are presented with
a set of input-output pairs. Each classifier then adjust
its internal parameters and during the testing phase
they are presented with new input data to predict the
outputs. If actual output values are available, the com-
parison with the predicted ones is used to measure the
performance of the classifier.
In our application, the training sets consist of the
selected student data of the two offerings of the course
considered in the study (we have selected these data-
sets due to the high similarities in the methodology
along the whole term in both offerings). The output is
the binary variable that represents the success or fai-
lure of the students in the course, and the input is a
combination of some of the features described in the
previous section.
We use k-fold cross validation to consider multi-
ple training/testing set partitions. If the set of obser-
vations is the same for training and testing, this ap-
proach involves randomly divide it into k groups of
approximately equal size. The procedure is repeated
k times and each time k − 1 different groups of obser-
vations are treated as the training set and the other one
as the testing set. If one set of observations is used for
training and another different for testing, the first one
is divided into k groups of approximately equal size
and in each repetition of the procedure k − 1 diffe-
rent groups are treated as the training set. In any case,
as this procedure results in k values, the performance
results are computed by averaging these values. We
have selected k = 5 in our proofs and, in order to in-
crease the accuracy, we have repeated the procedure
10 times, being the final performance values obtained
by averaging again the 10 resulting values.
To evaluate the performance of decision we have
used three different criteria, which estimate the accu-
racy, the sensitivity and the precision. We consider the
following notation: PF the predicted failures, PS the
predicted successes, TPF the correct predicted failu-
res, TPS the correct predicted successes, FPF the in-
correct predicted failures and FPS the incorrect pre-
dicted successes.
The accuracy criterion measures the total propor-
tion of the students whose final status, failing or pas-
sing the course, was correctly predicted
Accuracy =
TPF + TPS
PF + PS
.
The sensitivity criterion measures the proportion of
the students whose final status, failing (or passing) the
course, was correctly predicted
Sensibility =
TPF
TPF + FPS
or Sensibility =
TPS
TPS + FPF
.
The precision criterion is used to determine the pro-
portion of the students that actually failed (or passed)
the course, among all those that the method predicted
as such.
Precision =
TPF
TPF + FPF
or Precision =
TPS
TPS + FPS
.
In order to increase the level of accuracy, we pro-
pose a combined method where a student is conside-
red to fail the subject if at least one technique (LR,
LDA or SVM) has classified it as such. In Table 4
we show the results obtained (considering the pre-
diction of successes). The first two columns consider
the same dataset for training and testing and the last
two columns consider one of the datasets for training
and the other one for testing.
After testing combinations of different subsets of
predictors, we found that the variable PE, i.e., the
slope of the events by a student, produces the most
accurate results. For that reason, in the Tables the re-
sults which were obtained by combining all the pre-
diction factors that showed significant correlation are
shown along with the outcomes for GP+PE, and for
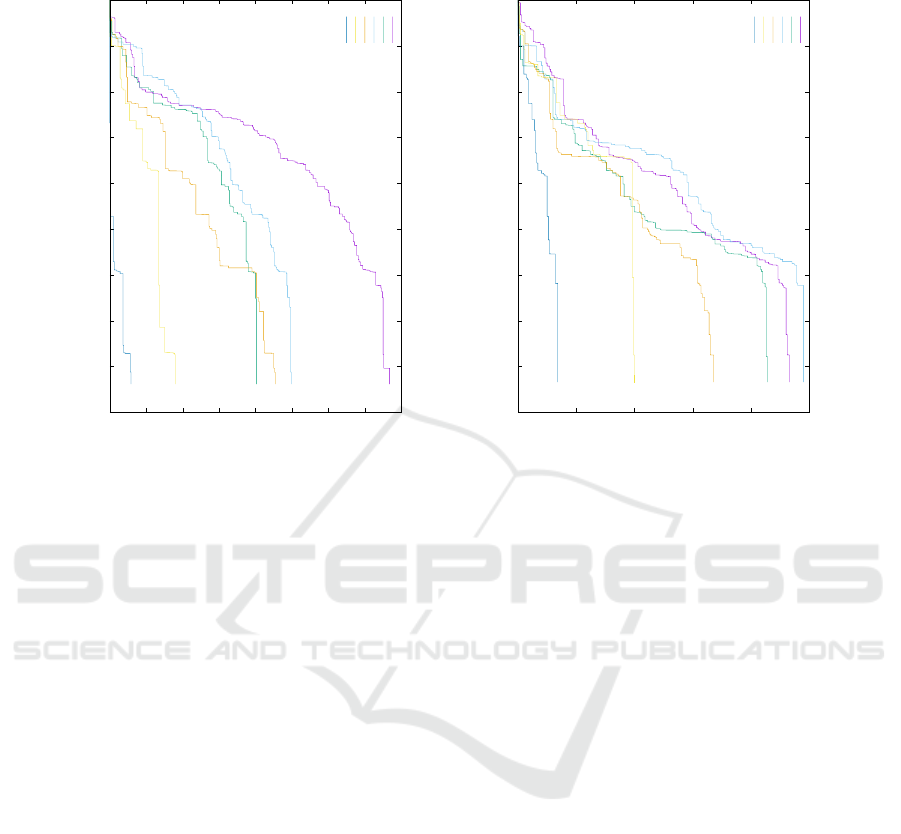
PE alone. The events rate can be tracked thanks to
events collector and the viewer plugins, as mentio-
ned, and is easy to display. As en example, Figure 3
depicts the accumulated number of events for a sam-
ple of 6 students in each academic year.
In Tables5 we show the results obtained taking
into account the accumulated values of the predictors
Prediction of Learning Success Via Rate of Events in Social Networks for Education
379

Table 5: Performance results of the combined technique (until end of each month).
Until end of February 2015/16 → 2016/17 2016/17 → 2015/16
Accuracy
GP+RL+RP+SE 0.7727 0.7461
GP+PE 0.8012 0.7951
PE 0.8608 0.8746
Sensibility
GP+RL+RP+SE 0.8971 0.8849
GP+PE 0.9079 0.9266
PE 0.9753 0.8851
Precision
GP+RL+RP+SE 0.6829 0.6824
GP+PE 0.7268 0.7237
PE 0.7851 0.9243
Until end of March 2015/16 → 2016/17 2016/17 → 2015/16
Accuracy
GP+RL+RT+RP+SE 0.8249 0.8619
GP+PE 0.7945 0.8524
PE 0.8727 0.8676
Sensibility
GP+RL+RT+RP+SE 0.9725 0.9649
GP+PE 0.8787 0.9293
PE 0.9871 0.9379
Precision
GP+RL+RT+RP+SE 0.7214 0.8037
GP+PE 0.7342 0.8269
PE 0.7969 0.8421
Until end of April 2015/16 → 2016/17 2016/17 → 2015/16
Accuracy
GP+RL+RT+RP+RE+SE 0.7732 0.8936
GP+PE 0.7834 0.8584
PE 0.8523 0.9018
Sensibility
GP+RL+RT+RP+RE+SE 0.8898 0.9781
GP+PE 0.8823 0.9519
PE 0.9933 0.9706
Precision
GP+RL+RT+RP+RE+SE 0.7032 0.8474
GP+PE 0.7178 0.8069
PE 0.7514 0.8692
Until end of May 2015/16 → 2016/17 2016/17 → 2015/16
Accuracy
GP+RL+RT+RP+RE+SE 0.9186 0.9175
GP+PE 0.9065 0.8953
PE 0.8554 0.9194
Sensibility
GP+RL+RT+RP+RE+SE 0.9676 0.9722
GP+PE 0.9627 0.9513
PE 0.9962 0.9999
Precision
GP+RL+RT+RP+RE+SE 0.8983 0.8936
GP+PE 0.8844 0.8774
PE 0.7521 0.8739
at the end of February, March, April and May. It is im-
portant to highlight that although the schedule of the
course was similar in both editions, there were small
differences between one academic year and the fol-
lowing one. Notably, despite these differences, the
results are very good, even if some features (RT and
RE in February; RE in March) did not were applica-
ble yet by the time of applying the prediction model.
This is an indication that this prediction method
can generalize well, and these students’ data can be
used by the teachers to predict (and avoid) learning
failures, due to most of the features selected can be
measured early in the course.
6 CONCLUSIONS
In this work we compare and combine the po-
wer of different statistical learning techniques for
success/failure prediction in learning-oriented social
networks. We select as predictors the factors or vari-
ables that have measurable correlation with the stu-
dent’s performance. The final results obtained are
highly significant. In particular, our main conclusion
CSEDU 2018 - 10th International Conference on Computer Supported Education
380
0
50
100
150
200
250
300
350
400
0 2000 4000 6000 8000 10000 12000 14000 16000 18000
events
time
1
2
3
4
5
6
0
50
100
150
200
250
0 2000 4000 6000 8000 10000 12000 14000 16000 18000
events
time
1
2
3
4
5
6
Figure 3: Accumulated events 2015/2016 (left) and 2016/2017 (right). The legend means: (1) Best final grade and in the
top-ten of the ranking; (2) Second best final grade; (3) Best student in the ranking, a second-taking student in both editions
and passes the course; (4) Intermediate position in the ranking and passes the course; (5) Drops the online learning activities
in the middle of the term and fails the course; (6) Very low activity along the whole term in the platform and fails the course.
is that, according to our data, it is not the type of
event/activity initiated by the student what best pre-
dicts his/her final grade, but the slope of the events
he/she was engaged in. In other words, we have found
that the pace of activities done by the students matters,
much more in statistical terms than the kind of lear-
ning activity. This is a strong hint that these data, that
can be measured early and accurately in the course,
can be used by the teachers to implement timely pe-
dagogical interventions.
REFERENCES
Brinton, C. and Chiang, M. (2015). MOOC performance
prediction via clickstream data and social learning
networks. In INFOCOM’15, IEEE Conference on
Computer Communications.
Cadima, R., Ojeda, J., and Monguet, J. (2012). So-
cial networks and performance in distributed learning
communities. Educational Technology & Society,
15(4):296–304.
Chung, K. and Paredes, W. (2015). Towards a social net-
works model for online learning & performance. Edu-
cational Technology & Society, 18(3):240–253.
Eid, M. and Al-Jabri, I. (2016). Social networking, know-
ledge sharing and student learning: The case of uni-
versity students. Computers & Education, 99:14–27.
Elgg. http://elgg.org.
Han, J., Kamber, M., and Pei, J. (2012). Data mining: Con-
cepts and techniques. Morgan Kaufmann.
Hart, J. (2011). Social learning handbook. Centre for Lear-
ning and Performance Technologies.
Hastle, T., Tibshirani, R., and Friedman, J. (2008). The
elements of statistical learning. Springer.
Hommes, J., Rienties, B., Grave, W., Bos, G., Schuwirth,
L., and Scherpbier, A. (2012). Visualising the invisi-
ble: A network approach to reveal the informal social
side of student learning. Advances in Health Sciences
Education, 17(5):743–757.
Laat, M., Lally, V., Lipponen, L., and Simons, R. J. (2007).
Investigating patterns of interaction in networked lear-
ning and computer-supported collaborative learning:
A role for social network analysis. International Jour-
nal of Computer-Supported Collaborative Learning,
2(1):87–103.
Lykourentzou, I., Giannoukos, I., Nikolopoulos, V., Mpar-
dis, G., and Loumos, V. (2009). Dropout prediction
in e-learning courses through the combination of ma-
chine learning techniques. Computers & Education,
53(3):950–965.
Macfadyen, L. and Dawson, S. (2010). Mining LMS
data to develop an ”early warning system” for edu-
cators: A proof of concept. Computers & Education,
54(2):588–599.
Skrypnyk, O., Joksimovic, S., Kovanovic, V., Gasevic, D.,
and Dawson, S. (2015). Roles of course facilitators,
learners and technology in the flow of information of a
cMOOC. International Review of Research in Online
and Distance Learning, 16(3):743–757.
SocialWire. http://socialwire.es.
Sousa, E., L
´
opez, J., and Fern
´
andez, M. (2017a). Charac-
terizing social interactions in online social networks:
The case of university students. In CSEDU’17, Inter-
Prediction of Learning Success Via Rate of Events in Social Networks for Education
381

national Conference on Computer Supported Educa-
tion.
Sousa, M., L
´
opez, J., Fern
´
andez, M., Rodr
´
ıguez, M.,
and Herrer
´
ıa, S. (2016). An open-source platform
for using gamification and social learning methodo-
logies in engineering education: Design and expe-
rience. Computer Applications in Engineering Edu-
cation, 24(5):813–826.
Sousa, M., L
´
opez, J., Fern
´
andez, M., Rodr
´
ıguez, M., and
L
´
opez, C. (2017b). Mining relationships in learning-
oriented social networks. Computer Applications in
Engineering Education, 25(5):769–784.
Vassileva, J. (2008). Toward social learning environ-
ments. IEEE Transactions on Learning Technology,
1(4):199–214.
CSEDU 2018 - 10th International Conference on Computer Supported Education
382
