
Anomaly Detection Approaches for Secure Cloud Reference
Architectures in Legal Metrology
Alexander Oppermann
1
, Federico Grasso Toro
1
, Florian Thiel
1
and Jean-Piere Seifert
2
1
Department 8.5 Metrological IT, Physikalisch-Technische Bundesanstalt (PTB), Berlin, Germany
2
Security in Telecommunications, Technische Universitat Berlin, Berlin, Germany
Keywords:
Anomaly Detection, Continous Monitoring, Secure Cloud Computing, Anomaly Detection as a Service,
Distributed Computing, Legal Metrology.
Abstract:
Securing Computer Systems against all kind of threats is an impossible challenge to fulfill. Although, in the
field of Legal Metrology, it shall be assured that one can rely on the measurement carried out by a trusted
computer system. In a distributed environment, a measurement instrument cannot be simply disconnected to
gurantee its security. However, being able to monitor the computer systems constantly in order to deduce a
normal system behaviour, can be a particular promising approach to secure such systems. In cases of detected
anomalies, the system evaluates them to measure the severity of the detected incident and place it into three
different categories: green, yellow and red. The presented Anomaly Detection Module can detect attacks
against distributed applications in an cloud computing environment, using pattern recognition for clustering
as well as statistical approaches. Both, inexperienced and experienced attacks have been tested and results are
presented.
1 INTRODUCTION
The main purpose of Legal Metrology is to establish
trust between the consumer and the user of a measur-
ing instrument, since none of them can guarantee the
validity of the measurement result. This task has to
fulfill the notified body, in Germany the Physikalisch-
Technische Bundesanstalt (PTB) is responsible for
this. The focus hereby lies on the essential require-
ments of the Measuring Instrument Directive (MID),
like reproducibility, repeatability, durability and the
protection against corruption of the measuring instru-
ment and its measurements (European Parliament and
Council, 2014). The key purpose of legal metrology is
to assure the correctness of measurements and to en-
hance public trust in them especially when the mea-
suring instruments are becoming more complex and
the used technology is not easily to comprehend any-
more.
Like many other areas, Legal Metrology faces a
big transition from well contained measuring instru-
ments to distributed measuring systems. By introduc-
ing Cloud Computing to Legal Metrology, the mea-
suring instrument, as we know it today, will be re-
duced to a sensor with a communication unit, while
processing and storing of the measurement results
will be done in the cloud. The manufacturers want
to employ Cloud Computing to provide, e.g. their
customer a more comfortable, modernized and flex-
ible way of dealing with their meters at home. This
can mean on the one hand, that measurement results
become accessible via mobile devices or on the other
hand providing better service via intelligent data ser-
vices.
In 2016, a secure reference cloud architecture was
described (Oppermann et al., 2016) that addresses the
mentioned transition as well as the security challenges
in Legal Metrology. Furthermore, the proposed archi-
tecture had to deal with the requirements of the MID
and the WELMEC guide (WG7, 2012). Via fully
homomorphic encryption (FHE) (Oppermann et al.,
2017) the authors addressed the main threats, like an
insider attack and data manipulation in the cloud, in
order to create an acceptable solution that provides
adequate security. To test FHE under real world de-
mands, four application scenarios are developed and
applied to the Smart Meter Gateway (SMGW) tariffs.
These Tariff application (TAF) are derived from the
technical guide for SMGW of the Federal Buereau of
Information Security (BSI) in Germany (BSI, 2013).
In this paper we propose the bases for an anomaly
detection module for the secure cloud reference ar-
Oppermann, A., Grasso Toro, F., Thiel, F. and Seifert, J.
Anomaly Detection Approaches for Secure Cloud Reference Architectures in Legal Metrology.
DOI: 10.5220/0006777105490556
In Proceedings of the 8th International Conference on Cloud Computing and Services Science (CLOSER 2018), pages 549-556
ISBN: 978-989-758-295-0
Copyright
c
2019 by SCITEPRESS – Science and Technology Publications, Lda. All rights reserved
549

chitecture described in (Oppermann et al., 2017).This
module will constantly monitor the platform while
learning the normal behaviour and pattern of the tar-
iff applications. In cases of detected anomalies, the
system will evaluate it to measure the severity of the
detected incident. Then, accordingly, an alert will be
triggered. This alert classifies the incident into three
categories: green, the system is in a normal state; yel-
low, the system has an anomaly but the system stabil-
ity is not affected; red, the system has an anomaly and
the system stability is affected.
The remainder of this paper is organized as fol-
lows: Section 2 states the related work in anomaly
detection; Section 3 describes the cloud reference ar-
chitecture and all its modules; Section 4 details full
lifecycle example for Legal Metrology; Section 5 de-
scribes the anomaly detection module, as well as sim-
ulated inexperienced and experienced attacks on the
lifecycle; Section 6 gives an overview of the results,
conclusions and further work.
2 RELATED WORK
Anomaly detection in distributed software architec-
tures has evolved over the years and developed many
different tools and methods in that area. Depend-
ing on the analyzed input for detecting anomalies in
cloud computing architectures two most significant
approaches can be extracted namely (Barbhuiya et al.,
2015):
1. Console log based anomaly detection
2. Anomaly detection based on system metrics.
A brief overview of these two approaches is given
in the next paragraphs.
Console Log based Anomaly. Typical tools for de-
tecting anomalies in log files, like Simple Event Cor-
relator (SEC) (Rouillard, 2004), Logsurfer (Prewett,
2003) and swatch (Hansen and Atkins, 1993), have a
set of rules from which they deduce a normal system
behavior. Normally, these rules will be set and tuned
manually by developers, which makes these systems
error prone, complex, and expensive because of the
human factor, needed expert knowledge and the gen-
eral caused inefficiency. These factors led to statis-
tical learning in log based analytic tools (Xu et al.,
2009), that use statistical techniques based on pre-
filtered log files to build automatically models for sys-
tem anomaly recognition.
The statistical learning techniques in general con-
sist of a learning process and a detection process (Lou
et al., 2010). The learning process first pools log mes-
sage parameters and then derives the invariants within
the log message parameters. The so acquired knowl-
edge will then be used on new input data and matched
against their invariants. An anomaly is found, in case
a of a mismatch of the compared invariants.
Another approach is described in (Xu et al., 2009)
that harvest console logs to automatically detect sys-
tem problems. Based on the log files a feature vector
is created and then evaluated by Principal Component
Analysis (PCA) algorithm to find anomalies.
Albeit, to provide a reliable feature vector as well
as to learn the existing structure of the log files a cus-
tomized parser with access to the sources of the mon-
itored application is needed.
System Metric based Anomaly. System metrics
can be collected without causing great impact on
the monitored system nor the need of accessing the
source code of the monitored application. Further ad-
vantages for this monitoring approach are that it is
easier to cope with traditional demands of cloud com-
puting system in respect of elasticity, scalability and
migration as well as termination of services in short
periods of time. Thus, there exists a wide range of
anomaly detection tools that take advantage of sys-
tem metrics (Tan et al., 2012)(Wang, 2009)(Ward and
Barker, 2013)(Kang et al., 2010)(Jiang et al., 2009)
and realize all these advantages despite their different
evaluation techniques.
EbAT (Wang, 2009) uses an entropy based
anomaly detection and focuses on dispersal or con-
centration of the measured metric distribution. To
detect anomalies in the entropy time-series, EbaT
employs third party online evaluations methods like
spike detection, signal processing and subspace meth-
ods. Despite the variety of evaluation methods the
complexity rises at the same time.
Varanus (Ward and Barker, 2013) implements a
gossip communication protocol to collect system met-
rics from virtual machines (VM) and can analyze
them in situ for anomalies. This approach can spare
dedicated monitoring server for data storage. How-
ever, due to the nature of the gossip protocol a lot of
redundancy of metric-data is generated, the commu-
nication is not reliable and maintenance of the com-
munication protocol is quite complex.
PeerWatch (Kang et al., 2010) specializes in cor-
relations of multiple system resource metrics like
CPU utilization, memory utilization and network traf-
fic and evaluates them with the help of canonical cor-
relation analysis (CCA). An anomaly is detected
whenever correlations between the chosen metrics
drop notably. PeerWatch detects anomalies on the
CLOSER 2018 - 8th International Conference on Cloud Computing and Services Science
550
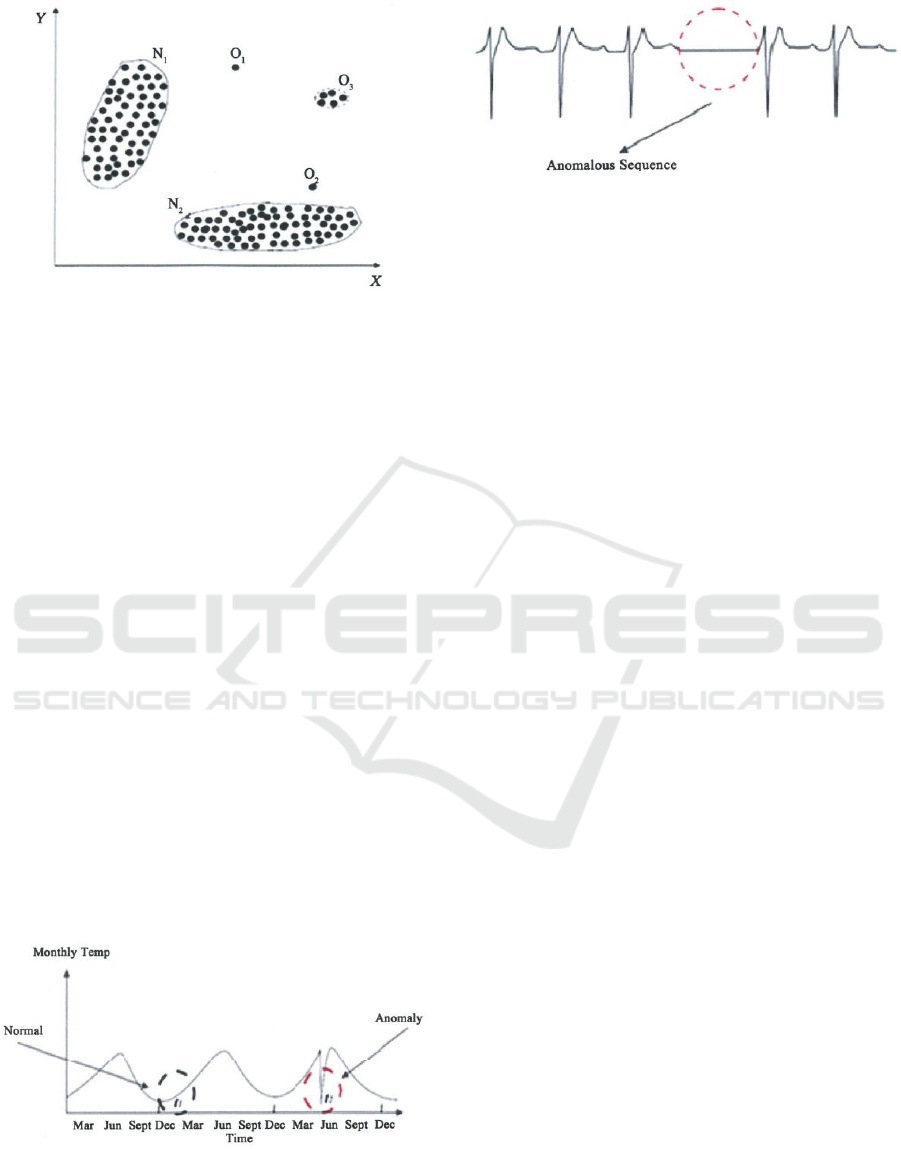
Figure 1: Example of a typical point anomaly. Illustration
from (Sari, 2015).
application-level, but this approach needs knowledge
of the employed applications, which is challenging in
a huge distributed environment with many different
applications running.
A Light-Weight-Failure-Detection (LFD) algo-
rithm is proposed in (Tan et al., 2012) that is designed
to work with a metric-based black box. This approach
does not need any insight of the monitored applica-
tion neither in source code nor training or understand-
ing of the underlying structured application. LFD
allows an decentralized monitoring approach and is
less complex compared to EbAT, Varanuns and Peer-
Watch. Anomalies are detected by LFD if correlations
drop significantly between two specific system met-
ric. However, the decentralized monitoring approach
can be the bottleneck in large-scaled cloud system,
due to the overhead of implementing LFD on each
node.
The anomalous patterns in collected system met-
rics, such as CPU utilization and network traffic pro-
vide important information to the responsible enti-
ties and help to mitigate probable system failures,
attacks and to locate and trace the cause of errors.
The three most common anomalous patterns (Marhas
Figure 2: Example of a typical contextual anomaly. Illus-
tration from (Sari, 2015).
et al., 2012) will be described in the following para-
graphs.
Figure 3: Example of a typical collective anomaly. Illustra-
tion from (Sari, 2015).
Point Anomalies are the easiest and most impor-
tant form for anomaly detection. The data diverges
form the expected and lies outside the boundaries of
what is prior defined as normal (see Figure 1).
Contextual Anomalies are described as occur-
rences of information that show anomalous behavior
in a context of a normal data instance. This kind of
anomaly detection usually needs an idea or intuition
of the context of the monitored data (see Figure 2).
It is also known as conditional anomaly (Song et al.,
2007).
Collective Anomalies occur in collected data sets
that show anomalous behaviour in related data. This
anomaly cannot be detected in a singular metric but
rather in relationships among different correlated met-
rics like in sequential, spatial or graph data (see Fig-
ure 3).
3 SECURE CLOUD
ARCHITECTURE
In this section an overview of the proposed secure
reference architecture (Oppermann et al., 2016) and
its modules are given (see Figure 4). It makes use
of virtualization techniques, in order to keep legally
relevant software modules apart from legally non-
relevant. Among other advantages, like increasing
workload, decreasing idle time of servers and improv-
ing the overall cost-efficiency ratio, it would also ease
software updates for manufacturers within the non-
relevant part, since it could be updated without prior
verification by a notified body.
The Infrastructure as a Service (IaaS) layer is con-
structed with the help of the Openstack framework,
it comprises the actual physical devices like servers,
storage, and the network. The network is separated
into logically smaller entities via sub netting. IaaS
enables also a first low-level separation of legally rel-
evant processes.
The Platform as a Servic (PaaS) layer is build
up using the microservice pattern (Richardson, 2011)
Anomaly Detection Approaches for Secure Cloud Reference Architectures in Legal Metrology
551

Figure 4: Overview of the cloud reference architecture.
The measurement device is reduced to only a sensor and
communication unit, while processing and storage will be
moved to the cloud environment.
and Spring Boot
1
with Spring Cloud
2
and the Net-
flix software stack
3
. By implementing microservices
it can be guaranteed that each service maintains its
core functionality while at the same time reducing the
software lines of codes (SLOC), which helps to main-
tain a clear code basis. Moreover, microservices help
to scale the system seamlessly and use the resources
more efficiently with less idle times for the hardware.
Microservices are polyglott. This means each service
can be written in a different programming language
which ever fits to solve the problem best.
The communication is established via a consis-
tent RESTful API that allows a simple yet reliable
interchange of messages. Further an active message
queue is installed that guarantees pseudo resilience,
that means if a service is unavailable, e.g. due down-
time, the messages will be queued and delivered at a
later time. The measurement data itself is directly en-
crypted in the sensor unit via fully homomorphic en-
cryption (FHE) (Gentry et al., 2009). The encrypted
data will be send to the cloud, is being processed and
stored without leaving the encrypted domain once.
Furthermore, virtual machines (VM) are created
for the most important legally relevant tasks to in-
crease their security and deliberately separate them
from other third party services, e.g. to ease update
processes. Among security advantages, VMs increase
the portability, distributability and scalability.
Logbook. The Logbook VM hosts the software pro-
cess responsible for logging all relevant activities
around the measuring system, i.e. arrival, processing,
saving of measurement data, user activities, software
updates etc.
Legal Processing. The Legal VM is responsible for
processing measurement data. This VM has the most
1
http://projects.spring.io/spring-boot
2
https://cloud.spring.io/spring-cloud-netflix/
3
http://netflix.github.io
Figure 5: Overview of the network topology of the cloud
reference architecture with its different subnetworks. The
blue shape is the Legal Metrology Network. The red shape
is the ingress network, which separates the other subnet-
works from the internet.
cpu cores available, since it has to carry out all the
computation for the measurement data.
Download Manager. The Download Manager re-
ceives signed software update from the manufacturer.
After carefully checking the integrity and authenticity
of the received update, it will spread the update to the
dedicated machine.
Storage Manager. The Storage Manager is de-
signed to store measurement data for a long time pe-
riod. Thus it will handle a database and will make the
measurement data available through the secure dis-
play VM, which hosts services to demand data from
the Storage Manager.
Monitoring Service. The Monitoring Service con-
stantly monitors all the VMs while learning their in-
dividual pattern for the running tariff applications, in
order to detect anomalies within the system.
4 LEGAL METROLOGY
APPLICATION LIFECYCLE
Based on the infrastructure described the last section,
a lifecycle is set up to simulate the normal behaviour
of the cloud architecture that can be
monitored to later be used to carry out attacks (see
Section 5.1).
The test life-cycle for the proposed legal metrol-
ogy processing service is formalized in the follow
CLOSER 2018 - 8th International Conference on Cloud Computing and Services Science
552

Algorithm 1 : Legal Metrology Application Lifecycle
(overview).
Input: Measurement data m
1
. . . m
n
, Price data
p
1
. . . p
n
, index of elements i = 1 . . . n
Output: Measurement results mr
1
. . . mr
n
1: Server:
2: checks certificate and the origin of messages
3: if check is successful then
4: notify logbook of received measurement data
5: process data
6: sum m
i
with previous measurement data m
i−1
7: if additions are succesful then
8: compute price p
i
9: save price p
i
10: notify logbook of successful price calcula-
tion
11: end if
12: save data mr
i
13: notify logbook of successful addition
14: else
15: throw data away, → error message to logbook
16: end if
ing algorithm listing and only shows the server side.
The communication endpoints, sender and receiver,
are not considered for this particular case.
This application lifecycle will be the studied case
for the next section for the implementation of the AD-
Module. Also, both kind of attacks from inexperi-
enced and experienced attackers will be used against
the lifecycle and is described in the following section,
as well as results for the AD-Module implementation.
5 AD-MODULE APPROACH
As described in Section 3 a monitor service is planned
and part of the secure cloud architecture. The
anomaly detection module will be part of the moni-
tor service. An evaluation of the anomaly detection
approach is represented here, in order find the perfect
fit in the area of Legal Metrology.
For monitoring in a distributed environment a very
flexible and easy deployable system is needed, since
many different virtual machines need to be monitored
across various time-zones, networks and teams. Fur-
thermore, the monitoring approach may not generate
too much overhead, so that the monitored VM do not
need an unreasonable amount of resources and be-
comes cost-ineffective.
Considering the demands on a cloud environment,
the highly distributable and modularized open source
monitoring software Performance Co-Pilot (PCP)
4
is
used to monitor the deployed virtual machines. PCP
collects over 300 metrics for example CPU utiliza-
tion, network bandwidth, disk I/O and memory us-
age. The modular approach of PCP allows to detach
the logging and collecting. The logging agent (pm-
logger) can be deployed on any VM and being gentle
on resources at the same time. For collecting these
log files a collection daemon (pmcd) can be deployed
on a centralized instance.
PCP allows real-time monitoring as well as col-
lecting archives to replay system behaviour, in order
to analyze for example system anomalies. For visu-
alizing real-time monitoring the open source software
Vector
5
is being used. PCP allows through standard-
ized APIs an exchange of metrics to any software.
The PCP archives can be visualized with the pmchart-
module.
In this paper, only the most significant metrics are
collected and evaluated as part of the AD-Module ap-
proach. Further development will increase the num-
ber of metrics and the level of logging, since more
metrics can be collected on a service level for each
microservice, in order to determine its current status
and health.
The already yielded results stated in Figure 6 and
7 are promising to further pursue this approach. By
finding the correlation between specific metrics re-
lated to the Legal Metrology Lifecycle (see Section
4), the cloud environment normal and anomalous be-
haviour can be represented.
5.1 Simulation of Attacks / Attacker
Model
This section deals with the edge cases of attacker
models, the inexperienced attacker and the experi-
enced one. The first is usually easier to detect, since
she/he does not aim for real harm but rather for atten-
tion and fame. The latter attacker has a most likely fi-
nancial motivation and thus is more cautious and tries
to stay undetected.
5.1.1 Inexperienced Attacker
The inexperienced attacker motivation is usually
driven by fame and the urge to show off the own tal-
ents. This results into a noisy and obvious attack. The
attacker sees no need in staying low and undetected,
since this would undermine the original objectives.
Often the attacks carried out are not very special-
ized nor do they aim for big harm, instead they are
4
http://www.pcp.io/
5
http://vectoross.io/
Anomaly Detection Approaches for Secure Cloud Reference Architectures in Legal Metrology
553
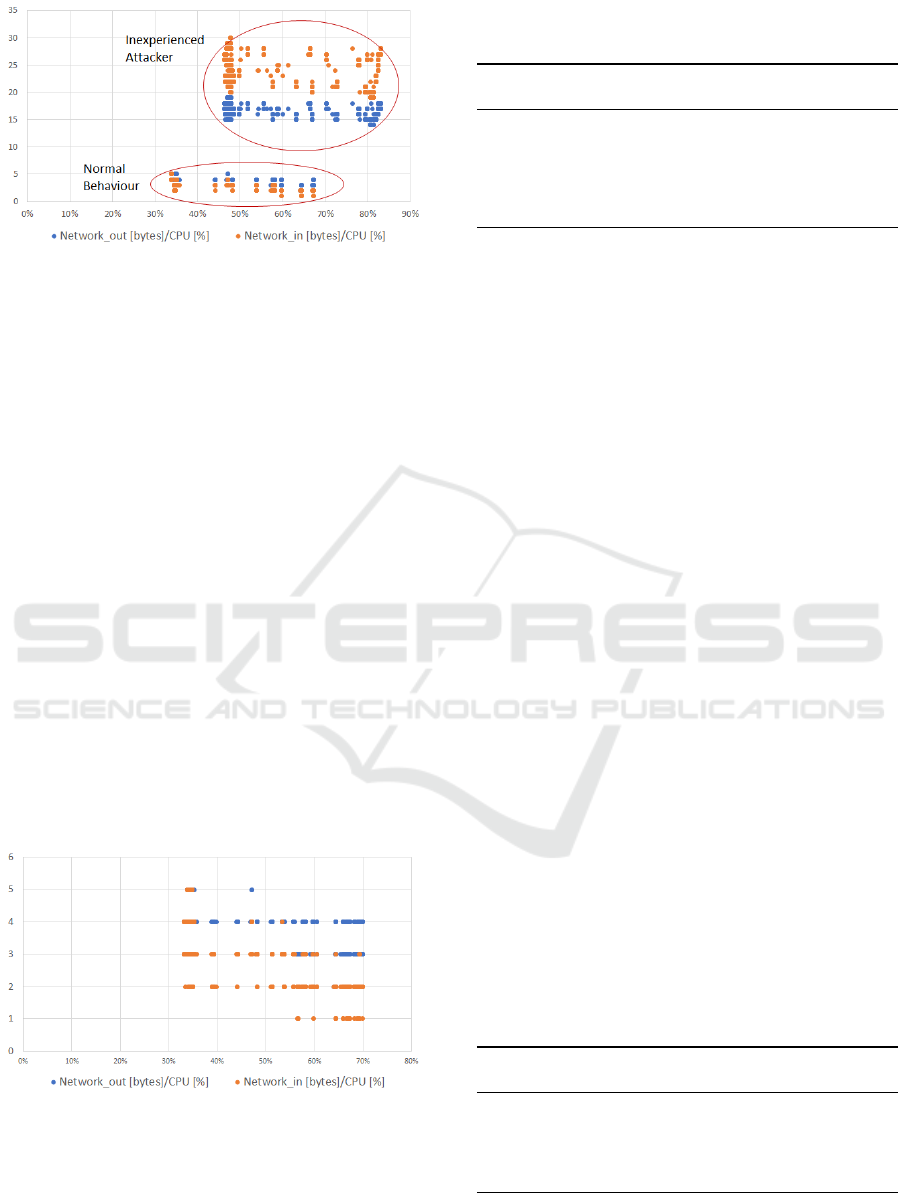
Figure 6: Anomaly measured during a simulated attack of
an inexperienced attacker. The attack generated a lot more
network traffic (packets) and increases CPU utilization sig-
nificantly. Upper cluster is the anomaly and lower cluster is
the normal behaviour.
often sensational, imprecise and inefficient. Never-
theless those attack can cause a lot of costs and in-
convenience on the carrier side.
An inexperienced attack was simulated to see if
the pursued anomaly detection approach can detect
such an assault. The results can be seen in Figure 6.
Noteworthy is here that there are two distinct cluster
that are easily to distinguish. The attacker achieved
a noteworthy anomaly and consumed more resources
than the normal application lifecycle, this can be seen
in the Figure 6, since the upper cluster represents the
attack which consumed more network bandwidth and
CPU utilization. Also, Table 1 represents the anoma-
lous behaviour of network traffic compared to CPU
utilization and puts it into contrast of the normal be-
haviour.
5.1.2 Experienced Attacker
The experienced attacker is more cautious and has of-
Figure 7: Anomaly measured during a simulated attack of
an experienced attacker. The attack generated more network
traffic (packets) and increased CPU utilization but not that
significantly compared to the inexperienced attacker.
ten a money-driven motivation. Those attacker want
to stay undetected and do not brag about their achieve-
ments in public.
Table 1: Comparison of inexperienced attacker to normal
life cycle.
Normal Anomaly Normal Anomaly
CPU Packets in Packets in Packets out Packets out
30-40% 1928 n/a 1506 n/a
40-50% 603 23025 487 33286
50-60% 780 4532 497 6708
60-70% 320 2945 195 4210
70-80% n/a 4101 n/a 5809
80-90% n/a 6764 n/a 9909
The attacks are often hard to detect because they
are very specialized with a lot of insider knowledge.
Furthermore, these operations are careful planned and
carried out with a minimal offset of the normal be-
haviour, which is a challenge to detect and prevent
those attacks. In Figure 7 a simulated insider attack
is carried out and monitored. In contrast to the other
case, one hardly can differentiate two cluster and tell
normal behaviour apart from anomaly. Table 2, com-
pares the anomalies to the normal behaviour by repre-
senting the network traffic in relation to CPU utiliza-
tion.
5.2 Description of the Collected Results
As stated in the previous subsections, the attacks dif-
fer in their kind and methodology. This results into
two distinct anomalies stated in Figure 6 and Figure
7. The latter scatter plot does not show the same dis-
tinct characteristics of two separated clusters, instead
they are almost identical and overlayed. The cluster-
ing for pattern recognition technique is not enough for
this kind of subtle anomalous behaviour.
Changing the perspective of evaluating the col-
lected data and considering also the data density of the
amount of network packages compared to the CPU
utilization, the anomalous behaviour becomes more
perceivable. Looking at the data in Table 1, for exam-
ple, there are parallels to the plot in Figure 6. For the
normal behaviour, CPU utilization never goes beyond
70% of usage, but rather stays below. Also, there is no
Table 2: Comparison of experienced attacker to normal life
cycle.
Normal Anomaly Normal Anomaly
CPU Packets in Packets in Packets out Packets out
30-40% 1928 6155 1506 4449
40-50% 603 4 487 3
50-60% 780 838 497 627
60-70% 320 1991 195 1825
70-80% n/a 199 n/a 114
data for 70-90% for the normal cases, which makes it
obvious to see the anomaly.
CLOSER 2018 - 8th International Conference on Cloud Computing and Services Science
554

On the other hand, in case of the experienced at-
tacker, the behaviour seems cautious, not raising an
suspicion for heavy CPU utilization, Table 2 offers
additional information to be able to detect anoma-
lies. Regarding the cases of 40-50% and 70-80% of
CPU utilization, for example, anomalies seem clear,
especially taking the collected network traffic into ac-
count. In a normal behaviour around 600 incom-
ing packages were counted and outgoing around 500
packages for 40-50% CPU usage while in the anoma-
lous case only received four packages and sent only
three packages.
Enough information to detect anomalies was
found between the collected data in Table 1 and in
the plot in Figure 7. Although it was not as simple
as to detect the anomaly in the inexperienced attack-
ers case. Using this statistical approach was helpful
to generate more precise information to detect and
expose anomalies from different kinds of attackers.
Further research is needed to tackle the problem of
finding a simple approach to unmask most anomalies
properly while generating minimal amount of false
positives.
6 CONCLUSIONS AND FURTHER
WORK
In this paper an overview of our anomaly detection
approach is given. Also, special requirements in Le-
gal Metrology are pointed out and the resulting secure
cloud reference architecture was briefly described.
Furthermore, an anomaly detection module applica-
tion is presented with promising results. This ap-
proach was tested against simulated attacks on the se-
cure cloud reference architecture, especially against
the legal metrology processing service. The lifecycle
of this service was described and tested against two
extreme cases of the assumed attacker model; the in-
experienced and experienced attacker.
It was shown that in this early stage, anomalies
caused by an inexperienced attacker, can be easily de-
tected by the AD-Module, by simple pattern recog-
nition of the clustering. Whereas, the experienced
attacker caused anomalies that can only be detected
aided by other statistical approaches, such as used
data density technique.
Further work will concentrate in finding more cor-
relations between metrics to detect more anomalies in
distributed environments. Part of this future work will
be evaluating more metrics in depth and creating a test
pipeline for automated testing and anomaly detection,
as well as to improve the statistical methods and eval-
uation. This will give us a better understanding of se-
cure cloud reference architecture behaviour to assess
a full risk analysis of the system.
REFERENCES
Barbhuiya, S., Papazachos, Z. C., Kilpatrick, P., and
Nikolopoulos, D. S. (2015). A lightweight tool for
anomaly detection in cloud data centres. In CLOSER,
pages 343–351.
BSI (2013). Technische Richtlinie BSI TR-03109-1 An-
forderungen an die Interoperabilit
¨
at der Kommunika-
tionseinheit eines intelligenten Messsystems. Bunde-
samt f
¨
ur Sicherheit in der Informationstechnik, Bonn.
European Parliament and Council (2014). Directive
2014/32/EU of the European Parliament and of the
Council. Official Journal of the European Union.
Gentry, C. et al. (2009). Fully homomorphic encryption
using ideal lattices. In STOC, volume 9, pages 169–
178.
Hansen, S. E. and Atkins, E. T. (1993). Automated sys-
tem monitoring and notification with swatch. In LISA,
volume 93, pages 145–152.
Jiang, M., Munawar, M. A., Reidemeister, T., and Ward,
P. A. (2009). System monitoring with metric-
correlation models: problems and solutions. In Pro-
ceedings of the 6th international conference on Auto-
nomic computing, pages 13–22. ACM.
Kang, H., Chen, H., and Jiang, G. (2010). Peerwatch: a fault
detection and diagnosis tool for virtualized consolida-
tion systems. In Proceedings of the 7th international
conference on Autonomic computing, pages 119–128.
ACM.
Lou, J.-G., Fu, Q., Yang, S., Xu, Y., and Li, J. (2010). Min-
ing invariants from console logs for system problem
detection. In USENIX Annual Technical Conference.
Marhas, M. K., Bhange, A., and Ajankar, P. (2012).
Anomaly detection in network traffic: A statistical ap-
proach. International Journal of IT, Engineering and
Applied Sciences Research (IJIEASR), 1(3):16–20.
Oppermann, A., Seifert, J.-P., and Thiel, F. (2016). Se-
cure cloud reference architectures for measuring in-
struments under legal control. In CLOSER (1), pages
289–294.
Oppermann, A., Yurchenko, A., Esche, M., and Seifert, J.-P.
(2017). Secure cloud computing: Multithreaded fully
homomorphic encryption for legal metrology. In In-
ternational Conference on Intelligent, Secure, and De-
pendable Systems in Distributed and Cloud Environ-
ments, pages 35–54. Springer.
Prewett, J. E. (2003). Analyzing cluster log files using log-
surfer. In Proceedings of the 4th Annual Conference
on Linux Clusters.
Richardson, C. (2011). Pattern: Microservice
chassis. Dosegljivo: http://microservices.
io/patterns/microservice-chassis. html.[Dostopano
11. 7. 2016].
Anomaly Detection Approaches for Secure Cloud Reference Architectures in Legal Metrology
555

Rouillard, J. P. (2004). Real-time log file analysis using
the simple event correlator (sec). In LISA, volume 4,
pages 133–150.
Sari, A. (2015). A review of anomaly detection systems in
cloud networks and survey of cloud security measures
in cloud storage applications. Journal of Information
Security, 6(02):142.
Song, X., Wu, M., Jermaine, C., and Ranka, S. (2007).
Conditional anomaly detection. IEEE Transactions on
Knowledge and Data Engineering, 19(5).
Tan, J., Kavulya, S., Gandhi, R., and Narasimhan, P.
(2012). Light-weight black-box failure detection for
distributed systems. In Proceedings of the 2012 work-
shop on Management of big data systems, pages 13–
18. ACM.
Wang, C. (2009). Ebat: online methods for detecting utility
cloud anomalies. In Proceedings of the 6th Middle-
ware Doctoral Symposium, page 4. ACM.
Ward, J. S. and Barker, A. (2013). Varanus: In situ monitor-
ing for large scale cloud systems. In Cloud Computing
Technology and Science (CloudCom), 2013 IEEE 5th
International Conference on, volume 2, pages 341–
344. IEEE.
WG7 (2012). Welmec 7.2 issue 5 software guide. WELMEC
Euro- pean cooperation in legal metrology.
Xu, W., Huang, L., Fox, A., Patterson, D., and Jordan,
M. I. (2009). Detecting large-scale system problems
by mining console logs. In Proceedings of the ACM
SIGOPS 22nd symposium on Operating systems prin-
ciples, pages 117–132. ACM.
CLOSER 2018 - 8th International Conference on Cloud Computing and Services Science
556
