
Learning Analytics for Interpreting
Davide Taibi
1
, Francesca Bianchi
2
, Philipp Kemkes
3
and Ivana Marenzi
3
1
Institute for Educational Technology, National Research Council of Italy, Palermo, Italy
2
University of Salento, Lecce, Italy
3
L3S Research Center, Hannover, Germany
Keywords:
Technical Vocabulary for Interpreting, Glossary, Learning Analytics Dashboard.
Abstract:
An important activity in the life of interpreters is terminology work. A primary method for learning technical
vocabulary is the creation of personal glossaries. The current paper describes the design and creation of a
system that guides the students in autonomous vocabulary work, supports the students’ learning progress,
and helps the teacher in monitoring the student commitment to and achievements in the creation of personal
glossaries. The system includes a tool for the creation of glossaries, a tracking system that records the students’
actions and the websites they visit while searching the Web for linguistic and content information, and a
learning analytics dashboard. The system was tested on a class of 34 university students training in interpreting
and the paper reports some preliminary results.
1 INTRODUCTION
Interpreter training is a challenging task, especially in
academic institutions, where teachers are required to
train perspective interpreters in a wide range of cog-
nitive, linguistic and practical skills (e.g. P
¨
ochhacker,
2003; Gile, 2009) in a short period of time and of-
ten with fairly large classes. One of the skills that
interpreters need to master is the ability to expand
their vocabulary and content knowledge in technical
areas. A primary and largely used method for ac-
quiring technical vocabulary is the creation of per-
sonal glossaries. Creating glossaries not only favours
terminology acquisition (AIIC, 1999), but is also a
way to learn something about the topic itself (Gile,
2002), content knowledge being a fundamental re-
quirement for the interpreter in all interpreting events
(e.g. Moser, 1978; Seleskovitch, 1978). A range of
existing software programs can be used for creating
glossaries, from MS Word or MS Excel (e.g. Fons i
Fleming, 2009; Jiang, 2015), to programs specifically
developed by or for interpreters and translators, such
as Interplex
1
, Lookup
2
, and SDL Multiterm
3
. None
of these tools was created for teaching purposes or in-
tegrates a learning analytics system.
1
http://www.fourwillows.com/interplex.html
2
http://www.traductorado.edu.ar/lookup/
3
http://www.sdl.com/it/solution/language/terminology-
management/multiterm/
Within a wider study aiming to provide teachers of
interpreting with an integrated system that may sup-
port them in their teaching needs, the current paper
focuses on vocabulary searches and glossary creation,
and describes a recent release of the LearnWeb en-
vironment integrating a tool that guides students in
the creation of personal glossaries in keeping with the
steps and needs advocated and/or described in the lit-
erature on interpreting (AIIC, 1999; Gile, 2002; Set-
ton, 2010; Fons i Fleming, 2009; Jiang, 2015). The
system also keeps track of the students’ activities in
the glossary, as well as of their searches on the Web,
and provides a dashboard to monitor the student’s ac-
tivities. This system aims not only to support the stu-
dents in the creation of glossaries, but also to help
the teachers monitor the students’ approaches to this
particular task and provide individual remedial feed-
back, if necessary. This paper provides a technical de-
scription of the environment in which the current tools
have been integrated (Section 2) and of the newly de-
veloped features (Section 3). As the system was tested
with a group of university students specialising in in-
terpreting, the paper also briefly describes this exper-
imentation and reports some students’ comments on
the advantages and limitations of the current version
of the system (Section 4). Finally, some conclusions
are offered on the current experiment, and on future
developments of the system (Section 5).
Taibi, D., Bianchi, F., Kemkes, P. and Marenzi, I.
Learning Analytics for Interpreting.
DOI: 10.5220/0006774801450154
In Proceedings of the 10th International Conference on Computer Supported Education (CSEDU 2018), pages 145-154
ISBN: 978-989-758-291-2
Copyright
c
2019 by SCITEPRESS – Science and Technology Publications, Lda. All rights reserved
145

2 THE ENVIRONMENT:
LEARNWEB
LearnWeb is a learning and competence development
environment that allows users to share and collabora-
tively work on resources collected from the Web or
user-generated (Marenzi and Zerr, 2012). It provides
users with a search interface for retrieving and shar-
ing resources across various Web 2.0 services, such as
YouTube, Flickr, Ipernity, Vimeo, and Bing, as well
as LearnWeb itself, and can offer a personal Web 2.0
learning space. The system has been continuously de-
veloped at the L3S research center in Hannover, in or-
der to provide a customized environment that supports
learners and educators in sharing, discovering, and
managing learning resources. The platform is charac-
terised by an iterative evaluation-driven design-based
research approach (Marenzi, 2014), i.e. an approach
in which researchers and practitioners collaborate in
real-world settings to cyclically assess and improve
the functionalities of a system (Wang and Hannafin,
2005), tailoring them to the practitioners’ needs. The
current release of the system provides several innova-
tive features designed to support teachers and students
in individual and collaborative learning tasks. These
features include:
1. a personal learning space offering a seamless
overview of the entire set of learning resources
distributed across various Web 2.0 repositories;
2. searching, sharing and aggregation of different
learning resources;
3. annotation facilities, such as tagging and com-
menting, that can help users to discuss and select
the most relevant resources for their task;
4. Website archiving;
5. creative production of new meanings (collabora-
tive writing with GoogleDocs; collaborative pre-
sentation of learning outcomes with the Presenta-
tion Editor);
6. specific functionalities to support educational ac-
tivities, such as TED talk transcripts annotation
(Taibi et al., 2015);
7. automatic logging of the students’ actions.
The current release also includes features specifically
designed and developed to support the learning ac-
tivities of students attending a course on interpret-
ing. These features include a tool for the creation
of glossaries, a tracking system for logging the stu-
dents’ searches on the Web, and a learning analytics
system aimed at improving the efficacy and effective-
ness of the processes involved in the creation of per-
sonal glossaries. These features are described in the
following sections.
3 DEVELOPING THE GLOSSARY
STRUCTURE AND INTERFACE
3.1 Rationale and Structure
The Glossary tool was specifically designed to meet
the needs of students of interpreting. The glossary
structure was inspired by scientific literature on inter-
preting (AIIC, 1999; Gile, 2002; Setton, 2010; Fons i
Fleming, 2009; Jiang, 2015), and is described below.
In LearnWeb, a glossary is a database and is consid-
ered by the system as a type of resource, on a par with
images, videos and text files. A glossary may host
a potentially infinite number of entries. Each entry
is composed of at least two terms: the source term
and its translation into the target language. Synonyms
in the source or target language may be added to a
given entry
4
. Thus, depending on the presence of syn-
onyms, each glossary entry will include two or more
terms. Each term in a glossary entry is accompanied
by a series of attributes, corresponding to given fields
in the glossary interface; these enrich the description
of the term with optional data. Currently, the glos-
sary is set for the English-Italian language pair, but
the interface can be easily adjusted for other language
pairs.
Figure 1 shows the glossary interface for entering
a new entry. Figure 2 shows a few glossary entries
from a student’s glossary.
Of the given fields, four are compulsory:
• Topic 1, where the student is invited to select the
general topic under which to classify the given
terms, by selecting from a dropdown menu; in the
current experiment, only one topic was provided:
Medicine.
• Description, where the students are invited to en-
ter a short definition or description of the concept
that is linguistically realized by the given terms.
This field plays multiple roles in the glossary ra-
tionale: 1. it is a way to draw the student’s at-
tention to the meaning of the terms, rather than
the terms themselves; 2. it can be used to retrieve
specific terms even when one does not remember
them; this field in fact is a searchable text box;
3. from a technical point of view, the Descrip-
tion field is the element that keeps the source and
4
Synonyms are frequent in technical and scientific lan-
guage, as pointed out for example by Rogers (2007).
CSEDU 2018 - 10th International Conference on Computer Supported Education
146
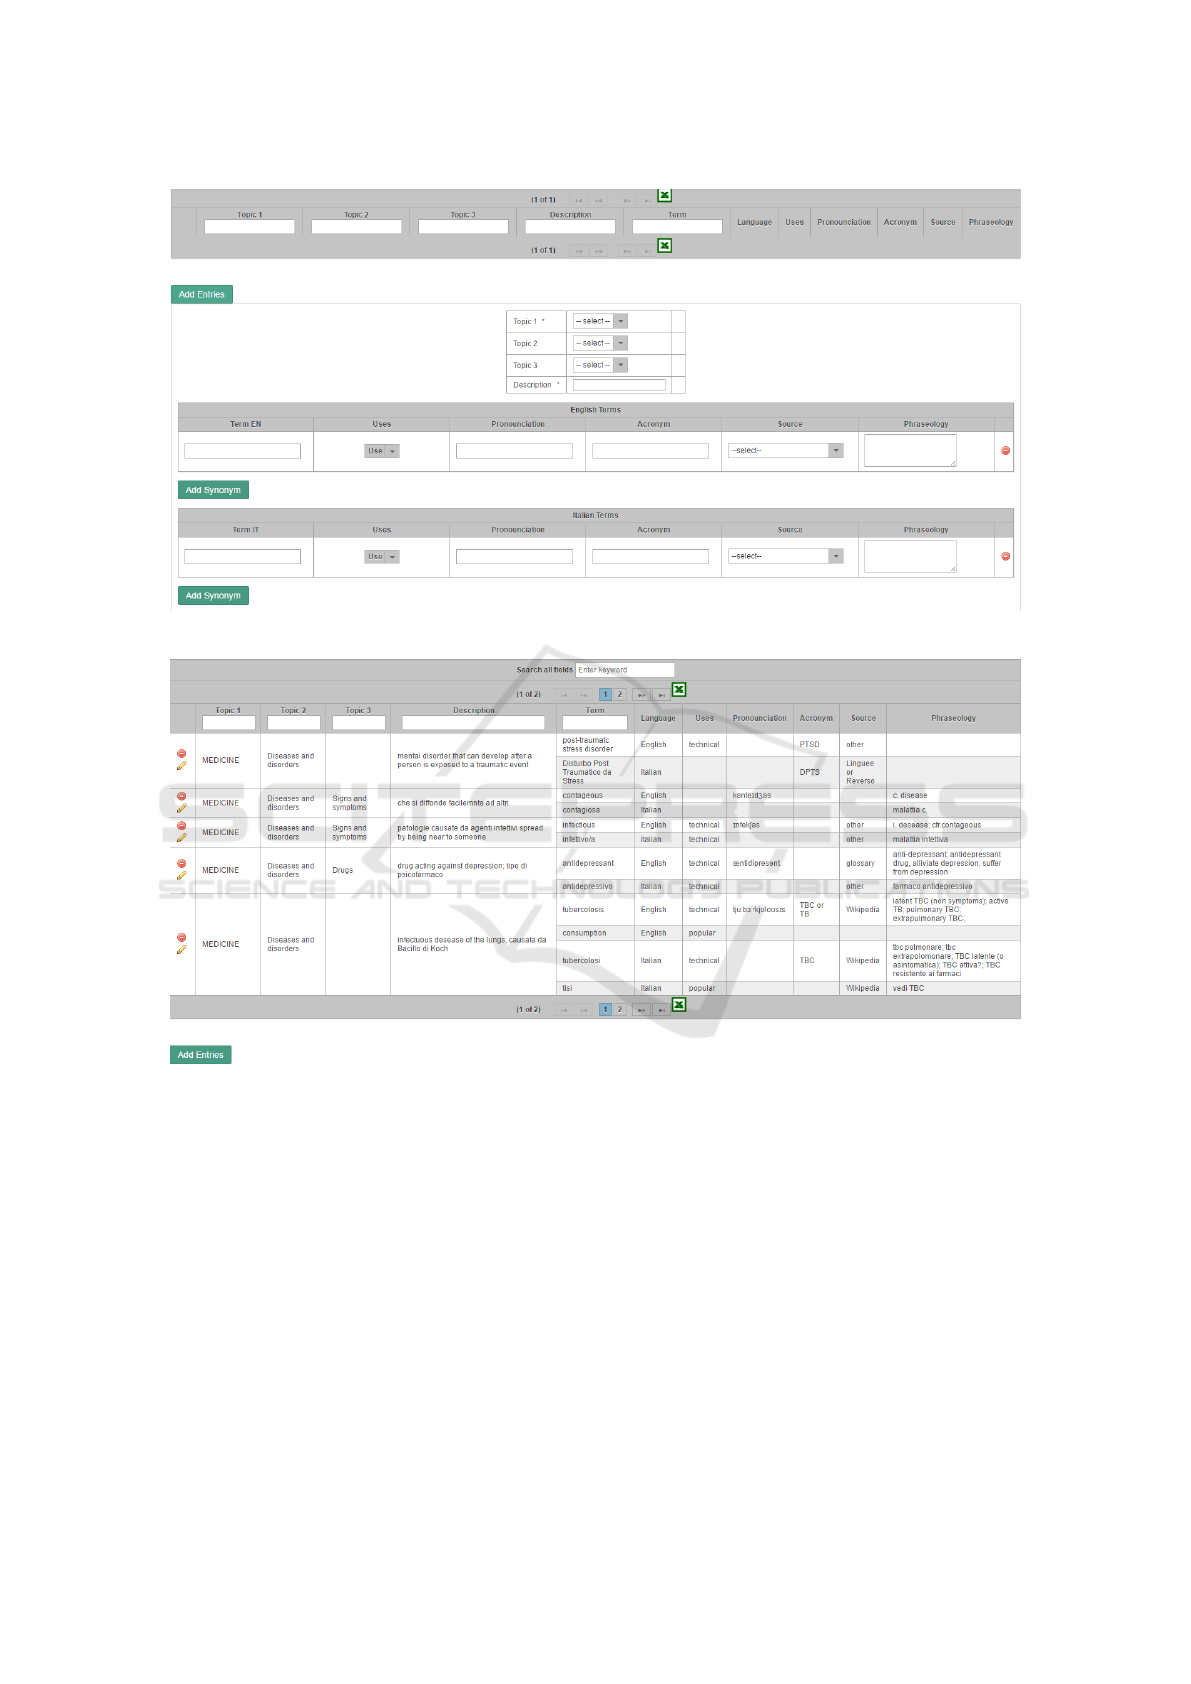
Figure 1: Glossary interface.
Figure 2: Example of student glossary.
target terms, their synonyms and all the other at-
tributes together to form a single entry.
• Term EN, where the student will enter the English
term.
• Term IT, where the student will enter the Italian
term.
These four pieces of information were thought
to represent the minimum amount of information to
make up a glossary. The four fields can be filled in in
any order, but the system will not save the entry if any
of them is empty. All the other fields are optional,
but each of them was included in the glossary inter-
face for a specific reason. Fields Topic 2 and Topic
3 are meant to help the student to classify the entries
according to a logical and functional ontology. In the
current experiment, the students were guided in the
selection of Topic 2 by means of a dropdown menu
containing the following options, inspired by the con-
tents of the module where the experimentation would
take place: Anatomy; Diseases and disorders; Food
and Nutrition; Medical branches; Institutions; Profes-
sions; Other. Topic 3, on the other hand, was an open
text box. These fields and menus can be customised
to the teachers’ needs, upon request. The fields Pro-
nunciation, Acronym and Phraseology are simple text
Learning Analytics for Interpreting
147

boxes which accept any type of characters, including
IPA (International Phonetic Alphabet) ones. The size
of the Phraseology field in the database automatically
adjusts to the contents entered into the Phraseology
box. This allows the students to use this box freely
to enter as many collocations and colligations as they
want, but - if necessary - to also enter other pieces
of information which have no specific place in the
glossary interface, such as part-of-speech informa-
tion, links to online images and much more. Finally,
the Uses and Sources fields are dropdown menus. The
Uses menu includes three options (Technical, Popu-
lar, and Informal), and is meant to draw the student’s
attention to linguistic register; there is also the pos-
sibility to select all the three options at once. The
Sources menu invites the student to specify the pri-
mary source of information used to fill in the glossary
fields and includes the following options: Wikipedia;
encyclopaedia; monolingual dictionary; bilingual dic-
tionary; glossary; scientific/academic publication; in-
stitutional website; Linguee or Reverso; patients’
websites and blogs; other. This field may seem redun-
dant, given that an automatic tracking feature logs all
the students Web searches (Section 3.3). However, it
was considered important to make the students think
about the type of source(s) they use. Furthermore, it
may happen that a student’s searches are not tracked
because of the student working outside the proxy ser-
vice, of his refusing to be tracked, or of other tech-
nical problems. Finally, at any time the student can
delete an existing entry or term by clicking on the red
round icon in Figures 1 and 2, or he can modify an
existing entry by clicking on the pencil icon in Figure
2. Each student can create one or more glossaries, and
each glossary may include a potentially infinite num-
ber of entries, i.e. of glossary items. For this reason,
search features have also been integrated into the sys-
tem. The student can filter the glossary by topic, or
retrieve a given term by searching for key terms in the
description field or by entering the term itself. Fur-
thermore, the ‘Search all fields’ box allows students
to perform text searches in all the glossary fields, thus
making it possible, for example, to retrieve all tech-
nical terms, English terms only, or specific phrases
entered in the Phraseology field. The entire glossary
as well as the filtered results can also be downloaded
in Excel format (by clicking on the Excel icon) and
printed out, if necessary. LearnWeb glossaries can be
filled in and consulted bi-directionally (e.g. from En-
glish into Italian and viceversa). Furthermore, glos-
saries can be personal and/or collaborative and can be
shared with other students/users. In the current exper-
iment, however, the glossaries were created individu-
ally and were not shared.
3.2 Tracking Data for the Dashboard:
The Logs and the Proxy
Dumais et al. (2014) give a comprehensive overview
of behavioral log data and analysis in HCI. As they
point out, “an important characteristic of log data
is that it captures actual user behavior and not re-
called behaviors or subjective impressions of inter-
actions” (p. 350). Indirect observation methodolo-
gies like questionnaires rely on the self-evaluation of
students and may not reflect the actual work done
by the learners. On the other hand, behavioral ob-
servations are increasingly captured at a much larger
scale and can be collected in situ on a client machine
or on remote servers as people interact with appli-
cations, systems, and services. Many studies have
already used log data to analyse learning activities
(Mazza and Dimitrova, 2004; Zhang and Almeroth,
2010; Mazza et al., 2012). Most of these works utilize
only the inbuilt logging facilities of tools like Moo-
dle or WebCT. But many language learning tasks re-
quire students to search for information on websites
outside the tool used in the course. These external
actions cannot be logged by course management sys-
tems such as Moodle. Ceddia et al. (2007) used the
Weblog Analysis Tool (WAT) application to analyse
at activity level the log file data of learners’ interac-
tions collected within a Web-based learning environ-
ment (a courseware website) in order to gain infor-
mation about the tasks that the learners had engaged
in, and to determine the achievement of educational
objectives.
The study by P
´
erez-Paredes et al. (2011) goes be-
yond this and uses the log files of a proxy server
to analyze which websites students visited to ful-
fil their task. But this requires a controlled envi-
ronment, like a classroom, where the course man-
ager can fully control the Internet access or has the
privilege to install logging software on the students’
computers. Other studies have used screen-capturing
software like Camtasia or Adobe Connect to record
students’ learning activities (Bortoluzzi and Marenzi,
2017). But these recordings have to be analyzed man-
ually, thus the number of subjects is limited by the
number of evaluators. Such a method can also be con-
sidered more obtrusive than server side logging.
We have developed a novel tracking framework
that allows researchers to track all pages a student
views during a learning session without requiring
changes on the student’s computer. Our system
tracks also external websites, such as Wikipedia.org
or Google.com. Furthermore, it is not limited to class-
room use, so students can access it from home and use
online resources as they normally would. This makes
CSEDU 2018 - 10th International Conference on Computer Supported Education
148

Figure 3: List of all the pages viewed by a user.
Figure 4: Playback view.
our system very unobtrusive compared to previous ap-
proaches. Furthermore, we track mouse movements
and keyboard input by users, to detect when they ac-
tively interact with a web page. Previous studies did
at most take into account how long a user stayed on
a website. To this end, they often used a very rough
guess, like the timespan between two subsequent web
requests. Such a simple measure cannot recognize in-
active times (for example when the user has left the
computer to get a cup of tea). We call our system Web
Analytics Proxy Service and we make it available to
other researchers under the domain www.waps.io.
3.3 Tracking Users’ Actions
Proxy servers generally create logs that contain sim-
ple information, such as the browser model, the URL
and the date when a specific website was visited by a
user. Many of the aforementioned studies are based
on such data. In order to gather more fine-grained
information, we use JavaScript to record all input ac-
tions made by the users. This includes mouse move-
ment, scrolling, clicking and typing. We also record
when the browser window loses the focus. This hap-
pens when the user switches to another browser tab or
puts the whole browser window into background. For
each input action we record the time and the position
on the page.
To limit the log size and the transferred data, we
record up to 3 mouse positions per second while
the mouse is moved. The log data is accumulated
into batches and sent asynchronously to our tracking
server; this way the browsing experience is not influ-
enced by the tracker. This data is used to calculate
Learning Analytics for Interpreting
149

how active a user was on a page. To this end, we treat
all subsequent actions within a sliding window of 5
seconds as one continuous action and assume that the
user was active during the whole time-span between
the first and last action.
The interface shows all the pages viewed by the
user in chronological order (Figure 3). In this par-
ticular case, the user first searched for “small intes-
tine” on the LearnWeb platform. Next he opened
www.linguee.com and searched for the Spanish and
Italian translations of this term. Afterwards he re-
turned to LearnWeb and added his findings to his
glossary. Finally, he opened a Wikipedia article.
For each log entry the system can show statis-
tics, including how much time the user spent on the
specific site and how long he was active (moved the
mouse, scrolled, clicked or typed). It has also the op-
tion to “playback” the user’s actions (Figure 4).
For this purpose, the system displays the page at
exactly the same window size the user viewed it; fur-
thermore, it can also visualize the mouse movements
recorded. At the top, a timeline is displayed show-
ing when the user was active during his session on
that page. Yellow indicates that the user moved the
mouse, and red that he scrolled or clicked. This time-
line is shown only to developers and researchers, not
to students.
3.4 The Dashboard
The dashboard is a graphic and interactive repre-
sentation of the students’ data, based on a selection
of log data from the glossary activities. The data
were specifically selected to monitor the following: 1.
General activity on the glossary task: the dashboard
shows general information about the students’ activi-
ties (e.g. periods of activity/inactivity; Figure 5), the
number of glossary items entered and the number and
types of sources (Figure 6); 2. Ability to organize the
glossary: the dashboard provides information about
whether, to what extent, and how the student com-
pleted the compulsory fields and the optional fields;
this includes summary and percentage data about the
number and types of fields filled in, a list of the de-
scriptions entered and their lengths (Figure 8), and the
language used in the description field; 3. Ability to
search the Web for information: the dashboard shows
the preferred sources of reference as declared by the
student (glossary field Source; Figures 6, 7), as well
as a list of all the web addresses that were actually
opened and tracked by the proxy.
We currently offer a teacher dashboard, and a stu-
dent dashboard. The teacher dashboard opens on a
general view of the group, with particular attention to
the activities on the glossary (Figure 5) and their pri-
mary sources of information (Figure 6). The teacher
can then zoom in on individual students, by clicking
on the student ID, and access similar views of the stu-
dent activities, as well as views of the student’s ability
to organize the glossary, and of his ability to search
the Web for information (Figure 7). The teacher can
select a given period of time, and all graphs and ta-
bles will be updated accordingly. Furthermore, she
can filter out specific students from the general group.
The student dashboard provides a range of views of
the data. It has been designed to allow individual stu-
dents to view their standing and progress with respect
to the group’s average. In the example in Figure 8,
small symbols in red, green and yellow indicate re-
spectively if the student progress is under, over or
equal to the average of the whole group. These sym-
bols are used not as forms of assessment of a student’s
learning progress, but as mere indications of the stu-
dent’s relative status as regards the task.
4 USE OF THE GLOSSARY TOOL
From 2 March 2017 to 30 May 2017, the Learn-
Web Glossary tool was used at the University of
Salento (Lecce, Italy) in an MA module training stu-
dents in consecutive interpreting without notes for the
English-Italian language pair. The module focused on
medical language. The class included 34 students;
of these, 32 were Italian native speakers; 1 was an
Italian-German bilingual, and 1 was an Erasmus stu-
dent from Poland with B2 level Italian. As regards
English, they were all B2+ or above.
The students were introduced to the use of the
Glossary tool in LearnWeb and instructed to cre-
ate personal medical glossaries. From the very be-
ginning, the students were informed that the system
would track all their actions, as well as all the web-
sites they visited; and they were asked for permission.
No one denied permission.
The first few items of the glossary were to be taken
from a specific TED talk on medicine, suggested by
the teacher, and from other material used in class.
This was meant to provide the students with a con-
crete starting point for the identification of possible
candidates for their glossaries. After a couple of hours
during which each student created a personal glossary
and worked on it in class, the students were invited to
continue building up their glossaries from home, as
part of their individual preparation for the final exam.
After 20 days, the students were presented with a
short questionnaire in order to collect data about the
user-friendliness of the platform (9-point Likert scales
CSEDU 2018 - 10th International Conference on Computer Supported Education
150
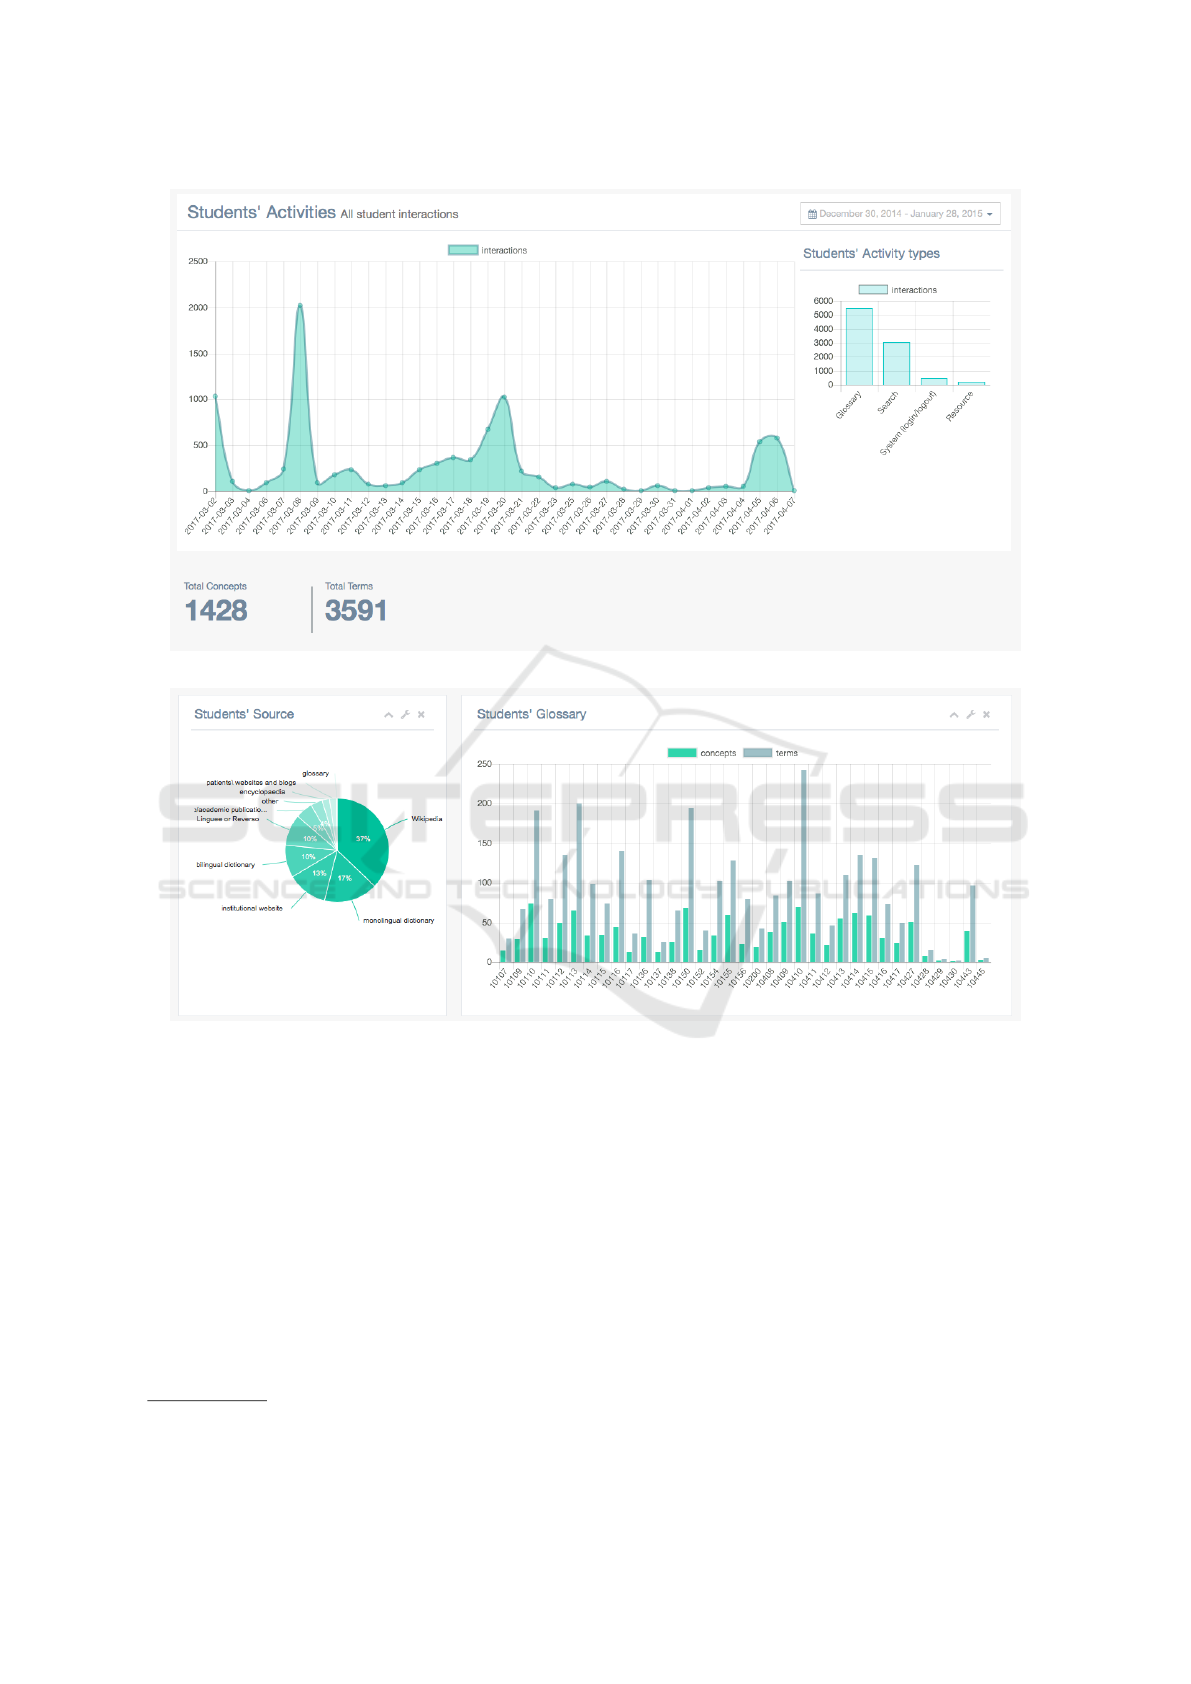
Figure 5: Teacher dashboard - Class view of the students’ activities.
Figure 6: Teacher dashboard - Class view of the students’ source of information.
measuring 7 dimensions) and of the Glossary tool (9-
point Likert scales measuring 3 dimensions, including
the research-by-proxy tracking feature). The ques-
tionnaire also invited the students to freely indicate
negative and positive aspects of the Glossary, and to
add further comments. The questionnaire was created
using Limesurvey and was filled in online by the stu-
dents
5
. The results of the students’ answers are sum-
marized in Section 4.2.
5
The template is available at:
http://194.119.209.93:8088/limesurvey2/index.php/148734
4.1 Using the Dashboard to Provide
Personalized Feedback
Throughout the course, the teacher monitored the stu-
dents’ activities through the dashboard, and about
four weeks after the students started to build the glos-
saries she had collected enough data to be able to
give personalized feedback to the students. In par-
ticular, the dashboard showed that a few students
were systematically underusing the Phraseology sec-
tion and/or resorting primarily or almost exclusively
to dictionaries as reference resources for the glos-
sary entries. Furthermore, not all students showed the
same level of commitment to the task, measured by
balancing several indicators, including overall num-
ber of fields filled in, number of entries, and number
Learning Analytics for Interpreting
151
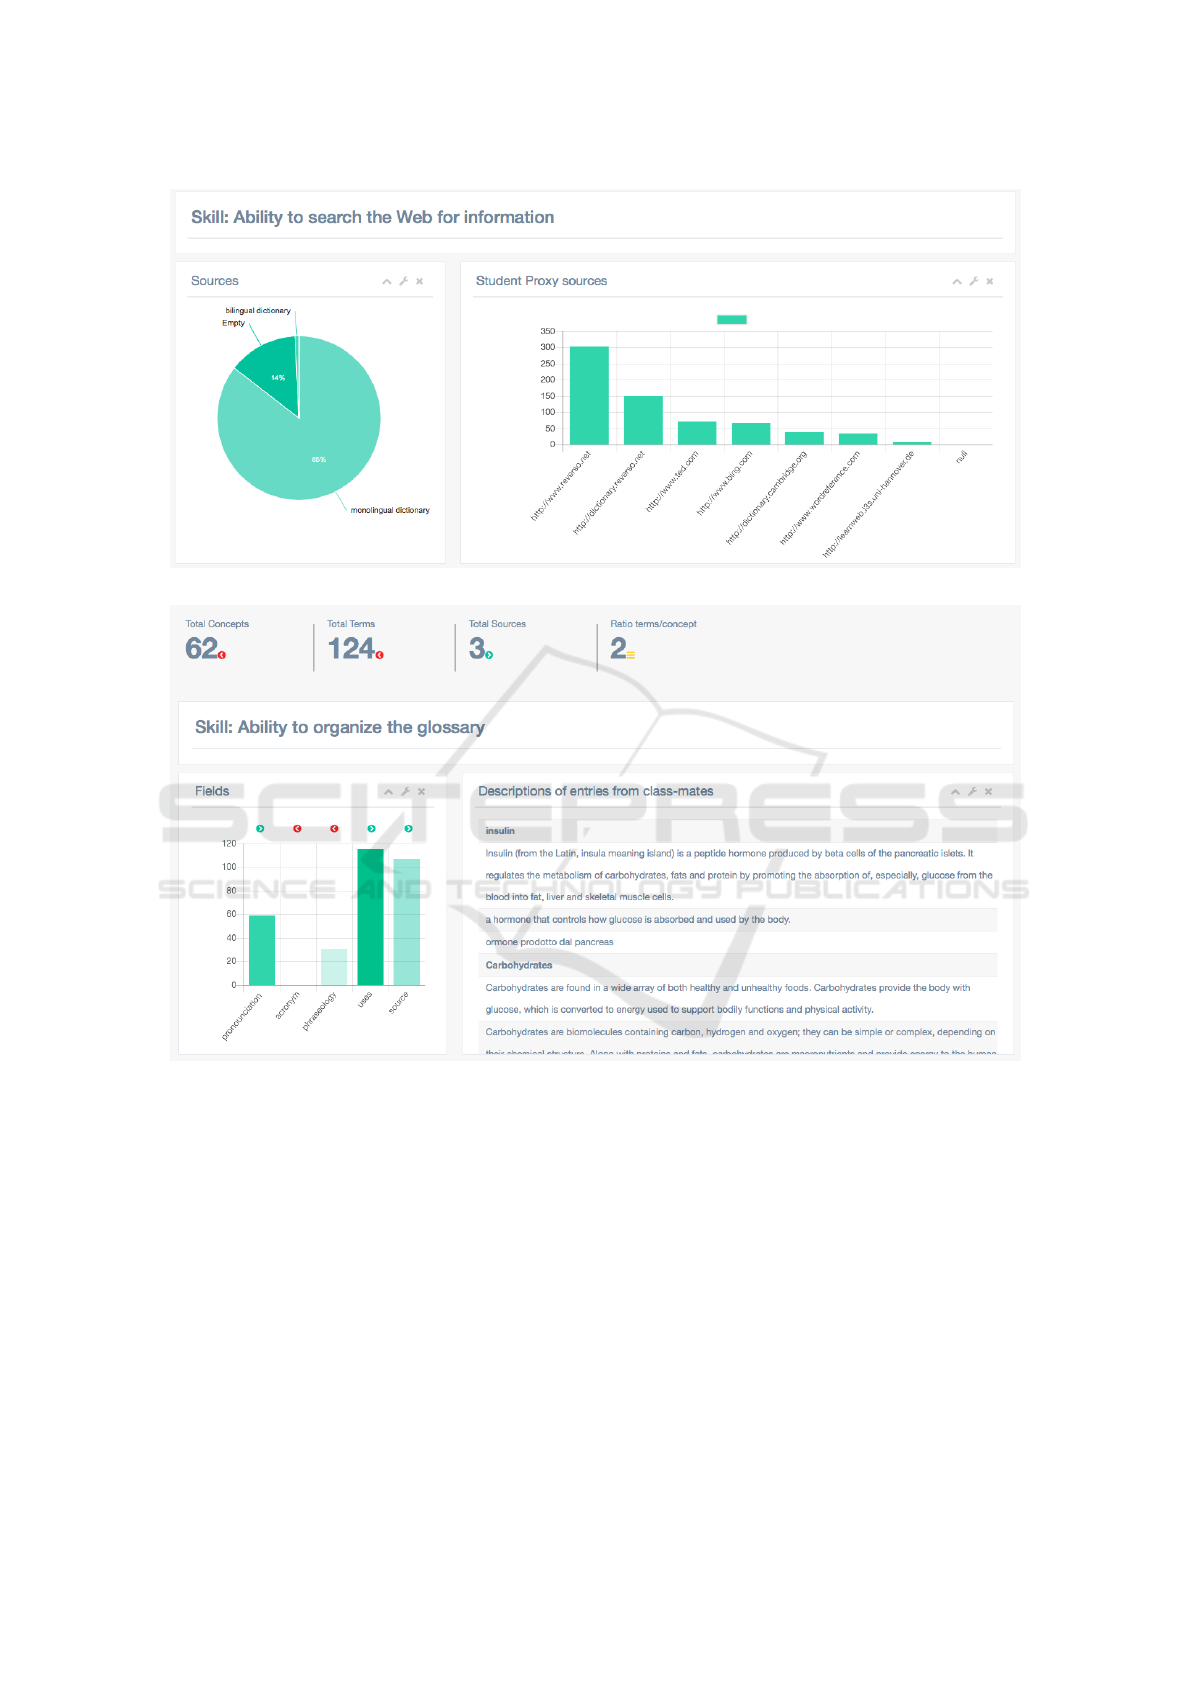
Figure 7: Teacher dashboard - View of a student’s ability to search the Web for information.
Figure 8: Student dashboard - Extract.
and variety of sources consulted. Personalized feed-
back was given by talking individually to the students
in need and gradually guiding them to understanding
the importance of the fields or types of resources they
were disregarding. In the weeks after personalized
feedback was given, the dashboard registered change
in the behaviours of those particular students.
4.2 Using the Student Feedback to
Further Develop the System
According to the data collected with the question-
naires, the glossary user-friendliness was rated fairly
high. On a 9-point scale, the average rate was 8 as
regards the easiness to create a new glossary, and 7.5
as regards the easiness to fill in the glossary. Slightly
lower (6.5), but still positive, is the average rate of the
easiness of searching the Web without exiting from
LearnWeb. The platform in general scored on aver-
age around 7 in all the dimensions; these were: ter-
rible/wonderful; difficult/easy; frustrating/satisfying;
inadequate power/adequate power; dull/stimulating;
rigid/flexible.
All in all, the platform and the Glossary tool seem
to have been appreciated. The students’ feedback to
our request to list three positive features did not show
a dominant response, but rather clarified that all the
existing features were appreciated, by one or another
CSEDU 2018 - 10th International Conference on Computer Supported Education
152

student, and that the system had stimulated the stu-
dents to create and expand their glossaries.
Finally, manual analysis of the students’ lists of
negative points and comments suggest integrating the
following features into future releases of the glossary:
1. Adding a field for images.
2. Allowing the creation of glossaries on topics other
than medicine.
3. Adding a third language to the glossary, thus mak-
ing it multilingual, rather than bilingual.
4. Adding the possibility to order glossary terms al-
phabetically.
5. Adding an explicit indication of the number of en-
tries in the glossary.
Features 1, 2, and 3 had already been planned by the
authors of this paper, but could not be implemented
before the beginning of the experiment due to time
constraints. These will be considered in future re-
leases of the Glossary, along with the other points
suggested by the students.
5 CONCLUSIONS
The current paper has described the development and
integration of a system for the creation and man-
agement of bilingual glossaries into an existing e-
learning environment (LearnWeb). This system in-
cludes automatic tracking of the students’ actions in
the glossary, automatic tracking of their searches in
the Web while working on the glossary, and a dash-
board that analyses the student’s interaction with the
glossary and displays the results in graphic format for
the benefit of both teachers and students. The glos-
sary and the dashboard were specifically developed to
support students in the creation of glossaries, and to
help teachers monitor the students’ approaches to this
particular task and provide individual remedial feed-
back, if necessary.
The system proved user-friendly and highly use-
ful. The Glossary interface stimulated the students to
create and expand a personal medical glossary. The
teacher dashboard helped the teacher to monitor the
student commitment to the study of vocabulary, their
understanding of the importance of content and con-
text information, and their Web search strategies; fur-
thermore, it guided the teacher in identifying students
in need and in providing personalized remedial feed-
back. The student dashboard could not be tested in
this experiment. The proxy system provided useful
information about the students’ searches on the Web.
From a research perspective, our experiment has
analysed only part of the data tracked and logged by
the system. The next steps in the research will in-
clude: analysing the time spent by students filling in
the glossary and the time spent searching the Web for
information, at different times during the experiment;
analysing the type of data the students entered in the
Phraseology field; and outlining different profiles of
student behaviour by means of cluster analysis tech-
niques. These analyses should provide greater insight
into student approaches to the creation of glossaries.
Finally, further extensions of this project are being en-
visaged and they include: 1. correlating glossary data
to students’ exam results; for this purpose, however,
data from a much wider number of students should be
collected; and 2. asking professional interpreters to
use our system and comparing their data to students’
data.
ACKNOWLEDGEMENTS
The LearnWeb team.
The students in Lecce.
REFERENCES
AIIC (1999). Practical guide for professional conference in-
terpreters. aiic.net. December 1, 1999. Accessed April
2, 2017. http://aiic.net/p/628.
Bortoluzzi, M. and Marenzi, I. (2017). Web searches for
learning. how language teachers search for online re-
sources. Lingue and Linguaggi, 23:21–36.
Ceddia, J., Sheard, J., and Tibbey, G. (2007). Wat: A tool
for classifying learning activities from a log file. In
Proceedings of the Ninth Australasian Conference on
Computing Education - Volume 66, ACE ’07, pages
11–17, Darlinghurst, Australia, Australia. Australian
Computer Society, Inc.
Dumais, S., Jeffries, R., Russell, D. M., Tang, D., and Tee-
van, J. (2014). Understanding user behavior through
log data and analysis. In Ways of Knowing in HCI,
pages 349–372. Springer.
Fons i Fleming, M. (2009). Do your glossaries excel?
aiic.net, September 14, 2009. Accessed August 31,
2017. http://aiic.net/p/3315.
Gile, D. (2002). The interpreter’s preparation for technical
conferences: methodological questions in investigat-
ing the topic. Conference Interpretation and Transla-
tion, 4(2):7–27.
Gile, D. (2009). Basic concepts and models for inter-
preter and translator training, volume 8. Amster-
dam/Philadelphia: Benjamins.
Jiang, H. (2015). A survey of glossary practice of confer-
ence interpreters. aiic.net, April 21, 2015. Accessed
March 31, 2017. http://aiic.net/p/7151.
Learning Analytics for Interpreting
153

Marenzi, I. (2014). Interactive and collaborative supports
for clil: towards a formal model based on digital
literacy. Content and Language Integrated Learn-
ing (CLIL) by Interaction. Frankfurt am Main: Peter
Lang, pages 75–99.
Marenzi, I. and Zerr, S. (2012). Multiliteracies and ac-
tive learning in clil - the development of learnweb
2. 0. IEEE Transactions on Learning Technologies,
5(4):336–348.
Mazza, R., Bettoni, M., Far
´
e, M., and Mazzola, L. (2012).
Moclog–monitoring online courses with log data. In
In S. Retalis, M. Dougiamas (Eds.), Proceedings of
the 1st Moodle Research Conference.
Mazza, R. and Dimitrova, V. (2004). Visualising student
tracking data to support instructors in web-based dis-
tance education. In Proceedings of the 13th interna-
tional World Wide Web conference on Alternate track
papers & posters, pages 154–161. ACM.
Moser, B. (1978). Simultaneous interpretation: A hypo-
thetical model and its practical application. In Lan-
guage interpretation and communication, pages 353–
368. Springer.
P
´
erez-Paredes, P., S
´
anchez-Tornel, M., Alcaraz Calero,
J. M., and Jim
´
enez, P. A. (2011). Tracking learners’
actual uses of corpora: guided vs non-guided corpus
consultation. Computer Assisted Language Learning,
24(3):233–253.
P
¨
ochhacker, F. (2003). Introducing interpreting studies.
Routledge.
Rogers, M. (2007). Terminological equivalence: Probabil-
ity and consistency. LSP Translation Scenarios, pages
101–106.
Seleskovitch, D. (1978). Interpreting for international con-
ferences: Problems of language and communication.
Pen and Booth.
Setton, R. (2010). From practice to theory and back in inter-
preting: the pivotal role of training. The Interpreters’
Newsletter, (15):1–18.
Taibi, D., Chawla, S., Dietze, S., Marenzi, I., and Fetahu,
B. (2015). Exploring ted talks as linked data for ed-
ucation. British Journal of Educational Technology,
46(5):1092–1096.
Wang, F. and Hannafin, M. J. (2005). Design-based
research and technology-enhanced learning environ-
ments. Educational technology research and develop-
ment, 53(4):5–23.
Zhang, H. and Almeroth, K. (2010). Moodog: Tracking
student activity in online course management systems.
Journal of Interactive Learning Research, 21(3):407–
429.
CSEDU 2018 - 10th International Conference on Computer Supported Education
154
