
Infrared Depth Camera System for Real-time European Lobster
Behavior Analysis
Sheng Yan and Jo Arve Alfredsen
Department of Engineering Cybernetics, Norwegian University of Science and Technology, Norway
Keywords:
Infrared Depth Camera, Behavior Analysis, European Lobster, Animal Tracking.
Abstract:
European lobster is a highly treasured seafood, but aquaculture production based on traditional communal
rearing practices has proved challenging for this species due to its inherent agonistic behavior. This paper
presents a novel computer vision system that is designed for analysis of lobster behavior and can serve as a
tool to assist selection of breeding stock in a prospective selective breeding program for European lobster.
The automated tracking system provides large quantities of behavioral data for boldness and aggressiveness
analysis, and the infrared light source causes less disturbance to the nocturnal animal under observance. In
addition, because the object is recognized based on depth information instead of color or grayscale pattern
recognition, there are no restrictions on the selection of color or material for the substrate in the experimental
setup. This paper also contributes towards diminishing tracking error caused by water surface reflection and
robust body orientation estimation in case of inaccurate body segmentation. We tested ten European lobsters
sized between 25-30 cm to demonstrate the performance and effectiveness of our proposed algorithm.
1 INTRODUCTION
The European lobster was once an important econo-
mic specials for the fishery but the stock collapsed
between 1960 and 1980, to less than 10% of its pre-
1960 level (Agnalt et al., 2007). Nowadays, the situ-
ation has not improved much and there are still many
attempts to recover the natural stock. In order to meet
the huge market demand for the European lobster,
a long-lasting interest for controlled intensive pro-
duction of lobster has raised, where the aquaculture
industry mainly focuses on two different strategies;
in-house production from egg to plate-sized lobster
sold directly to the consumer market, or sea ranching
where lobster juveniles are released into the sea in se-
lected areas for growth and recapture after some years
when they reach the minimum landing size. Howe-
ver, both approaches require that the lobster is kept
in a relatively high density environment, and inherent
behavioral traits such as cannibalism and aggressive-
ness make it expensive and complicated to run high-
volume production systems.
One apparent solution to this problem could be to
identify potential non-aggressive individuals through
behavior analysis, which subsequently could be used
as breeding material for a cultivation-friendly docile
strain of lobster where the lobsters can be kept in sim-
ple communal cultures similar to those used success-
fully for fish.
Accordingly, the motivation of this paper is to
create a real-time automatic tracking system which
can robustly gather large quantities of high resolu-
tion behavioral data during carefully designed chal-
lenge tests and hence give the possibility for more
accurate boldness and aggressiveness analysis of Eu-
ropean lobster. In addition, the infrared light source of
our system allows gathering of data in complete dar-
kness giving less disturbance to the nocturnal animals
under observance. Because the European lobster is
recognized in our system based on depth information
instead pattern recognition based on color or grays-
cale images, there are no restrictions on the selection
of substrate color or material in the experimental se-
tup.
In previous studies of lobster behavior, it has been
common to manually determine the type of the beha-
vior such as fighting and approaching, and only record
the time span of various behaviors (Gherardi et al.,
2010; Aspaas S, 2016). The statistical analysis is ba-
sed merely on the measurement of time span, while
other useful data, such as the speed of body movement
and body orientation along the trajectory are omitted.
Even though there are tremendous amounts of pu-
blications on automatic human gesture and behavior
596
Yan, S. and Alfredsen, J.
Infrared Depth Camera System for Real-time European Lobster Behavior Analysis.
DOI: 10.5220/0006723605960602
In Proceedings of the 13th International Joint Conference on Computer Vision, Imaging and Computer Graphics Theory and Applications (VISIGRAPP 2018) - Volume 5: VISAPP, pages
596-602
ISBN: 978-989-758-290-5
Copyright © 2018 by SCITEPRESS – Science and Technology Publications, Lda. All rights reserved
analysis, only a few focus on specific animals, especi-
ally for lobster behavior analysis. (Kato et al., 2004)
developed a computer image processing system for
quantifying zebrafish behavior based on two color ca-
meras. Later (Qian and Chen, 2017) extend the sy-
stem for tracking of multiple fishes from multi-view
images. (Straw et al., 2010) used a multi-camera sy-
stem for tracking of flying animals. The flying ani-
mals were modeled as small blobs and their positions
were calculated by triangulation with known camera
positions. (Yan and Alfredsen, 2017b) tried to ex-
tract the gesture from a single lobster in view based
on a skeleton and distance transform. However the
algorithm requires that the background is restricted to
have a color that is very different from the lobster and
its performance relies heavily on color based segmen-
tation. Furthermore, attempts of aggressive behavior
analysis for stage IV European Lobster juveniles was
presented in (Yan and Alfredsen, 2017a).
Almost all previous studies on animal behavior are
using RGB cameras and the objects are extracted from
the background based on noticeable differences in co-
lor or grayscale image pattern between objects and the
background. However, in real applications, shadows
and noise in images are inevitable and the object ex-
traction algorithm normally puts strong restrictions on
the backgrounds that can be used, which subsequently
complicates the setup procedure of the animal beha-
vior experiments.
The main contribution of our algorithm is that it
is the first attempt using an infrared depth camera
for lobster behavior research which introducing mini-
mum disturbance to the nocturnal animal under obser-
vance. The paper also addresses the water reflection
problem when tracking and determining the orienta-
tion of the animal under water using infrared depth
camera.
The structure of this paper is as follows: we
describe our proposed algorithm in detail in Section
2. This section contains three subsections describing
each module contained in the automated real-time
tracking system. The experiments where our algo-
rithm is tested on ten wild European lobsters sized
between 25-30 cm are described in Section 3. Dis-
cussion and further work are given in Section 4.
2 ALGORITHM DESCRIPTION
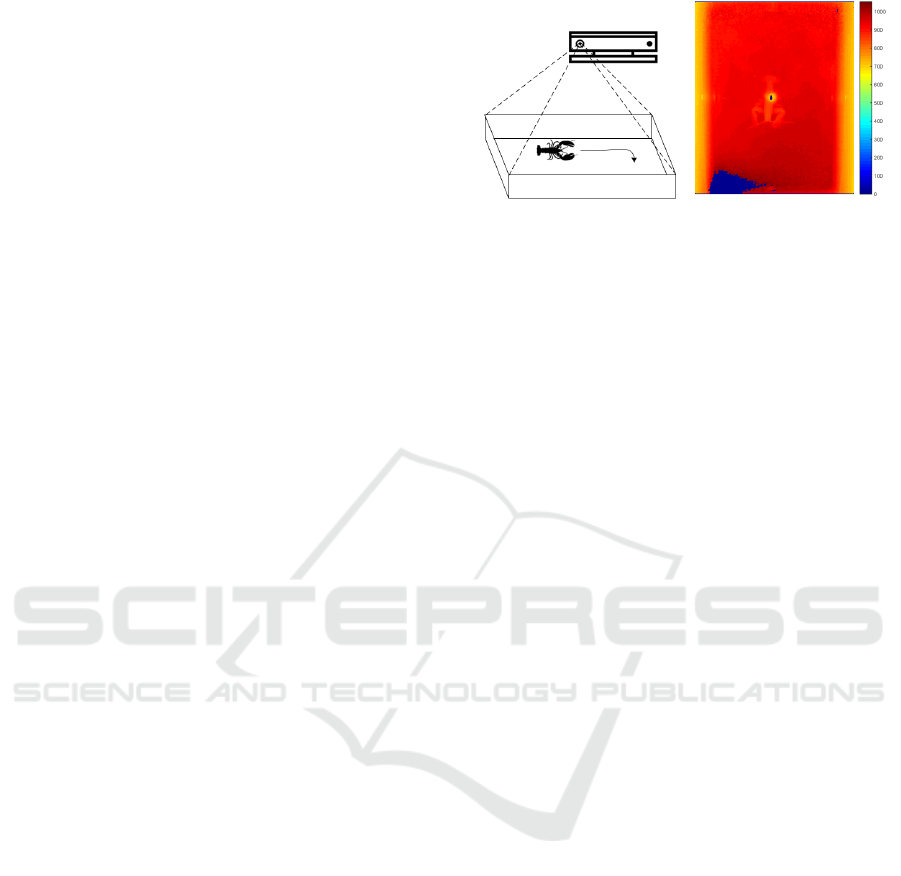
The system configuration is shown in Figure 1(a).
The infrared camera is mounted in front of a water fil-
led arena holding an European lobster with the optical
axis being approximately perpendicular to the bottom
surface of the arena. A typical depth map is shown in
(a) The system configuration (b) Depth image
Figure 1: Infrared Depth Camera System for European Lob-
ster Tracking.
Figure 1(b). The value on the color map bar is the dis-
tance of the point to the camera plane with unit of mil-
limeter. It is noticeable that there are erroneous depth
areas in the center and the left bottom of the image
due to the water surface reflection and deflection. Mo-
reover, because the absorption coefficient of water for
the infrared light source (825 - 850 nm) used in the
depth camera is much higher than that of air (Pegau
et al., 1997), and the infrared signal being attenuated
exponentially with respect to the distance travelled in
water, it will appear more noisy at the bottom of the
most distant parts of the arena. In the following sub-
sections, we will deal with difficulties caused by these
problems in order to track the lobster and obtain the
orientation of lobster as accurate as possible.
2.1 Lobster Segmentation
Because of the relative position between the camera
and the background is fixed in experiment’s setup, it
is effective to use the background subtraction method.
B
t
(x,y) =
(
1 d
a
(x,y) −d
t
(x,y) > T
d
0 otherwize
(1)
where B
t
is the primitive segmented foreground con-
taining the lobster at time t. d
t
(x,y) is the depth map
value at pixel (x,y) and d
a
(x,y) represents the depth
to the bottom of arena obtained by calculating the
average of the first N depth maps prior to introdu-
cing the lobster into the arena. Because the lobster
is always located above the bottom of the arena, we
can segment out the lobster simply by calculating the
depth difference.
However, this method is not able to segment out
the lobster in the area where depth camera renders a
wrong depth map due to the reflection or deflection
of water. Normally,the areas with erroneous measu-
rements are marked with distance zero and we have
to interpolate depths in this region by using the va-
lue from the depth region that is measured correctly
by the camera. Because the arena bottom is flat, we
Infrared Depth Camera System for Real-time European Lobster Behavior Analysis
597
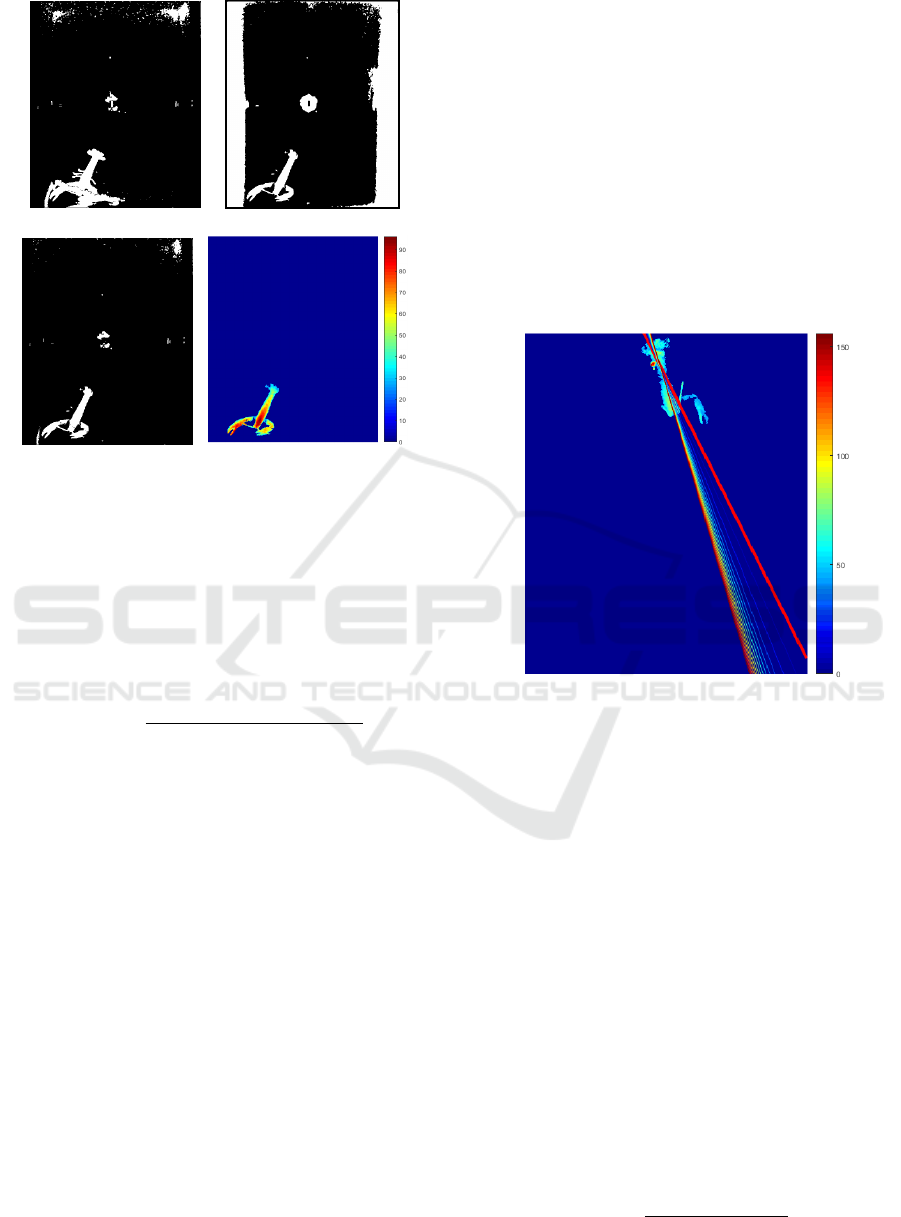
(a) image B
t
(b) image P
t
(c) image F
t
(d) depth image of L
Figure 2: An example of the lobster segmentation procedure
in which the lobster crosses the area where the depth map
contains erroneous disparities. The example illustrates the
robustness of the segmentation procedure.
run the MSAC (M-estimator SAmple and Consensus)
(Torr and Zisserman, 2000) algorithm to obtain the
plane model a
p
x + b
p
y −z + d
p
= 0. We define the
cost function that the MSAC tries to minimize as
C =
∑
(x,y)
ρ(
[a
p
x + b
p
y −d
a
(x,y) + d
p
]
2
a
2
+ b
2
+ 1
) (2)
Where C is a redescending M-estimator with thres-
hold T that classifies the points as outliers when dis-
tances to the plane are larger than T.
ρ(e
2
) =
(
e
2
e
2
< T
2
T
2
e
2
≥ T
2
(3)
With the estimated plane parameter
θ = (a
p
,b
p
,d
p
) we can obtain the flat bottom
depth map denotes as d
f
(x,y) = a
p
x + b
p
y + d
p
and obtain the second segmentation binary image
based on the fact that the lobster should be above the
estimated bottom plane but also below T
max
that is
determined by the height of the lobster’s body.
P
t
(x,y) =
(
1 T
max
> d
f
(x,y) −d
t
(x,y) > T
min
0 otherwize
(4)
Combining the two segmented binary images by
applying the logical AND operation, we obtain a more
robust lobster body segmentation.
F
t
(x,y) ← B
t
(x,y) ∧ P
t
(x,y) (5)
Because all the previous procedures are done
pixel-wise, there are still many unavoidable noise
spots or small regions caused by the reflection of wa-
ter surface. Therefore, we run the two-pass, con-
nected components algorithm (Horn, 1986) to divide
the binary image F
t
into blobs and choose the largest
blob as lobster and we denote the blob point set as
L = {(x
i
,y
i
)|i = 1 . . . n}. The procedure is illustrated
in Figure 2.
2.2 Body Orientation
Figure 3: Example showing the performance of the body
line fitting algorithm. In this example, one claw is not in-
cluded in the connected component blob and the initial line
of orientation is indicated with a thick red line. The asym-
metry of the lobster body causes the line fail to represent the
true body orientation. The thin lines with colors from blue
to red show the steps taken by the refinement procedure for
finding the true main body orientation.
The body orientation is a very important quantity in
behavior analysis. However, the lobster has two large
flexible claws with a wide range of possible positions
making the orientation somewhat difficult to calcu-
late. In addition, because the connecting joints bet-
ween the lobster’s body and claws are sometimes po-
sitioned above the bottom of arena with small height,
it is possible that one or both of the claws are missing
in L due to blob disconnection. By observing that the
main body stem is always highest, we could fit a line
to L in terms of weighted perpendicular offsets. Sup-
pose the line function is y = ax + b and we can obtain
the model by minimize the line cost function
R =
n
∑
i=1
[y
i
−(a + bx
i
)]
2
w
i
1 + b
2
(6)
VISAPP 2018 - International Conference on Computer Vision Theory and Applications
598

Where weight w
i
= λ(d
f
(x
i
,y
i
)−d
t
(x
i
,y
i
)) is pro-
portional to the height from lobster’s back to the in-
terpolated plane. The equation (6) can be shown to
have a closed-form solution as follows:
B =
1
2
[
∑
n
i=1
y
2
i
w
i
−(
∑
n
i=1
y
i
w
i
)
2
/ ¯n]
(
∑
n
i=1
x
i
w
i
∑
n
i=1
y
i
w
i
)/ ¯n −
∑
n
i=1
x
i
y
i
w
i
−
1
2
[
∑
n
i=1
x
2
i
w
i
−(
∑
n
i=1
x
i
w
i
)
2
/ ¯n]
(
∑
n
i=1
x
i
w
i
∑
n
i=1
y
i
w
i
)/ ¯n −
∑
n
i=1
x
i
y
i
w
i
(7)
b = −B ±
p
B
2
+ 1 (8)
a =
∑
n
i=1
y
i
w
i
−b
∑
n
i=1
x
i
w
i
¯n
(9)
Where ¯n =
∑
n
i=1
w
i
and we choose the sign in
equation (8) that minimize the line cost function.
After obtaining the initial estimate of the body
line, a subsequent iterative refinement procedure is
implemented to obtain a more accurate line fitting the
main body stem based on the subset of points in L that
are within some vertical distance to the line. This ite-
rative procedure is run in steps until convergence or
maximum number of iterations is reached. Figure 3
shows a challenging case with a large initial asymme-
try, and illustrates how the body line refinement al-
gorithm iterates through multiple steps to eventually
find the true body line.
Algorithm 1: Refine the body line.
Input: Lobster blob L , weight w
i
,distance
threshold T
l
Output: refined body line y = ax + b
initialize (a,b) according to equation (7)-(9);
repeat
obtain point set
L
s
= {(x,y) ∈ L|
|y−ax−b|
√
a
2
+b
2
< T
l
};
(a,b) = argmin
a,b
∑
(x
i
,y
i
)∈L
s
[y
i
−(a+bx
i
)]
2
w
i
1+b
2
;
until reach maximun iteration O
O
OR
R
R
Convergence;
return y = ax + b and body orientation
α = actan(a)
For fast convergence, we can also take the calcu-
lated line model at t −1 as the initialization value for
(a,b) at time t.
To resolve the ambiguity of the head direction,
points in set L are projected onto the line y = ax + b
and we count the number of projected points in the
two halves of the line segment whose end points
are defined by the two projected points from L on
y = ax + b having the largest distance. The direction
is pointing from the half line segment with less points
to the half with more points based on the fact that the
carapace of a lobster is has larger height and covers a
larger area than the tail. Because it is impossible for a
lobster to make a turn between two adjacent video fra-
mes, it is reasonable to assume that the orientation α
t
at frame t and the orientation α
t−1
at frame t −1 forms
an acute angle. We can then keep the direction at t −1
and utilize it to eliminate the direction ambiguity by
adding ±π to α
t
if α
t−1
and α
t
forms an obtuse angle.
Thus, the head orientation detection does only have to
be calculated once in the first frame.
2.3 Position and Tracking
One easy solution to obtain the animal position is to
calculate the centroid point of the lobster blob. Ho-
wever, because the claws are moving or claws can be
missing from the blob, the centroid point is not a sta-
ble representation of the position. To reduce the insta-
bility and at the same time alleviate the computational
burden, we project the centroid point to the lobster’s
body line. We then make the assumption that the dis-
tribution of measurement error is Gaussian and the
lobster’s dynamics of motion is linear. A Kalman fil-
ter can then be applied to obtain a more stable tracking
trajectory. We define the state vector s
s
s = (x,y, ˙x, ˙y).
The measurement model is z
z
z
t
at time t is defined
as
z
z
z
t
= Is
s
s
t−1
+ v
v
v (10)
The process update model can be written as
s
s
s
t
= As
s
s
t−1
+ w
w
w (11)
where the random variable v
v
v and w
w
w are normal dis-
tribution with zero mean, representing measurement
and process update noise respectively. I is 4 ×4 unit
matrix. The state transition matrix A relates the state
at the previous time step t −1 to the state at current
time step t, and is defined as
A =
1 0 ∆t 0
0 1 0 ∆t
0 0 1 0
0 0 0 1
(12)
Because the movement of the lobster in a real situ-
ation is quite sophisticated and the linear dynamical
model represents a relatively coarse approximation,
we account for the uncertainty by setting a larger va-
riance in w
w
w compared to the noise in the measurement
model v
v
v.
Infrared Depth Camera System for Real-time European Lobster Behavior Analysis
599
3 EXPERIMENT
The experiment was carried out in an indoor environ-
ment and we chose to use a Kinect v2 as the infrared
depth camera. The depth image had a resolution of
512 by 424 pixels and was obtained at a frame rate
of 30 frames per second. The European lobster under
observance were put in an shallow arena of size 115
cm by 95 cm filled with water of height to a height
around 19 cm. The Kinect v2 was fixed around 80 cm
above the bottom of the arena.
We used ten European lobsters of wild origin
caught off west coast of Norway. The profiles of the
lobster are listed in the Table (1).
We tested our system in two different scenarios;
one where the water arena had no substrate, and anot-
her with sand as substrate, giving 20 tests in total.
When a test for one lobster was finished, we emptied
the arena and cleaned it in order to reduce potential
odors released from lobster, preventing possible be-
havioral influence between tests.
The implementation of our algorithm was done in
MATLAB R2016 on a PC with an Intel i5-3470 CPU
and the data acquisition module was implemented in
C#. The first 9000 frames from each test was used for
the analysis. We calculated the background d
a
using
the first 90 frames before the lobster was put into the
arena and waited for another 36 seconds to allow for
the transfer of the lobster into the arena as well as
some time to let the animal settle in the tank. Then
the algorithm ran for the remaining 7830 frames. The
average processing speed for the system was about 30
frames per second.
The system successfully tracked the lobsters mo-
vement in real-time, and recorded the position and
orientation of the lobster in each frame allowing for
analyses at a resolution and detail that otherwise
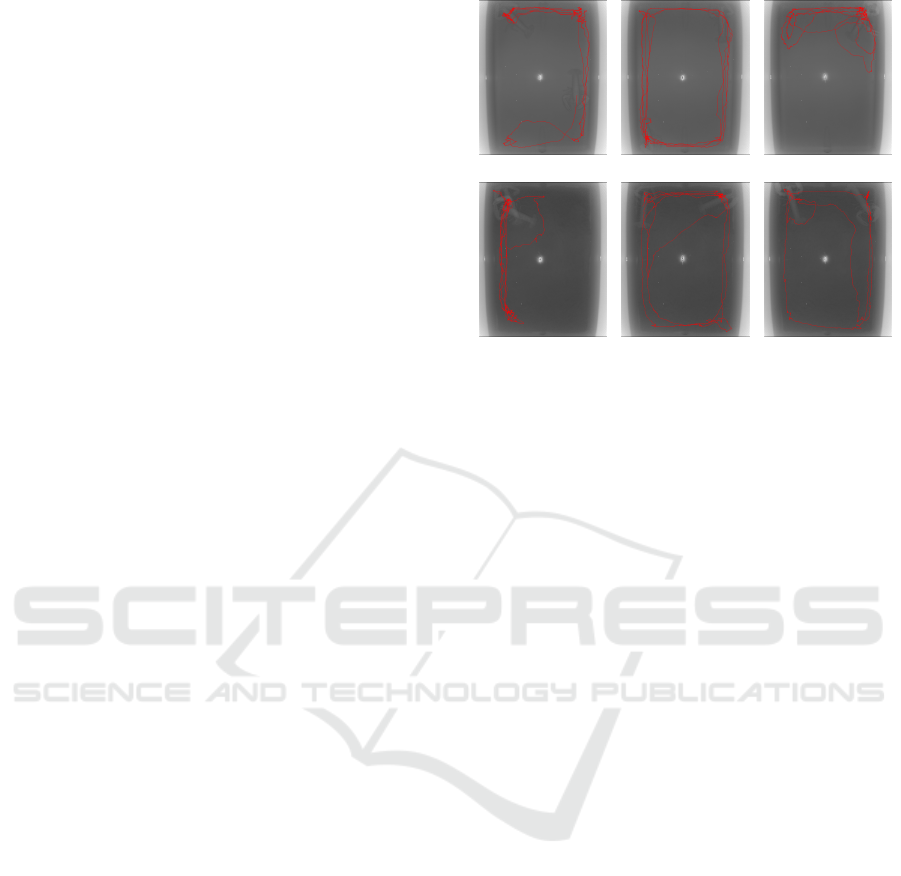
would virtually impossible be done manually. For il-
lustrative purposes, we overlay the lobster trajectory
on the average of the first and last IR images in the
tracking process as shown in Figure 4. Even though
the substrate is different, the specimen shows some
similarity in the trajectory pattern. For instance, lob-
ster No.2 is unwilling to explore the four walls of
the arena in the two tests. Lobster No.4 tends to be
more active in exploring its surroundings than the ot-
her two lobster in the two tests. The orientation ver-
sus time plot is even more interesting, as shown in
Figure 5. The consistency of the different lobsters
orientation pattern can easily be seen. For instance,
lobster No.2 tends to change the direction of motion
more frequently than the other two. Such patterns are
not easily discovered if records of the span of time of
certain behaviors were the only quantities measured
(a) Lobster No.2 (b) Lobster No.4 (c) Lobster No.9
(d) Lobster No.2 (e) Lobster No.4 (f) Lobster No.9
Figure 4: Selected results of European lobster tracking sy-
stem. The three columns are for Lobster No.2, No.4 and
No.9 respectively. First row is the trajectory of lobster with
no substrate and the second row is with sand substrate.
during the behavior test.
We also calculated four additional metrics for the
ten lobster in the two scenarios. The results are shown
in table (2). The column ’normal’ in the table repre-
sents the scenario with no substrate, while ’sand’ re-
presents the scenario with sand as substrate. Trajec-
tory length gives the distance travelled by the lobster
during a test and can be used as an indicator of its
activity level when exploring a new environment. Ex-
plored area gives the percentage of the tank area the
animal has explored during a test and can be used as
a metric related to the lobsters willingness to explore
new areas in an unknown environment. When calcu-
lating this metric, we represented the lobster by a cir-
cular disk covering an area with the same size as the
lobster itself to compensate for the influence of varia-
tions in the segmentation results caused by the water
reflection and noise. Mean angular speed could serve
as a statistical indirect measurement with respect to
the characteristics of individual to change its direction
of exploration. From the mean speed measurement,
we can also observe some tendencies that can not be
seen directly from Figure 4, for this instance that all
the lobster has higher mean speed in the normal sce-
nario than in one with sand.
4 DISCUSSION AND FURTHER
WORK
This is the first attempt to use an infrared depth ca-
mera for real-time European lobster tracking and be-
havior analysis. It represents an ideal solution for
VISAPP 2018 - International Conference on Computer Vision Theory and Applications
600
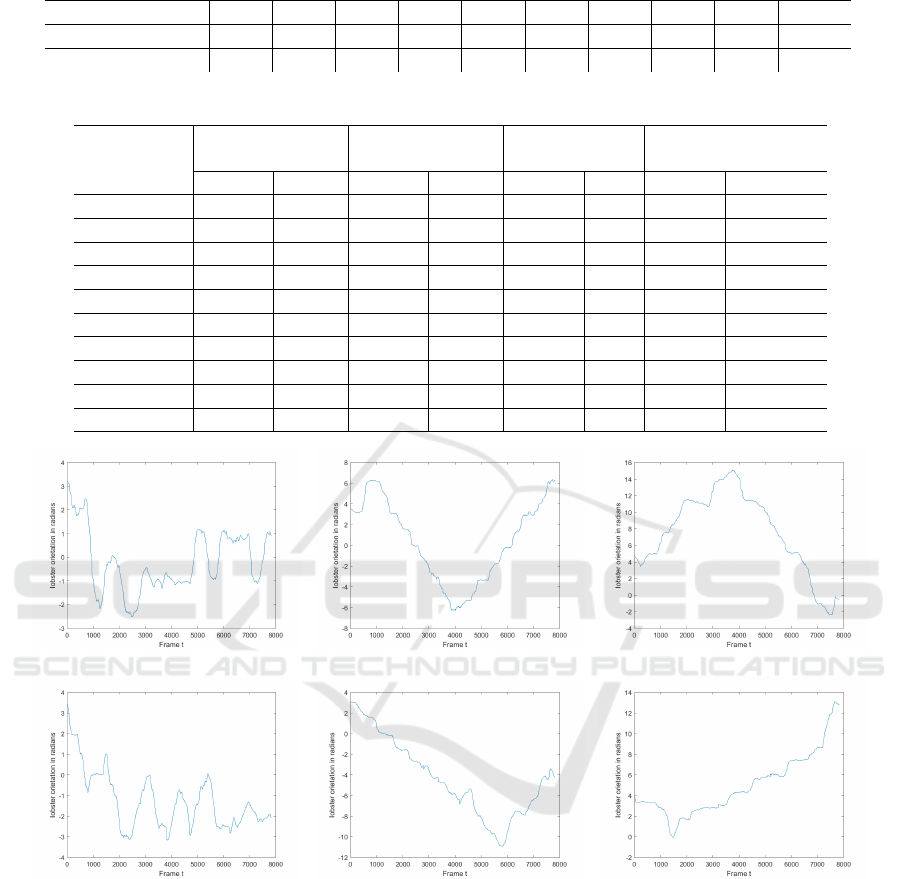
Table 1: Profiles of the ten lobsters used in experiment.
Lobster No. No.1 No.2 No.3 No.4 No.5 No.6 No.7 No.8 No.9 No.10
Body length (cm) 26.9 27.0 24.9 25.5 25.0 25.9 29.4 25.0 26.2 27.0
Gender M M F F M M F M F M
Table 2: Real-time lobster tracking metrics.
Lobster No.
trajectory length
(pixel)
explored area
mean speed
(pixel/s)
mean angular speed
(radian/s)
normal sand normal sand normal sand normal sand
No.1 6730 4922 63.9% 55.3% 25.8 18.9 0.204 0.147
No.2 5707 5072 46.0% 34.2% 21.9 19.4 0.133 0.139
No.3 7030 6343 63.9% 66.1% 26.9 24.3 0.168 0.158
No.4 7360 5907 46.0% 61.0% 28.2 22.6 0.144 0.126
No.5 5646 5023 72.4% 74.1% 21.6 19.2 0.115 0.097
No.6 7137 6849 72.9% 72.1% 27.3 26.2 0.186 0.157
No.7 6303 3803 68.9% 26.3% 24.1 14.6 0.147 0.085
No.8 7697 3985 79.1% 56.1% 29.5 15.3 0.165 0.096
No.9 5107 3982 34.8% 67.0% 19.6 15.3 0.149 0.091
No.10 8340 6225 61.8% 73.4% 32.0 23.8 0.179 0.143
(a) Lobster No.2 (b) Lobster No.4 (c) Lobster No.9
(d) Lobster No.2 (e) Lobster No.4 (f) Lobster No.9
Figure 5: Lobster body orientation versus time plots. The three columns represent Lobster No.2, No.4 and No.9 respectively.
First row is from the test scenario with no substrate and second row with sand substrate.
nocturnal animals such as lobster which require dar-
kness to behave naturally. We also proved the appli-
cability of the algorithm in terms of processing speed
and the consistent results obtained from the obser-
vation of ten wild caught European lobster. The in-
frared depth camera together with the proposed al-
gorithms enable quantitative high resolution analyses
of behavioral traits like boldness and aggressiveness
that were previously unattainable. The great amount
of data that can be extracted through the system in
real-time allows for efficient scanning and behavioral
characterization of populations of considerable size in
searching for specimen suitable for breeding. More
advanced machine learning algorithms can be applied
to such data to reveal possible hidden patterns and
hence to predict the lobster aggressiveness level from
camera recordings.
We did not use the object association algorithm for
tracking mainly because of the conditions of the ap-
plication. The lobster is very aggressive animal and
Infrared Depth Camera System for Real-time European Lobster Behavior Analysis
601

we seldom put more than two lobsters together and
let them fight. The lobsters can be seriously injured
because of fight. However, with a simple extension
that keeps two largest blob from F
t
, this algorithm
can be applied directly to the situation in which two
lobsters are kept in the same arena with objects that
prevent the two approaching or fighting with claws.
In this way, the aggressiveness level between the two
lobsters can be automatically inferred by the metrics
from the measurements.
Further work may be done to improve the robust-
ness of the lobster segmentation. Also, it is likely that
a multiple camera system may obtain more robust and
occlusion free observations.
REFERENCES
Agnalt, A.-L., Kristiansen, T. S., and Jrstad, K. E. (2007).
Growth, reproductive cycle, and movement of ber-
ried european lobsters (homarus gammarus) in a lo-
cal stock off southwestern norway. ICES Journal of
Marine Science, 64(2):288.
Aspaas S, Grefsrud ES, F. A. J. K. T. H. A. A.-L. (2016). An
enriched environment promotes shelter-seeking beha-
viour and survival of hatchery-produced juvenile eu-
ropean lobster (homarus gammarus). PLoS ONE,
11(8):e0159807.
Gherardi, F., Cenni, F., Parisi, G., and Aquiloni, L. (2010).
Visual recognition of conspecifics in the american
lobster, homarus americanus. Animal Behaviour,
80(4):713 – 719.
Horn, B. K. P. (1986). Robot Vision, pages 69–71. MIT
Press.
Kato, S., Nakagawa, T., Ohkawa, M., Muramoto, K.,
Oyama, O., Watanabe, A., Nakashima, H., Nemoto,
T., and Sugitani, K. (2004). A computer image proces-
sing system for quantification of zebrafish behavior.
Journal of neuroscience methods, 134(1):1–7.
Pegau, W. S., Gray, D., and Zaneveld, J. R. V. (1997). Ab-
sorption and attenuation of visible and near-infrared
light in water: dependence on temperature and sali-
nity. Appl. Opt., 36(24):6035–6046.
Qian, Z.-M. and Chen, Y. Q. (2017). Feature point based
3d tracking of multiple fish from multi-view images.
PloS one, 12(6):e0180254.
Straw, A. D., Branson, K., Neumann, T. R., and Dickin-
son, M. H. (2010). Multi-camera real-time three-
dimensional tracking of multiple flying animals. Jour-
nal of The Royal Society Interface.
Torr, P. H. and Zisserman, A. (2000). Mlesac: A new robust
estimator with application to estimating image geo-
metry. Computer Vision and Image Understanding,
78(1):138–156.
Yan, S. and Alfredsen, J. A. (2017a). Automatic video ana-
lysis of stage iv european lobster juveniles for their
aggressive behavior assessment. Proc. IET, 8th Inter-
national Conference of Pattern Recognition Systems
(ICPRS 2017), pages 41 (6 .)–41 (6 .)(1).
Yan, S. and Alfredsen, J. A. (2017b). Real time lobster
posture estimation for behavior research. Proc. SPIE,
Eighth International Conference on Graphic and
Image Processing (ICGIP 2016), 10225:102250F–
102250F–5.
VISAPP 2018 - International Conference on Computer Vision Theory and Applications
602
