
A Novel Formal Approach to Automatically Suggest Metrics in Software
Measurement Plans
Sarah A. Dahab, Juan Jose Hernandez Porras and Stephane Maag
Telecom SudParis, CNRS UMR 5157, Univ. Paris-Saclay, France
Keywords:
Software Metrics, Formal Measurement, Software Measurement, Measurement Plan, Formal Software
Measurement, SVM, Big Data.
Abstract:
The software measurement is an integral part of the software engineering process. With the rise of the soft-
ware system and their complexity distributed through diverse development phases, the software measurement
process has to deal with more management and performance constraints. In fact, the current software measure-
ment process is fixed and manually planned at the beginning of the project and has to manage a huge amount of
data resulting from the complexity of the software. Thereby, measuring software becomes costly and heavy.
In addition, the implementation of the measures is dependent on the developer and reduce the scalability,
maintainability and the interoperability of the measurement process. It becomes expert-dependent and thus
more costly. In order to tackle these difficulties, first, we propose in this paper a formal software measurement
implementation model based on the standard measurement specification SMM. Then, a software measurement
plan suggestion framework based on a learning-based automated analysis.
1 INTRODUCTION
The rise of software systems and their complexity
distributed through diverse development phases and
projects lead to a huge amount of data to manage, es-
timate and evaluate.Indeed, considering the quantity
of aspects to be measured raising the relevant infor-
mation to be analyzed and reported become difficult
(as concerned by Microsoft Power BI
1
). In this con-
text software measurement becomes then crucial as
part of software development projects while the mea-
surement processes become tough. Thus, to ensure
a quality and efficient software engineering process,
adapted measurement processes are required.
Many works have been done on software mea-
surement to understand and formalize the mea-
surement process in software engineering context.
These studies have shown the importance of gath-
ering information on the software engineering pro-
cesses in particular to ensure its quality through met-
rics and measurements analysis (Fenton and Bie-
man, 2014). Thanks to that, standardization insti-
tutes worked in that way to propose two well-known
norms, ISO/IEC25010 (ISO/IEC, 2010) and OMG
SMM (Group, 2012) to guide to the measurement
1
https://powerbi.microsoft.com/
plan specification. These two standards have been
reviewed by the research community and industrials,
and are adapted and applied in many domains.
Though, an important base is defined and well-
known through measurement models which define
the measurable software criteria and their associ-
ated measures, the manual measurement planning be-
comes heavy to manage with the quantity of aspects
to be measured. It leads to very complex measure-
ment plans, engendering eventual losses of time and
performance. These plans are often constrained to:
manual planning of the measurements, its serial exe-
cution, a lack of structure due to the use of informal
metrics, and a lack of flexibility due to fixed measure-
ment plans.
The objectives of this article are: first, to im-
prove the software measurement design phase. The
purpose is to use the code generation feature to fa-
cilitate a more generic implementation of software
measurements.Thereby we propose a software mea-
surement UML model from the formal measurement
specification SMM. Secondly, to optimize the man-
ual measurement management by making the metrics
use more flexible. Thus, we define a formal data
model and design a suggestion process that selects
metrics from the current measurement plan and sug-
gests a novel plan. We enable to cover an important
Dahab, S., Porras, J. and Maag, S.
A Novel Formal Approach to Automatically Suggest Metrics in Software Measurement Plans.
DOI: 10.5220/0006710902830290
In Proceedings of the 13th International Conference on Evaluation of Novel Approaches to Software Engineering (ENASE 2018), pages 283-290
ISBN: 978-989-758-300-1
Copyright
c
2019 by SCITEPRESS – Science and Technology Publications, Lda. All rights reserved
283

field of measurement by using the Support Vector Ma-
chines whose parameters are well chosen (automati-
cally searched).
Finally, our paper is organized as following. The
section 2 presents a state of art on software measure-
ments, and learning technique applied to this area.
Then, the section 3 introduces fundamental defini-
tions of measurement, the formal measurement spec-
ification SMM based on this latter and our design
model based on SMM. Our framework is presented in
detailed in the section 4. And we apply our approach
in Section 5 on a real case study. The experiments
are successfully evaluated and discussed. Finally, in
Section 6, we conclude and give the perspectives for
improvement.
2 RELATED WORKS
The studies on software measurement define the mea-
surement plan as part of the measurement process
where a set of metrics is selected according to the
property of the measure (Fenton and Bieman, 2014).
Several studies propose data models specific to a
property. The data models are presented as links be-
tween factors, criteria and metrics such as the Mc-
Call’s model, the standard quality model (Fenton and
Bieman, 2014; ISO/IEC, 2010) which bring this se-
lection of metrics to measure the software quality. But
the actual implementation and management of all this
data is left to the project manager.
While an important set of metrics has been de-
fined for diverse software domains, very few have
been used to improve the measurements plans. In
(Gao et al., 2011; Wang et al., 2011), the authors pro-
pose a prediction model in focusing on the problem
of attribute selection in the context of software qual-
ity estimation to select metrics.
Learning techniques are currently arising to effec-
tively refine, detail and improve the used metrics and
to target more relevant measurement data. Current
works such as (Laradji et al., 2015; Shepperd et al.,
2014; Prasad et al., 2015) raise that issue by propos-
ing diverse kinds of machine learning approaches for
SW defect prediction through SW metrics. However,
although these papers present interesting results, they
are dependent on the targeted measurement scope and
somehow do not suggest novel metrics according to
the running measured project.
3 FROM METROLOGY TO
SOFTWARE MEASUREMENT
CODE DESIGN
3.1 Measurement Fundamentals
The fundamental mathematics defines a measurable
space M as a pair composed of the measured object X
and the set of measurable properties A of X such as:
M = (X, A)|A ∈ X (1)
Then, a measure is defined as a function f which
assigns a formal value B of a defined formal set B to a
set of properties measurable A of an object X such as:
f : A → B|A ∈ X, B ∈ B (2)
Thus, a measure space MS is defined as the triplet
(X, A, f ) composed of the measurable space (X , A)
and its associated function f , such as f is an applica-
tion on A as defined below:
MS = (X, A, f )|A ∈ X, f (A) (3)
Finally, two measurable functions f and g such as:
f , g : A → B|A ∈ X, B ∈ B (4)
linked by the relations R = (+, ×, ÷, min, max) is a
measurable function m, herein called dependent, such
as
m : f Rg → B|B ∈ B
m : A → B|B ∈ B
(5)
The measurement y is the result of the application
f (A) of the function f on the measurable set A such
as:
y = f (A)|A ∈ X (6)
3.2 Software Measurement Definitions
In the software engineering context, the software
measurement terminologies are defined as below:
Measurand: a measurand is the measured object.
In this context, it is a software system, such as soft-
ware product, in use or software resource. It refers to
the element X in a measurable space in the fundamen-
tal point of view (FPV ).
Software Properties: the software properties are
the measurable properties of a software such as com-
plexity or performance. In the FPV , software proper-
ties refer to the measurable set A of a MS.
Measurement: a measurement is defined as a di-
rect quantification of a measured property (Fenton
and Bieman, 2014). This is the value of an evaluation
ENASE 2018 - 13th International Conference on Evaluation of Novel Approaches to Software Engineering
284
result in a single time. This is information on the mea-
sured property, such as the percentage of the memory
used. In the fundamental point of view (FPV ), the
measurement refers to the result of a function of a
Measure Space (MS).
Measure: a measure is the definition of a concrete
calculation to evaluate a property, such as the calcu-
lation of the number of lines of code. In the FPV , a
measure is the function of a MS.
Direct Measure: is the measure independent of
other measures, thus it refers to the simple function in
the FPV .
Indirect Measure: is a measure dependent on
other measures. It refers to the independent function
in the FPV .
Metric: a metric refers to the measure space in
the fundamental view. It is the specification of a mea-
surement. The formal definition of a measurement of
a property of a computer object. It specifies the mea-
surand, the measure(s) and the property to be mea-
sured.
Complex Metric: a complex metric is a metric
composed of indirect measure(s).
Measurement Plan: a measurement plan is an or-
dered set of metrics (simple or complex). They are all
expected to be executed at a specific time t or during
a well-defined duration and according to an ordered
metrics sequence. They can be run sequentially or in
parallel.
3.3 Formal Specification and Design
Model
In order to optimize the design phase of the imple-
mentation of a software measurement, we propose
to design a generic UML model from a specifica-
tion modeling with the OMG’s standard SMM (Struc-
tured Metrics Meta-model). The purpose is to allow
a measurement code generation from a measurement
architecture model based on SMM. Indeed, generate
a model of the implementation structure from a model
of the measurement architecture with SMM allow the
use of the code generation feature.
Moreover, this process will allow to have docu-
mentation on the measurement architecture with the
SMM model, and documentation on the measurement
code structure with the UML model and thus, reduce
the load of the developer of the manual implementa-
tion designing.
In addition, the purpose of having documentation
through models and code generation from this latter is
to increase the interoperability, scalability and main-
tainability of the measurement process while decreas-
ing the expert dependency.
SMM: SMM is a standard specification which de-
fines a meta-model to specify a software measure-
ment architecture, in other words to specify a Mea-
sure Space applied to a computer system. It defines
the meta-models to express all necessary concepts to
specify a measurement context. And a wide range of
diversified types of measures is proposed to define the
dependency type between dependent measure (as the
ratio, binary or grade measure). The SMM specifica-
tion allows the description in detail of the main fol-
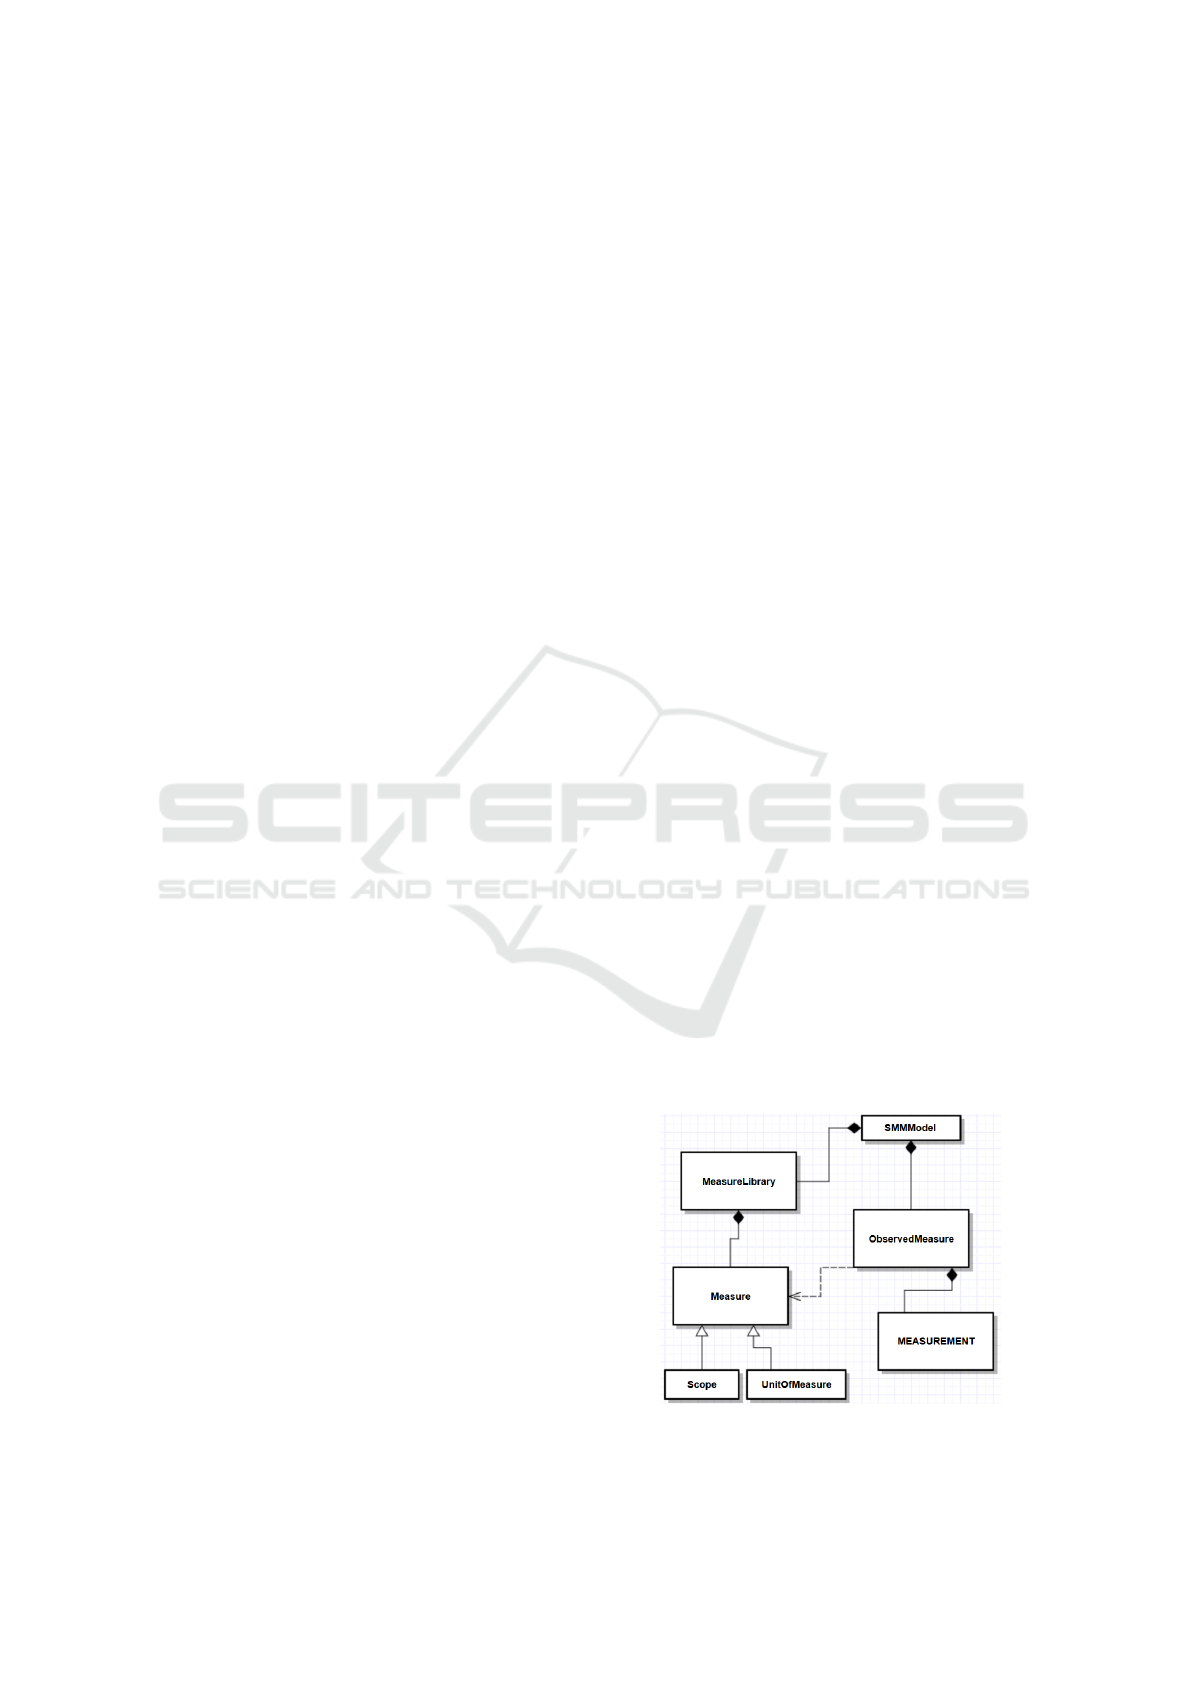
lowing concepts as illustrate in the Fig. 1:
• MeasureLibrary
• Measure
– Scope
– Unit of measure
• ObservedMeasure
• Measurement
These concepts refer to the concepts defined in the
previous section. The Scope is the subset defining the
measured property on which the measure is applied.
For example, to evaluate the software complexity, we
measure the code architecture. Thus, the measurable
property is complexity and the measure scope is the
code.
The Unito f measure allows to specify the type of
result.
The MeasureLibrary refers to the set of linked
measures. And Measure refers to the function of mea-
surement.
Then, ObservedMeasure allows to associate a
measure of a libraryMeasure to a measurement. As
example, we define a property to be measured which
needs the assessment of several dependent measures.
ObservedMeasure defines the measure which is asso-
ciated to the final measurement result, corresponding
to the global measurement of the measured property.
This information is to help the developer to under-
stand the specification.
Figure 1: SMM Overview.
A Novel Formal Approach to Automatically Suggest Metrics in Software Measurement Plans
285
In this paper, we base on SMM to model a generic
software measurement implementation design as a
code structure to guide the implementation of mea-
sures.
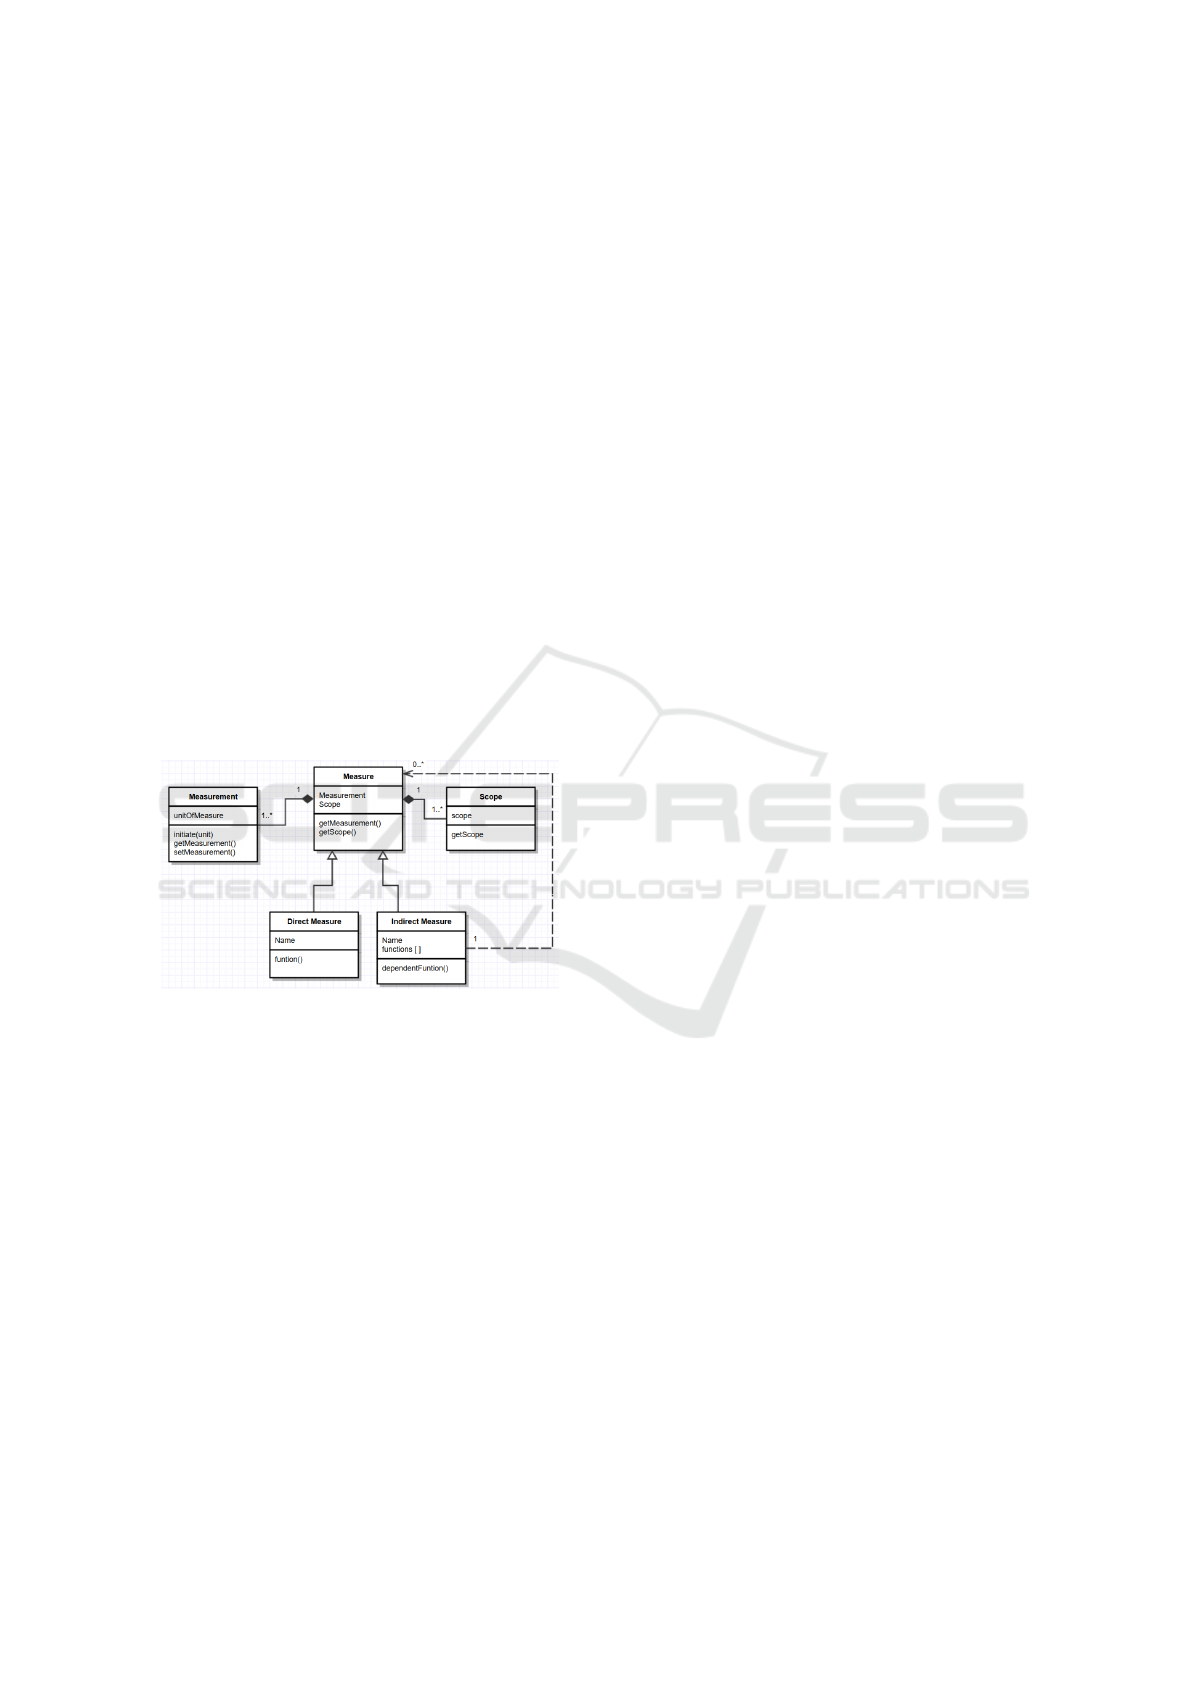
SMM-based Software Measurement Code Struc-
ture Model: From the meta-model SMM, we pro-
pose a generic UML model defining the code struc-
ture of a software metric. As illustrated in the Fig. 2,
the model is made of the principal class Measure
which composed of two objects:
• Scope which consists of the definition of software
structure to be measured such as the file code or a
repository path.
• Measurement represents a measurement result
and its unit of measure.
And specified in two types of measures:
• DirectMeasure which refers to the independent
measure. This class is free from any other mea-
sures.
• IndirectMeasure which has dependencies with
other measures.
Figure 2: UML model designing a Software Measurement
Code architecture.
In the next section, we propose an approach of a
software measurement analysis and interpretation as
contribution to the improvement of the measurement
execution phases.
4 OUR AUTOMATED DYNAMIC
MEASUREMENT PLAN
MANAGEMENT FRAMEWORK
In order to optimize the current measurement process
which are manual and static and thus very costly, we
propose an automated analysis and suggestion as an
approach, by using the learning technique SVM.
4.1 Automated Software Measurements
Analysis
SVM: A support vector machine (SVM) (Vapnik
and Vapnik, 1998) is a linear classifier defined by
a separating hyperplane that determines the decision
surface for the classification. Given a training set (su-
pervised learning), the SVM algorithm finds a hyper-
plane to classify new data. Consider a binary classi-
fication problem, with a training dataset composed of
pairs (x
1
, y
1
), . . . , (x
l
, y
l
), where each vector x
i
∈ R
n
and y
i
∈
{
−1, +1
}
. The SVM classifier model is a
hyperplane that separates the training data in two sets
corresponding to the desired classes. Equation (7) de-
fines a separating hyperplane
f (x) = w
T
x + b = 0 (7)
where w ∈ R
n
and b ∈ R are parameters that control
the function. Function f gives the signed distance
between a point x and the separating hyperplane. A
point x is assigned to the positive class if f (x) ≥ 0,
and otherwise to the negative class.
Features & Classes: In this paper, we use the SVM
in order to classify a set of measurements. We define
this set of measurements as a vector of features. Each
feature is a field of a vector and a measurement of one
specific measure. Each field is unique. So a feature
is a measurement composing a vector for our classifi-
cation. Further, the vectors are classified into classes
according to the feature values. Each class refers to
a measured software property, such as the maintain-
ability or reliability. The features composing a vector
are the measurements which give information on the
classes.
Software Measurement Classification: Our
framework is based on the SVM classification results
to orient the measurement plan. It aims at highlight-
ing the main observed software characteristics during
the measurements. We name them as the properties
of interest. The principle is to classify a vector in the
class corresponding to the property whose values of
the vector show this type of interest. Then, the class
with the most number of classified vectors, called
Biggest, corresponds to the property(ies) of interest,
while the others with less number of classified vec-
tors, called Others, correspond to the properties that
do not show much interests. The measurement plan
should insist on the first property, unlike the others.
Thus, a specific procedure is defined according to
the class put forward to guide the measurement plan
by suggesting the measurements on the concerned
ENASE 2018 - 13th International Conference on Evaluation of Novel Approaches to Software Engineering
286

property. For that purpose, the mapping system is
used.
The algorithm defining this procedure is called
Analysis. It takes as input a set of vectors of float
called vectors. And as output, it returns the name of
the class with the most number of classified vectors
such as describe by the pseudo-code below:
Procedure : Analysis
begin
input : vectors float[X] | X number of measures
classification (vectors)
output : string className
end
4.2 Measurement Plan Suggestion
The Mapping System: This mapping system aims
to allows to determine which features should be gath-
ered for the vectors analysis and for which gathering
should be stopped. This decision is based on the clas-
sification result and enables to improve the measure-
ment process at this level. In other words, by regu-
lating the measurements gathering as needed, this en-
sures to improve the performance of the data manage-
ment for the analysis.
We map classes with metrics, and metrics with
features. This mapping is performed by the experts of
the measured system. According to the type of inter-
est (in terms of numbers of vector contained) of the
classes highlighted by the SVM classification, some
metrics will be added or removed from the measure-
ment plan. Thus, new features will be gathered and
others will no longer be.
Classes-Metrics: The learning classes refer to
the different measured properties of a software. The
metrics defined for the measurement process are those
which allow to measure these properties. The classes
are used for the classification of the vectors accord-
ing to their features values. As above mentioned, our
classification method is to classify a vector in the class
corresponding to the property whose the values of the
vector show a type of interest. Thus, the metrics as-
sociated to a class are the needed measurements to
measure the property represented by the class.
Features-Metrics: The features of a vector re-
fer to the results of the measures making up the met-
rics defined for the software measurement. They are
used to classify the vectors. Their values inform about
the properties (classes) of interest. There are features
which give information on only one property and oth-
ers which can give information on several different
properties. Some of the measures can be used by dif-
ferent metrics. Thus, the features associated with a
metric are the features corresponding to the measures
which composed the metric.
We define the mapping system as a data structures.
The first is a two dimensions list to link each class
with the list of related metrics, called classMetrics .
And the second a two dimensions list to link each fea-
ture of the list of related metrics, called f eatMetrics.
The pseudo-code is defined below:
DataStructure :
begin
classMetrics string[X][]
featMetrics string[X][]
end
In order to ensure the sustainability of measure-
ment cycles by having at each cycle an information
on all measured properties a set of metrics should al-
ways be gathered. This set is called mandatory fea-
tures. To select the mandatory features, we use the
RFE technique, explained below, based on SVM. The
purpose is to have at each cycle a dynamic selection
of the mandatory features.
The Feature Selection: The Feature Selection (FS)
process goal is to find the relevant features for the
classes found in the classification process by deter-
mining a subset of features that collectively have good
predictive power. With feature selection, our objec-
tive is to highlight the features that are important for
classification process. This leads to the possibility of
not considering all the features but only the ones cor-
responding to the types of interest.
The feature selection method used is Recursive
Feature Elimination (RFE) (Khalid et al., 2014). RFE
process is optimized for the classifier to be used. RFE
performs backward elimination. Backward elimina-
tions consist of starting with all the features and test
the elimination of each variable until no more fea-
tures can be eliminated. RFE starts with a classifier
that was trained will all the features and each feature
is assigned a weight. Then, the feature with the ab-
solute smallest weight is eliminated from the feature
set. This process is done recursively until the desired
number of features is achieved. The number of fea-
tures is determined by using RFE and cross valida-
tion together. The result of the process is a classifier
trained with a subset of features that achieve the best
score in the cross validation. The classifier used dur-
ing the RFE process is the classifier used during the
classification process.
We define the algorithm Selection which takes as
input of float called vectors and return as output a
list of features selected f eatures. And apply the RFE
technique on the vectors such as described below:
Procedure : Selection
begin
A Novel Formal Approach to Automatically Suggest Metrics in Software Measurement Plans
287

input : vectors float[X] | X number of measures
RFE (vectors)
output : selectedFeatures string [Y] | Y in X
end
Measurement Plan Suggestion Algorithm: Fol-
lowing the classification, two sets of classes are high-
lighted: the one with the most vectors called Biggest
and the other set constituted of all the other classes
called Others. The Biggest means that the cor-
responding property is the most interested element
while the Others means that the corresponding prop-
erties are not the elements of interest. Thereby, our
Suggestion algorithm, described below, is applied for
the property corresponding to the Biggest. Indeed, the
Biggest property needs a further measurement, while
the Others one no longer need it. Basically, based on
the procedures Analysis and Selection, we raise un-
necessary features for the classification that should be
removed from the measurement plan.
This procedure is based on the data structure and
both procedures Analysis and Selection presented
above. It takes as input a set of vectors vectors and
it returns as output a set of metrics as new suggested
measurement plan.
Procedure : Suggestion
begin
map DataStructure
biggest string
selectedFeats string[Y]
input : vectors float[X] | X number of measures
biggest = Analysis(vectors)
selectedFeats = Selection(vectors)
selectMs string []
for each i in selectedFeats :
feats=selectedFeats[i]
selectMs[i]=map.featMetrics[feats]
end for
output :
map.classMetrics[biggest] + selectMs
end
Through this method, the measurement load is in-
creased only on needs and decreasing due to less in-
terested properties.This suggestion approach allows
to reach a lighter, complete and relevant measurement
plan at each cycle of the software project manage-
ment.
5 EXPERIMENTS
Our methodology has been implemented and inte-
grated in a tool. We assess our suggestion process
by analyzing the new measurement plan based on the
results of the classification process and using them in
the feature selection process and to identify the class
of interest. The objective is to denote the effects of
using the suggested measurement plan and its impact
on the classification of new data and the amount of
data gathered by that plan.
The case study of this experiment is an in use Ori-
ented Object platform of the European project MEA-
SURE
2
. The measurement data used are the measure-
ment result applied on this platform.
5.1 Setup
We herein considered the following measurement
plan which is determined by the expert. A plan with
15 features, 15 metrics and 4 software quality prop-
erties. Each metric is composed of only one feature
and the mapping between metrics and classes is the
following:
• Maintainability (Class 1): Cognitive Complex-
ity, Maintainability Index and Code Size.
• System Performance (Class 2): Computational
Cost, Infrastructure Cost, Communication Cost
and Tasks.
• Performance (Class 3): Bugs, Response Time,
Running Time and I/O Errors.
• Functionality (Class 4): Usability, Precision,
Stability Response Time and Illegal Operations.
Using the previously described plan, we consid-
ered the class with the most predicted instances dur-
ing each cycle. A huge set of 16,000,000 unclassified
vectors were processed. This data set was divided into
32 subsets each containing 500,000 vectors. For each
period of the suggestion process, only one subset was
used as input.
The initial measurement plan use during the ex-
periment consisted of the following 5 metrics: Main-
tainability Index, Response Time, Running Time, Us-
ability, Computational Cost. These metrics where se-
lected by the expert as an example of a measurement
plan with a small number of metrics that has links to
all the software quality properties.
During the suggestion process each metric is as-
signed a number, in our experiments the number each
metric was assigned is shown in Table 1.
5.2 Results
During the suggestion process 15 metrics (Table 1)
were available to suggest new plans. With these met-
rics 15 unique measurement plans, 15 different sets
of metrics, were used in the suggestion process. Ta-
ble 2 lists the plans and in which cycle they were used.
2
https://itea3.org/project/measure.html
ENASE 2018 - 13th International Conference on Evaluation of Novel Approaches to Software Engineering
288
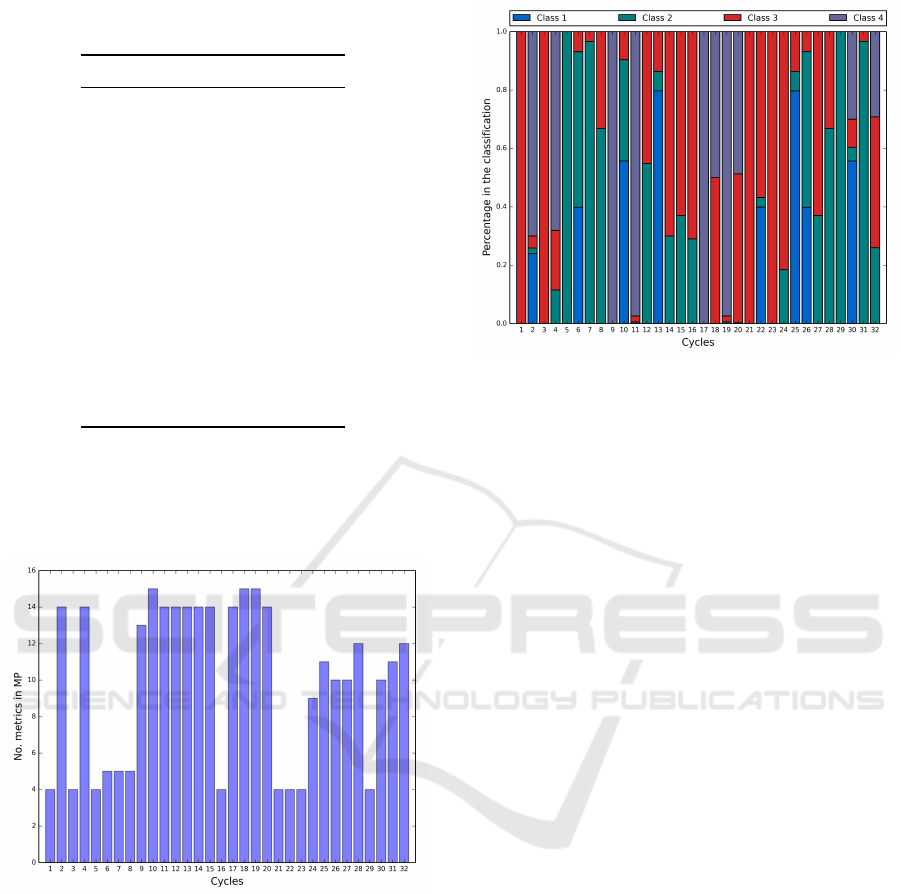
Table 1: Each metric and its assigned index during the sug-
gestion process.
Index Metric
1 Cognitive Complexity
2 Maintainability Index
3 Code Size
4 Bugs
5 Response Time
6 Running Time
7 Usability
8 Computational Cost
9 Infrastructure Cost
10 Communication Cost
11 Tasks
12 I/O Errors
13 Precision
14 Stability Response Time
15 Illegal Operations
The progress of the number of metrics in the measure-
ment plan can be seen in Fig. 3. The number of met-
rics move between only 4 metrics and the maximum
a plan with all the metrics.
Figure 3: Number of metric of the suggested plan in each
cycle.
Fig. 4 show how the classification of the vectors
was distributed during the cycles, the percentage of
the vectors assigned to each class.
Starting with MP1, this plan was only used during
the start of the process, this was the plan suggested by
the expert. Then MP2, this was the most used plan
during the process (6 times), this plan is form by the
metrics linked to the Performance property and was
suggested when the classification of vector to class
3 overwhelm the other classes. This tells us that to
focus on the Performance property the metrics in MP2
are sufficient.
MP3 was suggested when the four classes where
Figure 4: Classification results of each cycle. The results
show the percentage in the predictions of each cycles for
the 4 classes.
present in the classification results and class 4 was
the class of interest. The tool is suggesting to take
into consideration more than the linked metrics to the
class, it seems that this features help to the classifica-
tion of class 4.
MP4 was suggested when the input vectors were
only classified to class 2, this MP2 consist of the met-
rics linked to that class. This happens when the input
vectors are classified to only one class, the same can
be observed in cycle 1 but with class 3. MP5 only
has one more metric that MP4, Usability, and also
is a measurement plan focus in System Performance
property. And MP11 also was suggested when class
2 overwhelm the number of classifications during the
classification.
MP7, MP8 and MP9 are very similar measure-
ment plans. These plans have the highest number
of metrics, MP7 15 metrics and MP8&9 14 metrics.
This plans are suggested when the classification re-
sults usually have more than 2 classes. This is be-
cause the classes do not share any metric between
them. A measurement plan with must of the metrics is
expected to classified well the majority of the classes.
MP10, MP12, MP13, MP14 and MP15 where sug-
gested in the same case as the previously mention
plans but this plans where only suggested one time
during the process.
6 CONCLUSION AND
PERSPECTIVES
To conclude, in this article we propose a formal de-
sign approach of software measurement by basing on
the OMG’s standard specification SMM. The goal is
A Novel Formal Approach to Automatically Suggest Metrics in Software Measurement Plans
289

Table 2: Measurement plans used during the suggestion process and the cycles where they were used. Metrics of the plans
are represented by the indexes describe in Table 1.
Metrics Cycles
MP1 2, 5, 6, 7, 8 1
MP2 4, 5, 6, 12 2, 4, 17, 22, 23, 24
MP3 1, 2, 3, 4, 5, 6, 7, 8, 9, 10, 11, 13, 14, 15 3, 5, 18
MP4 8, 9, 10, 11 6, 30
MP5 7, 8, 9, 10, 11 7, 8, 9
MP6 1, 2, 3, 4, 5, 6, 7, 8, 9, 10, 13, 14, 15 10
MP7 1, 2, 3, 4, 5, 6, 7, 8, 9, 10, 11, 12, 13, 14, 15 11, 19, 20
MP8 2, 3, 4, 5, 6, 7, 8, 9, 10, 11, 12, 13, 14, 15 12, 21
MP9 1, 2, 3, 4, 5, 6, 7, 8, 9, 10, 11, 12, 13, 14 13, 14, 15, 16
MP10 3, 4, 5, 6, 8, 9, 10, 11, 12 25
MP11 1, 2, 3, 4, 5, 6, 7, 8, 9, 10, 11 26, 32
MP12 1, 2, 3, 4, 5, 6, 8, 9, 10, 11 27
MP13 1, 3, 4, 5, 6, 8, 9, 10, 11, 12 28
MP14 1, 2, 3, 4, 5, 6, 7, 8, 9, 10, 11, 12 29
MP15 1, 2, 3, 4, 5, 6, 7, 8, 9, 10 31
to have a solid formal basis to improve the software
measurement implementation phase, in order to in-
crease the interoperability, scalability and maintain-
ability of the measurement process.
Furthermore, we design an automated measure-
ment plan suggestion framework to add flexibility,
and expert-independent analysis. The learning tech-
nique SVM is used combined with the RFE algorithm
and allow to manage a huge amount of data.
Our methodology has been implemented and suc-
cessfully experimented on a real use case. The tool
was able to manage a large data set, the tool managed
16 million unclassified vectors.
As future works, we plan to integrate the formal
design model to an industrial modeling tool of our
partner of the European project MEASURE.
Regarding the suggestion tool, we plan to validate
our approach by comparing our results with results
of the actual processes. To support a bigger amount
of data by increasing the number of unclassified in-
stances and using a training file with more samples
with a larger vector. Then, to improve the suggestion
we plan to add the possibility to generate at runtime a
novel combined metric by basing on the analysis. In
addition, we expect to improve the analysis visualiza-
tion and reporting to a better readability.
Finally, we project to define innovative metrics as
emotional one-which measure the user emotions-for
measuring the quality of video games, or the quality
of user experience for VoD use as example. In other
words, to measure usability of an industrial system.
REFERENCES
Fenton, N. and Bieman, J. (2014). Software metrics: a rig-
orous and practical approach. CRC Press.
Gao, K., Khoshgoftaar, T. M., Wang, H., and Seliya, N.
(2011). Choosing software metrics for defect predic-
tion: an investigation on feature selection techniques.
Software: Practice and Experience, 41(5):579–606.
Group, O. M. (2012). Structured metrics metamodel (smm).
(October):1–110.
ISO/IEC (2010). Iso/iec 25010 - systems and software en-
gineering - systems and software quality requirements
and evaluation (square) - system and software quality
models. Technical report.
Khalid, S., Khalil, T., and Nasreen, S. (2014). A survey of
feature selection and feature extraction techniques in
machine learning. In Science and Information Con-
ference (SAI), 2014, pages 372–378. IEEE.
Laradji, I. H., Alshayeb, M., and Ghouti, L. (2015). Soft-
ware defect prediction using ensemble learning on se-
lected features. Information and Software Technology,
58:388–402.
Prasad, M. C., Florence, L., and Arya, A. (2015). A study
on software metrics based software defect prediction
using data mining and machine learning techniques.
International Journal of Database Theory and Appli-
cation, 8(3):179–190.
Shepperd, M., Bowes, D., and Hall, T. (2014). Researcher
bias: The use of machine learning in software defect
prediction. IEEE Transactions on Software Engineer-
ing, 40(6):603–616.
Vapnik, V. N. and Vapnik, V. (1998). Statistical learning
theory, volume 1. Wiley New York.
Wang, H., Khoshgoftaar, T. M., and Napolitano, A. (2011).
An empirical study of software metrics selection us-
ing support vector machine. In The 23rd International
Conference on Software Engineering and Knowledge
Engineering (SEKE), pages 83–88.
ENASE 2018 - 13th International Conference on Evaluation of Novel Approaches to Software Engineering
290
