
Identifying the Impact of Human Made Transformations of
Historical Watercourses and Flood Risk
Thomas Moran
1
, Sivaraj Valappil
1
and David Harding
2
1
Waste Innovation – Thames Water Utilities Limited, Island Road, Reading, U.K.
2
Waste Planning & Optimisation – Thames Water Utilities Limited, Island Road, Reading, U.K.
Keywords: Geographical Information System, Lidar, Culvert, Watercourse, Digital Terrain Model, Sewer, Flood.
Abstract: In the past, many urban rivers were piped and buried either to simplify development, hide pollution or in an
attempt to reduce flood risk and these factors define a culverted watercourse. A large amount of these
watercourses are not mapped, and if they are, then their original nature is not clearly identifiable due to being
recorded as part of the sewer network. Where these culverted watercourses are not mapped due to being lost
to time and development, we expressed these to be so-called ‘lost rivers’. There is a lack of awareness of the
flood risk in catchments housing these rivers, and because many of them are incorrectly mapped as sewers,
there is often confusion over their legal status and responsibility for their maintenance. To identify the
culverted watercourses many datasets were used including LiDAR data (Ground Elevation Data), historical
maps (earliest 1840's), asset data (Sewer network), and the river network. Automatic and manual identification
of potential culverted watercourses were carried out and then the mapped assets are analysed with flooding
data to understand the impacts. A GIS map has been created showing all potential lost rivers and sites of
culverted watercourses in the North London area.
1 INTRODUCTION
London has a large legacy population of culverted
and concealed watercourses, dating from the 19th and
20th centuries. Since these structures were built,
changes to the governance of drainage have resulted
in many assets being transferred between authorities
and in the process, comprehensive records have not
always survived. There is often uncertainty
surrounding the legal status and responsibility for the
maintenance of culverts. For example, many
culverted watercourses in London were included on
the map of public sewers, where their original status
has become obscured over time. This can be a
significant obstacle to the proper stewardship of the
structures. In addition, the culverting of watercourses
causes problems such as increasing upstream flood
risk due to blockages, reduced ecological value
within concrete channels and with reduced daylight
and adverse effects on environmental features and
wildlife. The issues are summarised as:
Inadequate maintenance and investment – the
responsibility for drainage assets varies according to
their legal status. For example responsibility for a
watercourse normally rests with the owners of land
through which it flows (riparian owners). Where a
watercourse is incorrectly mapped or not mapped at
all, owners may be unaware of their responsibilities.
Different agencies often assume that others are
responsible for such assets, and as a result appropriate
maintenance regimes are not in place. Many of these
assets are critical structures with a high impact of
failure. They should be subject to regular inspection
and have adequate investment plans for their
maintenance and eventual replacement. More
immediately, culverts often have grilles at their inlets
and outlets which can become easily blocked, or
debris causes a blockage within the culvert,
potentially leading to flooding.
Poor understanding of flood risk – culverted
sections of watercourse may drain large, upstream
catchments that extend far beyond the urban area.
Such a situation may not be clear from drainage
records and if it is not appreciated, can lead to
understatement of the flood risk as well as concealing
potential upstream solutions to flooding. A recent
study on drainage capacity relating to the surface
water drainage system around the Mill Hill Circus
junction in London by Transport for London (TfL) is
a good example of this. During periods of medium to
heavy rainfall, the Mill Hill Circus roundabout floods
Moran, T., Valappil, S. and Harding, D.
Identifying the Impact of Human Made Transformations of Historical Watercourses and Flood Risk.
DOI: 10.5220/0006672701730179
In Proceedings of the 4th International Conference on Geographical Information Systems Theory, Applications and Management (GISTAM 2018), pages 173-179
ISBN: 978-989-758-294-3
Copyright
c
2019 by SCITEPRESS – Science and Technology Publications, Lda. All rights reserved
173

in three different areas. These flooded areas spread
across lane 1, 2 and a footway (Transport for London,
2014).
Differing legislature and flood risk management –
different asset types are governed by various pieces
of legislation, which give design criteria for flood risk
management and define stewardship responsibilities
for agencies. Floods in urbanised areas have a greater
impact due to the exclusion of rivers in those areas.
The watercourses have been substituted by sewers
which are not designed to convey intense rainfall as
effectively as flood defences would be. Also, whilst
rivers have a degree of protection against
development with regard to flood risk, developers and
property owners have right to connect to sewers,
regardless of flood risk.
Funding – funding for different types of drainage
comes from multiple sources e.g. Sewerage
investment is funded from customer bills, while land
drainage comes from a combination of local taxes and
levies and central government grants. If an asset is
assigned to the wrong owner, they may not be able to
access funds to maintain it. An example of a
watercourse that encapsulates all of the issues is the
Caterham Bourne, a chalk-fed river that flows from
the North Downs, into South London. Much of its
length is culverted and different culverts are variously
mapped as ordinary watercourses, main rivers or as
sewers (Surrey County Council, 2015). During a
recent severe flood event, there was considerable
dispute over responsibility for the different culverts,
leading to delays in clearing blockages and the
prolonging of the significant traffic disruption, caused
by the flooding. In the subsequent investigation into
the flooding, the different legal statuses of culverts
meant the different agencies applied different
thresholds of risk, since their origins are not clear.
This is hampering the development of a coherent
flood alleviation strategy and is an obstacle to
identifying funding for investment.
Deculverting (or daylighting) these watercourses
can instigate advantages including ecological
benefits, reduced flood risks, recreation for local
communities and a stimulus for regeneration. The
evidence for these impacts are sparse, however these
are the opportunities that present themselves when
considering daylighting the watercourses.
2 METHODOLOGY
To identify the culverted watercourses many datasets
will need to be used including LiDAR data, historical
maps, asset data, and the river network. The potential
culverts can then be drawn on GIS and plans can be
put in place to ensure they receive the correct
maintenance. This section outlines the datasets used
and the mapping of the lost rivers through GIS.
2.1 GIS Asset Data
This dataset included:
Gravity sewers
Invert levels
Manholes
Operational sites
Sewer end items
During analysis, gravity sewer coverage was the
most useful with surface water sewers being
identified as the most likely candidates for being
culverts. Of these sewers, pipes with a large
(>500mm) diameter were seen to have a higher
probability.
The following sewer types were included in the
analysis:
Surface (S)
Storm Overflow (SO)
Other (O)
Sewer end types were also thought to be useful. The
dataset was filtered to include only those that had
notes in the watercourse attribute or which had
“inlet”, “outfall” or “culvert” in the comments.
2.2 Historical Mapping
Datasets from around 1840 and 1935 were provided
by the National Library of Scotland and were
available at various scales; enabling identification of
field boundaries. Rivers and watercourses were
digitised from this mapping where they were present
on the mapping but not on the EA main river network
layer. Some smaller watercourses were also identified
as the Ordinance Survey (OS) labelled them with
flow direction.
2.3 EA Main River Network
This data was in the form of a shapefile showing the
centroids of the main river channels as defined by the
EA. The dataset shows both currently exposed
watercourses and a number of culverted rivers.
However, there did not seem like there was particular
logic as to which of these covered watercourses were
mapped, and the provenance of the data is
unavailable.
GISTAM 2018 - 4th International Conference on Geographical Information Systems Theory, Applications and Management
174
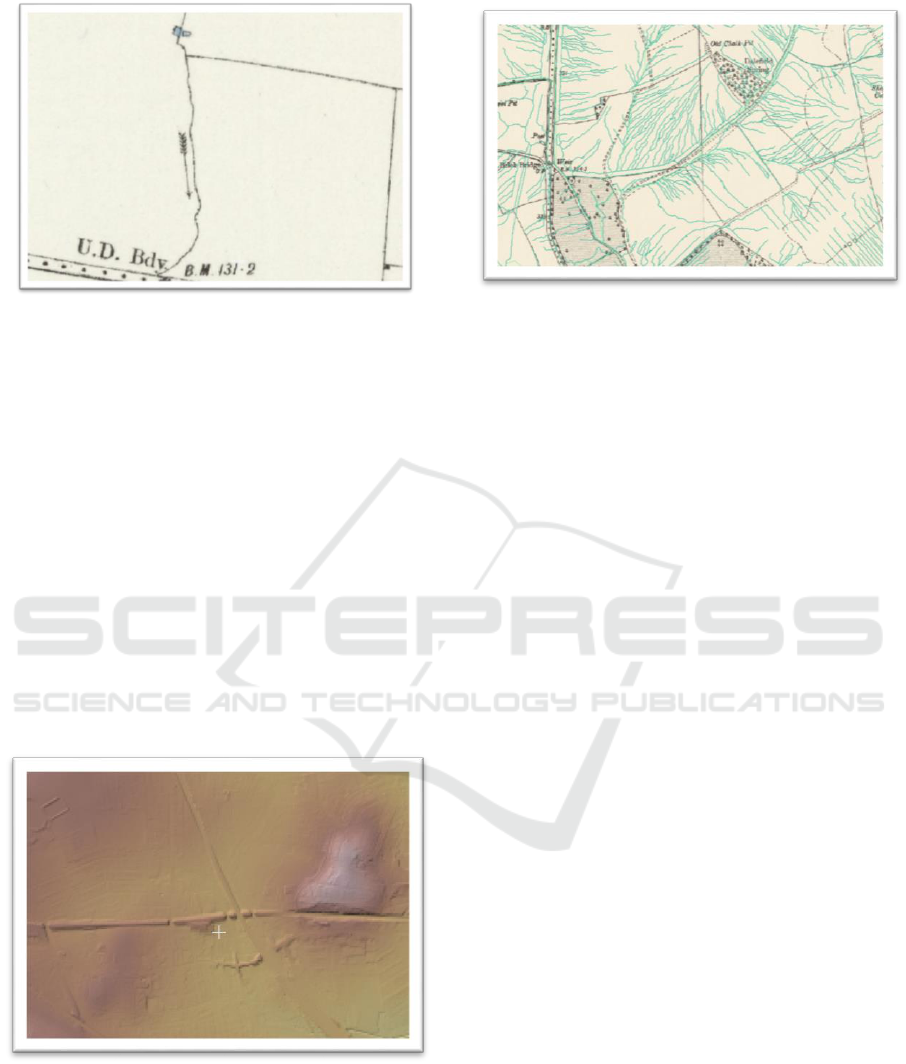
Figure 1: 1:10,500 mapping showing flow direction arrow.
2.4 EA Lidar Data
This dataset recently became open data, but the
quality and resolution of the available data was
variable. However, the 2m digital terrain model
(DTM) data was selected to be utilised as it was
adequate for picking out drainage channels and it also
provided the most complete coverage.
The data is supplied in ESRI ASCII format (.asc
files) in 10km by 10km tiles. These were converted in
Quantum GIS (QGIS) to ERDAS IMAGINE format
(.img files) and mosaicked to form a seamless dataset
over the study area. This data was run through an
automated drainage extraction routine in QGIS since
the data is inherently noisy and a number of man-
made features interfere with the natural drainage
patterns (roads, railways etc.)
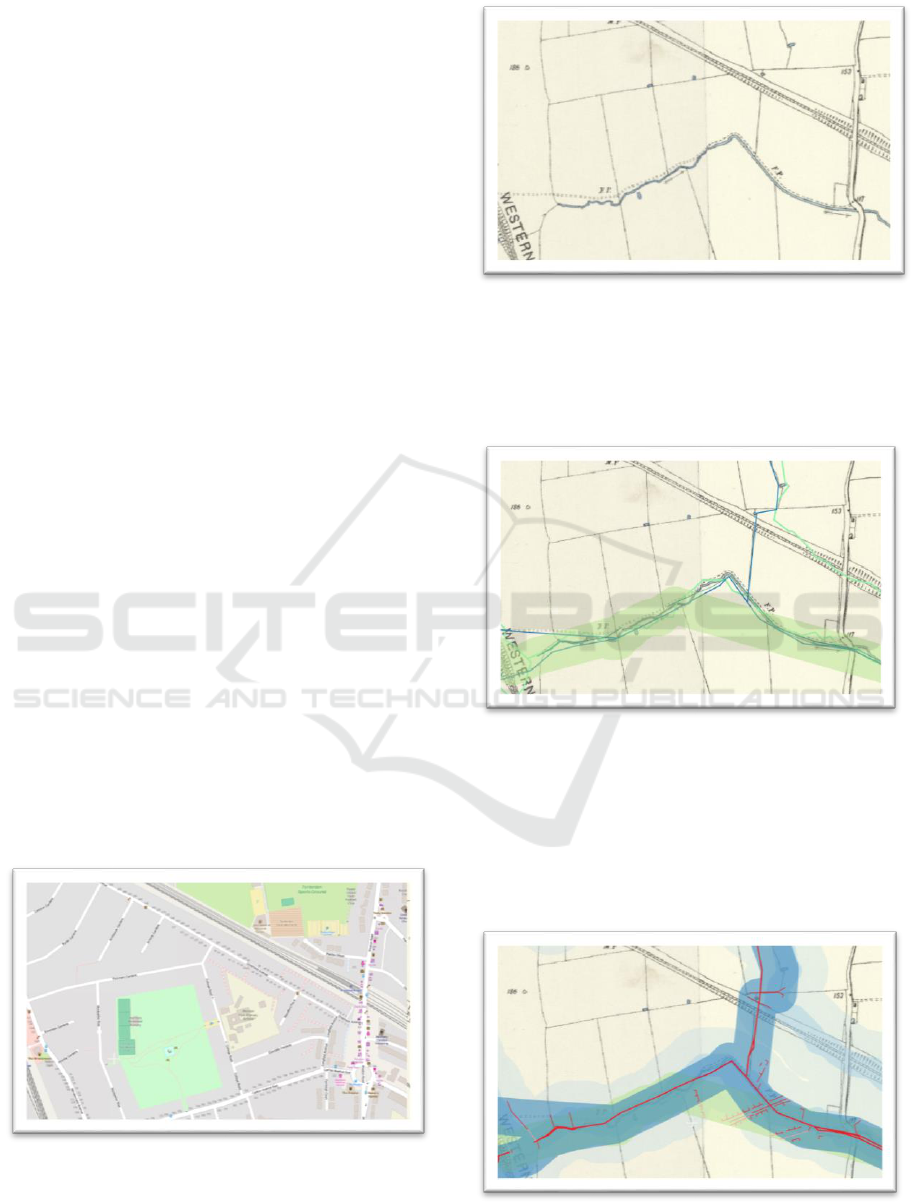
Figure 2: Cuttings and embankments in the EA DTM.
However, this is true of all DTM products. The
full resolution 2m DTM was found to give a dense
network of drainage, far too detailed for the purpose.
Figure 3: Detailed drainage from 2m DTM overlain on
1900 1:10,500 mapping.
3 GIS ANALYSIS
It was decided to reduce the scale of the DTM to 10m
resolution and use thinning and cleaning techniques
to produce the final drainage output from the EA
LiDAR data.
The 2m DTM was resampled to 10m, then the dataset
was run through the r.watershed routine in QGIS. The
parameters applied to the dataset include:
Minimum size of exterior watershed basin:
100
Maximum length of surface flow: 0
Convergence factor for MFD: 5
Beautify flat areas – selected
The process produced a raster output with pixels
of varying value tracing the drainage pathways. This
was then run through a thinning routing (r.thin in
QGIS) that removed excess pixels from the drainage,
outputting a single pixel path for the drainage. The
raster dataset was then converted to shapefile by the
r.to.vect routine in QGIS.
This still resulted in a fairly complex drainage
pattern, so in order to simplify it a little more a
cleaning routine was run to remove dangling vectors
under 100m in length. It was then run through the
v.clean routine in QGIS using rmdangle as the
cleaning tool and 100 as the threshold. A considerably
simplified drainage output was the result of this
process.
It was clear that the watercourses digitised from
the 1900 historical mapping were the primary
indicator of potential lost rivers. A number of large
diameter surface water sewers were observed closely
following the course of the original watercourses and
these became high confidence targets.
Identifying the Impact of Human Made Transformations of Historical Watercourses and Flood Risk
175
3.1 Buffer Zones
As the sewers did not exactly follow the original
watercourses, it was necessary to add a buffer zone
around the line of the watercourses. A buffer of 50
meters was used for the historical rivers and EA river
network in order to include those sewers that run
parallel to the original watercourse. This figure was
derived from trial and error so as to include known
targets.
As the EA LiDAR drainage was less well defined,
two buffer zones of 30m and 100m were used; the
first to capture high probability targets and the second
to capture lower probability targets.
3.2 Sewer end Items
Sewer end items that include a watercourse name or
“inlet, “outfall” or “culvert in the comments were
felt to be indicative of natural drainage. These were
filtered from the original dataset, buffered to 10m to
ensure intersection with the sewer network and then
used to select output vectors from the 100m buffered
EA LiDAR drainage dataset.
3.3 Lost Rivers Model
The model was constructed in ERDAS IMAGINE
Spatial Modeller (Sterling Geo, 2016).
3.3.1 Examples
The following demonstrates some of the features
found in this investigation.
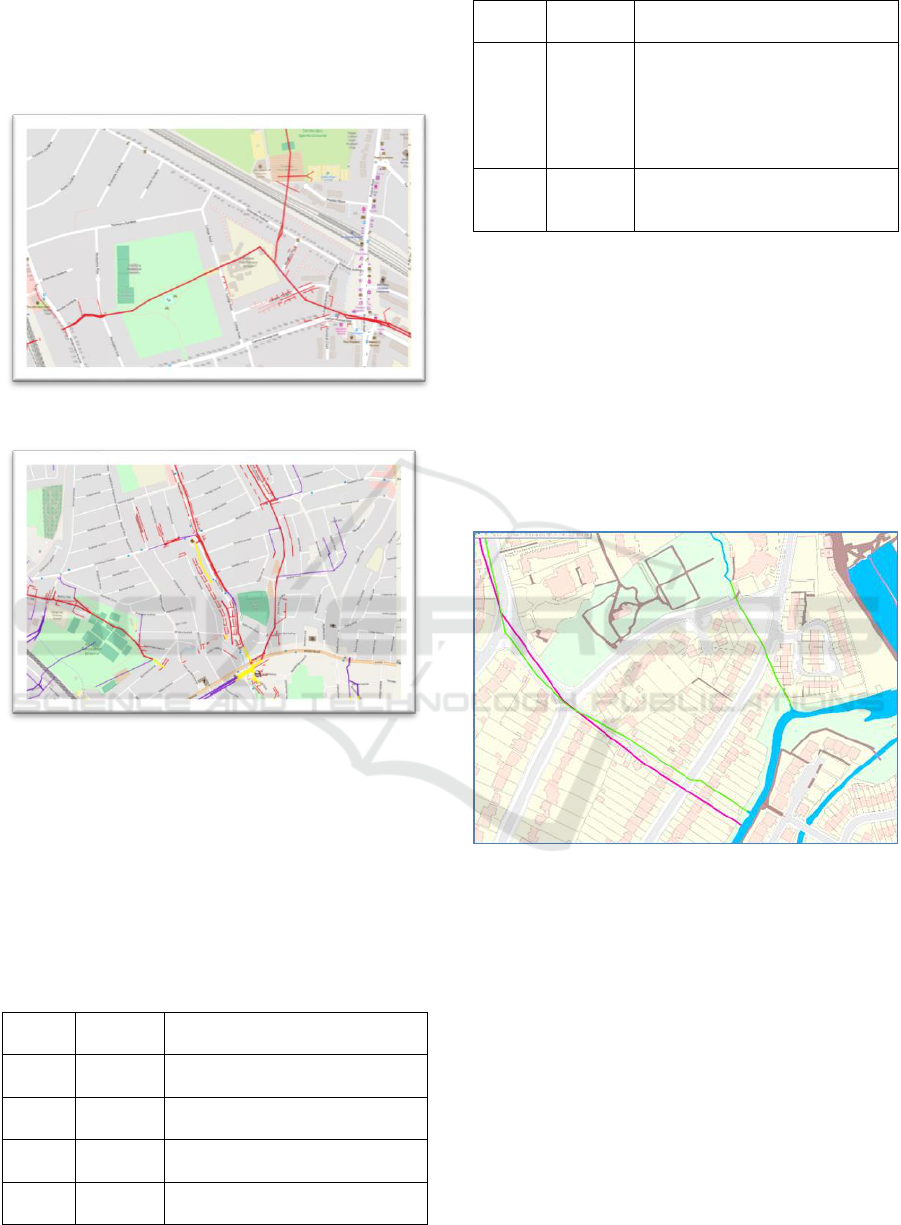
Firstly, here is the OpenStreetMap (OSM) data
over an area in West London, where there is no trace
of surface watercourses:
Figure 4: OSM of an area with no surface watercourses.
And this is what the same area looked like around
1900:
Figure 5: OS 1:10,500 Historical Mapping.
Now, the digitised drainage (blue line), the EA
river buffer (green shading) and the drainage
extracted from the EA LiDAR (green line) can be
overlaid.
Figure 6: Overlay showing extracted drainage.
It is clear that the EA LiDAR drainage follows the
river quite well, but the railway interferes with the
drainage path. The EA main river network is mostly
good, but it cuts a corner on the 1900 river path.
This matches up to the filtered sewer network in
the following way:
Figure 7: Overlay of drainage buffers and sewer network.
GISTAM 2018 - 4th International Conference on Geographical Information Systems Theory, Applications and Management
176
The large (>300 diameter) sewers (thick red line)
in this instance provide a close match to the digitised
drainage network, with the smaller diameter sewers
not relevant.
Figure 8: Target high probability sewers over OSM.
Figure 9: Sewer end targets in yellow.
In other areas, a high concentration of sewer end
targets (figure 9 in yellow) may also be an indicator
of former watercourses.
3.4 Output
The following seven shapefiles were produced:
Table 1: Shapefiles in order of probability of being a
culverted sewer.
Group
Diameter
of sewer
Data used
P7
>300mm
Within 50m of the digitised rivers
from historical mapping.
P6
>300mm
Within 50m of the EA Main River
Network.
P5
<300mm
Within 50m of the digitised rivers
from historical mapping.
P4
>300mm
Within 30m of the drainage network
extracted from EA LiDAR DTM.
P3
<300mm
Within 50m of the EA Main River
Network.
P2
>300mm
Within 100m of the drainage
network extracted from EA LiDAR
DTM that also intersect with the
filtered sewer end
outfall/inlet/culvert/watercourse
points.
P1
>300mm
Within 100m of the drainage
network extracted from EA LiDAR
DTM.
These criteria proved to be too broad and
identified over 1023km of pipes as culverted
watercourses, out of the 5245km of pipe in the trial
area of North London. Therefore, we decided to use
the digitised rivers from historical mapping along
with the EA main river network to perform further
analysis. Also included was the whole gravity sewer
network in the trial area, filtered so only surface (S)
and surface overflow (SO) with diameter over
300mm were considered. These pipes were then
classified as “highly likely”, “possible” and “not
likely” to be a culverted sewer in the following way:
Figure 10: Example of highly likely culverted watercourses.
A sewer (green) connecting two watercourses
(blue) or following closely to the digitised lost river
(pink) were classed as “highly likely” if the diameter
is greater than 600mm, or “possible” if between
300mm and 600mm.
In addition, when an Ordinance Survey (OS)
watercourse ends but the EA river network continues,
the sewers connected to this have been classed as
possible. See figure 11 for a “possible” watercourse
shown in orange:
Identifying the Impact of Human Made Transformations of Historical Watercourses and Flood Risk
177
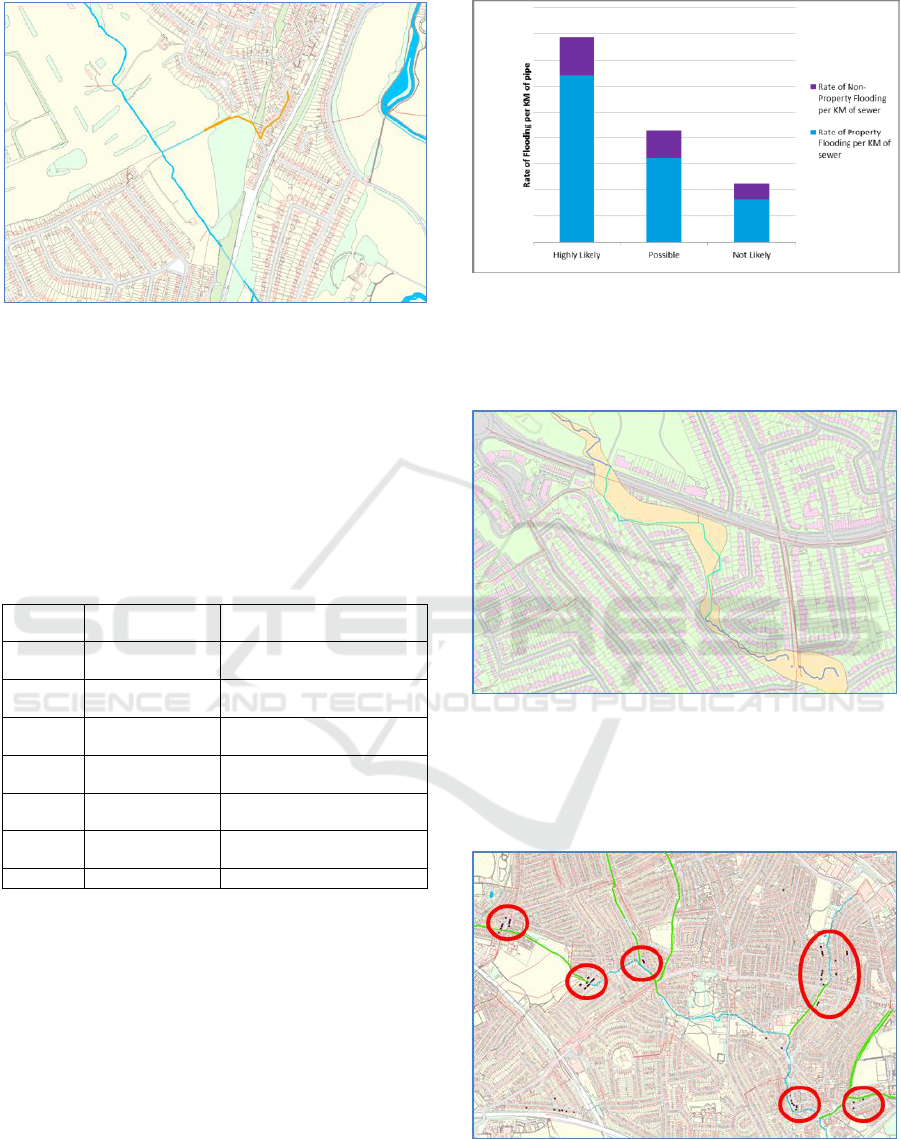
Figure 11: Example of a possible culverted watercourse.
All other surface and storm overflow sewers
greater than 300mm are classed as “not likely”. Since
some of these watercourses were not all connected
but had the same GISID, it was necessary to
categorise the lost rivers by a letter (describing its
likelihood due to positioning) and a number (detailing
the rivers connected ID). The details of the categories
are as follows:
Table 2: Category description.
Category
Probability of being
a culverted sewer
Sewer description
(After Manual Checking)
A
Possible
Between two watercourses and
likely.
B
Highly Likely
Between two watercourses and
highly likely.
C
Possible
Follows the path of a lost river
and likely.
D
Highly Likely
Follows the path of a lost river
and highly likely.
E
Possible
End of EA river network and
likely.
F
Highly Likely
End of EA river network and
highly likely.
(none)
Not Likely
None of the above.
4 FLOOD RISK
Analysis was carried out to identify areas of culverted
sewer flooding using 70 years of surface water
flooding data and 16 years of hydraulic flooding data.
4.1 Results
The rate of “highly likely” watercourses flooding is
much greater than the rate of “possible” and “not
likely” watercourses flooding.
Figure 12: Rate of flooding per kilometre of pipe.
Figure 13 shows a site where “highly likely”
culverted watercourses (green) have the same
flooding patterns (beige) as water features (blue).
Figure 13: Similarities in flooding patterns between
culverted watercourses and water features.
Figure 14 shows an area with hydraulic sewer
flooding (brown points circled in red) due to
culverted watercourses (green):
Figure 14: Example of hydraulic flooding due to
watercourses.
GISTAM 2018 - 4th International Conference on Geographical Information Systems Theory, Applications and Management
178

5 CONCLUSIONS
Through spatial modelling and analysis we have
produced a lost river map in North London and
identified 83 “highly likely” culverted watercourse
sites, 12 of these were found to have had hydraulic
sewer flooding in the last 8 years. In addition, 47
“possible” culverted sewer sites were found, 5 of
which had hydraulic sewer flooding in the last 8
years.
There are some obvious examples of where pipes
have been culverted and have the same flooding
patterns as rivers. There is also evidence to suggest
that culverted watercourses are flooding at a higher
rate than non-culverted watercourses. Further work
has been planned to complete the lost river mapping
and identification of culverted sewers across the
London area to aid future investigations into the
flooding risk of other culverts.
More field trials are required to evaluate the asset
characteristics and structural conditions of these
assets. At those sites, engagement with all relevant
agencies will occur to explore the issues and options
surrounding the ownership of the assets and
responsibility for their stewardship. Observations
from this exercise will be incorporated into a draft
template for establishing stewardship regimes at
similar, high-risk sites.
REFERENCES
Transport for London (2014) – Report on “A1 Mill Hill
Circus – Capacity Study”. Report Submitted by
AECOM to Transport for London.
Surrey County Council (2015) – Report on “S19 Flood
Investigation - The Caterham Bourne, London”.
Sterling Geo (2016) – Report on “Mapping Lost Rivers”,
Submitted to Thames Water Utilities Limited.
CIWEM (2007) – Policy Position Statement on
Deculverting of Watercourses. Chartered Institution of
Water & Environmental Management, London.
Wild, T., Bernet, J., Westling, E., Lerner, D., Water and
Environment Journal 25 (2011) – p412-421.
Identifying the Impact of Human Made Transformations of Historical Watercourses and Flood Risk
179
