
Energy Efficiency Policies for Smart Digital Cloud Environment
based on Heuristics Algorithms
Awatif Ragmani, Amina El Omri, Noreddine Abhgour, Khalid Moussaid and Mohamed Rida
Department of Mathematics and Computer Science, Faculty of Sciences, University Hassan II, Casablanca, Morocco
Keywords: Cloud Computing, Energy Efficiency, Scheduling, Load Balancing, Metaheuristics, Greencloud.
Abstract: The Cloud computing model is based on the use of virtual resources and their placement on physical servers
hosted in the different data centers. Those data centers are known to be big energy consumers. The allocation
of virtual machines within servers has a paramount role in optimizing energy consumption of the underlying
infrastructure in order to satisfy the environmental and economic constraints. Since then, various hardware
and software solutions have emerged. Among these strategies, we highlight the optimization of virtual
machine scheduling in order to improve the quality of service and the energy efficiency. Through this paper,
we propose firstly, to study energy consumption in the Cloud environment based on the GreenCloud
simulator. Secondly, we define a scheduling solution aimed at reducing energy consumption via a better
resource allocation strategy by privileging data center powered by clean energy. The main contributions of
this paper are the use of the Taguchi concept to evaluate the Cloud model and the introduction of scheduling
policy based on the simulated annealing algorithm.
1 INTRODUCTION
The last decade has perceived an important expansion
of Cloud computing due to its practical and economic
aspect. However, this growth goes with a tremendous
increase in energy consumption. Indeed, Cloud
computing services require huge data center that
consumes energy in order to provide the necessary
elasticity and scalability to their customers. In 2011,
Google has announced that its energy consumption
was around 2,675,898 MWh (Aschberger and
Halbrainer, 2013). More globally, the quantity of
electricity used by data centers has been estimated at
around 1.5% of the world's total electricity
consumption. As depicted in Figure 1, only 15% of
the energy utilized by a data center is used for
computing purposes which open a wide scope for
possible energy efficiency solutions. In addition, only
40% of the energy is distributed to IT equipment
which includes computer servers and communication
equipment; while 60% of the energy is distributed
between the cooling system and the system of energy
distribution. In summary, the Gartner team has
identified that energy expenditure is equivalent to
almost 10% of current data center operational
expenditure (OPEX) and tends to increase over the
next decade to nearly 50% (Kliazovich et al., 2013a).
Thus, it is essential to rationalize the energy
consumption while guaranteeing the highest level of
quality of service for the customer. Based on the
previous findings, it becomes clear that alternative
solutions must be found in order to curb this
exponential growth. Currently, the two most applied
concepts for energy saving in computer systems are
Dynamic Power Management (DPM) and Dynamic
Voltage and Frequency Scaling (DVFS). The first
concept is based on a dynamic management of
frequency and voltages according to the level of
performance required. The second concept allows us
to turn off or put on standby the inactive servers.
However, both of these concepts have some
shortcomings in terms of performance. Through this
article, we introduce a new strategy to analyze and
optimize the energy efficiency within a data center
based on Taguchi concept and metaheuristics
algorithms. The main motivation behind this article is
the evaluation of the parameters that have the most
influence on energy efficiency in order to propose
smart policies able to reduce energy losses in a data
center.
In summary, the problem of energy efficiency in a
data center can be dealt with at two levels. The first
354
Ragmani, A., El Omri, A., Abghour, N., Moussaid, K. and Rida, M.
Energy Efficiency Policies for Smart Digital Cloud Environment based on Heuristics Algorithms.
DOI: 10.5220/0006671403540363
In Proceedings of the 8th International Conference on Cloud Computing and Services Science (CLOSER 2018), pages 354-363
ISBN: 978-989-758-295-0
Copyright
c
2019 by SCITEPRESS – Science and Technology Publications, Lda. All rights reserved

Figure 1: The distribution of energy consumption.
level is the quality of the hardware used in the data
center, notably the category of servers and the
typology of the network. The second level includes
all data management procedures including
scheduling, load balancing, virtual machine
migration, fault tolerance, and security strategies. The
optics of concentrating the virtual machines on a
smaller number of servers is motivated by the fact that
an idle server consumes two-thirds of its maximum
consumption and the last tier fluctuates linearly with
the processes in process of treatment (Zhou et al.,
2015). In other words, an efficient planning strategy
ensures the consolidation of virtual machines within
a smaller number of physical servers and enables
power to be removed from the rest of the servers
(Sosinsky, 2011; Velte et al., 2010). The rest of paper
is organized as follows: Section 2, summarizes the
research works which have tackled the issues of
scheduling and energy efficiency within a distributed
computing system. Section 3 introduces the state of
art and background to evaluate the energy efficiency
of Cloud environment. Section 4 describes the
problem statement, the methodology applied to
evaluate the energy within the Cloud and, the
proposed scheduling strategies for virtual machines
allocation. Finally, conclusions are strained in
Section 5.
2 RELATED WORK
In recent years, the energy efficiency of a data center
has been of major importance. Several research
studies have addressed this issue from diverse points
of view in order to propose different solutions to
enhance the energy efficiency of Cloud data center.
Particularly, the authors of (Chinnici and Quintiliani,
2013) introduced an evaluation methodology of
energy saving which has been carried out following
the replacement of a set of components by more
energy efficiency mechanisms. The concept proposed
by the authors was put in place to match a
comprehensive strategy to encourage the adoption of
energy efficiency policies in developing countries. In
addition, the authors (Zhou et al., 2015) proposed a
solution called (TESA) for deploying virtual
machines to optimize the energy efficiency of a large-
scale data center. This solution is based on the linear
relationship between energy consumption and
resources use. The TESA solution suggests migrating
virtual machines hosted by hyper-loaded machines to
less-loaded machines. In addition, the authors
introduced five types of virtual machine selection
policies. Another study (Marotta and Avallone, 2015)
pointed out the positive impact of the application of
strategies based on the consolidation of virtual
machines on the waste of energy in data centers. The
proposed solution is based on the principles of
migrating virtual machines in order to reduce the
number of active servers while guaranteeing the best
cost-quality compromise. The main contribution of
this study lies in the introduction of a machine
consolidation model inspired by the simulated
annealing algorithm. The proposed algorithm is based
on calculating the attractiveness value of virtual
machine migrations by having several input
parameters. The defined solution allows outlining the
list of virtual machines migration by reducing the
power consumption of the active servers. The
research paper (Guzek et al., 2013) defines a holistic
model of a data center of the Cloud. The introduced
model describes Cloud applications, physical
machines, and virtual machines through the
description of parameters such as memory and
storage. The model was tested within the well-known
GreenCloud simulator. The authors announce that the
proposed model improves the accuracy of the
simulations. The authors also plan to develop in the
future a new module for managing the migration of
virtual machines. The authors of (Sarji et al., 2011)
tackle the static analysis of a server before proposing
two models of energy management in order to ensure
the energy efficiency in the Cloud computing
environment. The operating principle of these models
allows analyzing the state of the system before
deciding on the migration of the virtual machines
from one physical node to another. Then, the
proposed system turns the idle servers off or on
standby. The two strategies proposed by the authors
are differentiated by the energy consumed and the
start-up time of a server previously put into standby
or off mode. Thus, the authors leave the choice to the
system administrator to select the level of energy
efficiency or the response time required by the SLA.
In the research study (Beloglazov et al., 2012), the
authors proposed to use heuristic solutions to
Energy Efficiency Policies for Smart Digital Cloud Environment based on Heuristics Algorithms
355

guarantee energetic efficiency combined with a
suitable level of quality of service. This study
includes an analysis of existing solutions and
possibilities for optimizing energy while taking into
account quality of service constraints. The authors of
the research paper (Aschberger and Halbrainer,
2013), announce that the processing of a task or the
processing of a virtual machine has different impacts
on the consumption of energy within the Cloud
environment. They stated that task management is
more compatible with energy saving because many
parameters are known in advance such as CPU usage
and execution time. This last parameter allows
predicting the moment when a resource becomes free
again. On the other hand, the authors indicate that
virtual machines could be allocated to physical
machines without specifying the end date of the
virtual machine which could continue to exist as long
as the client pays the created instance. Finally, the
authors of the research paper (Canali et al., 2017)
stressed the complexity of the minimization of energy
consumption within the data center and the aspect of
separating the solutions used from the IT and
communication aspects. The authors specify that this
separation has a negative impact on energy efficiency
in the data center. As a result, they introduce a
powerful model that takes into account both aspects
of machine allocation management, which improves
energy efficiency. The proposed model embraces
three advantages, including the consideration of data
traffic exchanges between virtual machines, the
modeling of the energy consumption relating to the
virtual machine migration, and finally the
consideration of several weighting parameters in the
process of allocating virtual machines. The authors
confirm that the proposed schema has outperformed
previous approaches of virtual machine allocation in
terms of energy efficiency. In summary, we
emphasize the disparity of approaches used by
researchers to reduce the energy consumption of data
centers, which raises the problem of finding the most
efficient solution and the possibility of combining
several solutions for an even better energy efficiency
while respecting the quality of service requirements.
3 PRELIMINARIES
3.1 Virtual Machine Migration
The virtualization has opened diverse possibilities to
share memory and processor resources in order to
create virtual machines that can support query
processing. Nowadays, virtualization is widely
applied in Cloud data centers for the purpose of
directing physical resources through partitioning,
consolidation, and isolation. Primarily, virtual
machine migration is used to allocate and reassign
resources by moving an application from one server
to another server with better technical characteristics
such as power, memory, or power consumption (Jin
et al., 2011; Marotta et al., 2018). The virtual machine
migration policy includes the procedure for triggering
the virtual machine migration process, the
identification procedure for the target virtual
machine, and the procedure of selecting a destination.
First, the triggering procedure specifies the nature of
the migration functions. The target virtual machine
identification procedure allows the selection of
machines that need to migrate for security or
performance reasons. Finally, the destination
selection procedure is applied to identify the
destination servers that will host the virtual machines
to migrate (Li et al., 2013). Live virtual machine
migration is the set of procedures for moving a
functional virtual machine from one host server to
another using the applied virtualization solution.
Finally, the migration improves load balancing, IT
maintenance and fault tolerance (Sallam and Li,
2014).
3.2 GreenCloud Simulator
GreenCloud is a Cloud simulation platform focused
on the various technical aspects of data centers and
which has proved its worth in recent years, notably in
terms of energy efficiency evaluation. This
simulation platform has been developed on the basis
of the ns-2 simulator. It allows configuring the
typology of the network, the energetic configurations
as well as other parameters of the Cloud environment
Through its graphical interface, it is possible to define
an infinite number of scenarios (Kliazovich et al.,
2012). Following each simulation GreenCloud
generates a detailed report of the energy consumption
by kind of component. Particularly, GreenCloud
offers the possibility of configuring several
scheduling strategies in order to compare their
performance. The main strength of GreenCloud
remains its flexibility to complete detailed analyzes
of the workload within the data center while insisting
on the simulations of packet communications. The
simulator presents four network topologies already
defined. In addition, GreenCloud offers the
possibility to define custom topologies. The
GreenCloud simulator takes into account several
three-tier data center architectures such as DPillar,
DCell, BCube, and FiConn. This three-tier
CLOSER 2018 - 8th International Conference on Cloud Computing and Services Science
356
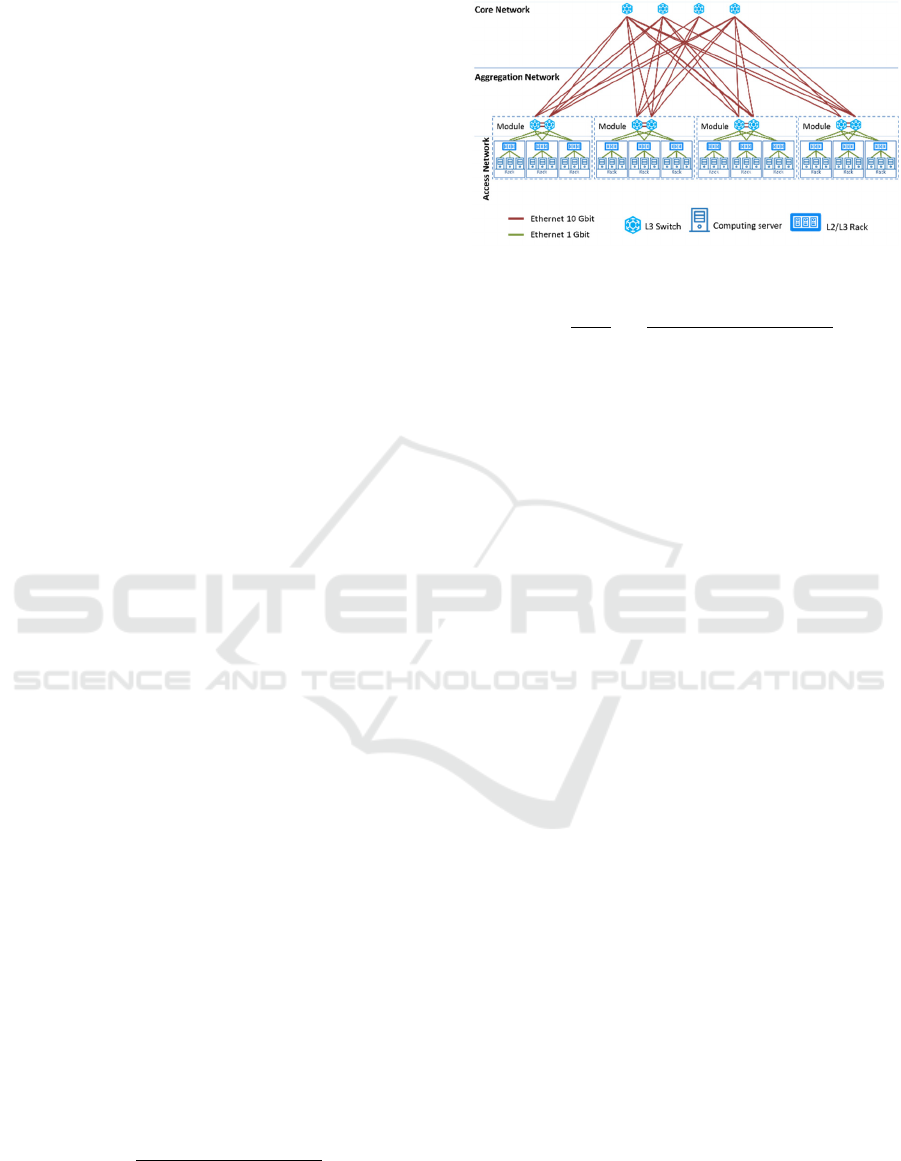
architecture (see Figure 2) includes the core level, the
aggregation level that handles routing, and the access
level which manages servers in racks Each rack can
take up to 48 servers. Note that interconnections
between the servers are achieved via 1 Gigabit
Ethernet links. The simulator assumes that an inactive
server consumes nearly two-thirds of its peak load,
and the remaining tier varies with the workload of the
server. Moreover, the power consumption of the
network switches is matched to the port transmission
rate, the type of switch, number of ports, and cabling
solutions used (Guzek et al., 2013).
4 PROPOSED SOLUTION
4.1 Problem Statement
Through this article, we strive to analyze the
optimization of energy efficiency in the Cloud. Based
on the benchmarks and conclusions of the earlier
research papers summarized in the related works
section, it emerges that the most effective approach to
ensure an energy saving policy is the minimization of
the number of the running servers. However, reducing
the number of physical machines cannot be done
without impacting the performance of Cloud
applications. In other words, the techniques currently
applied reduce the energy consumed but increase the
response time of the system. However, Cloud
customers expect to have a responsiveness of services
as close as when using local services. In addition, the
principle of elasticity of the Cloud requires that
resource planning policies should be flexible, both
upward and downward. It is therefore essential to
define intelligent algorithms capable of managing the
creation and removal of virtual machines in such a
way as to respect both the energy saving constraint
and the response time constraint. In addition,
considering the environmental impact of a data
center, we propose to introduce a parameter relating
to the nature of the energy used in order to give an
advantage to a data center which uses renewable
energies. The evaluation of the energy consumed in
the data center is carried out on the basis of several
key performance indicators. Particularly, the Green
Grid consortium has established two indicators which
are power utilization efficiency (PUE) and data center
infrastructure efficiency (DCiE), summarized below:
=
(1)
Figure 2: GreenCloud three-tier architecture.
=
1
=
×100
(2)
and are calculated based on the ratio of
the total amount of energy consumed by the data
center to the amount of energy consumed by the IT
equipment. The indicator is the inverse of the
and is written as a percentage. Thus, a
value close to 100% means that the data center does
not waste a lot of energy and can be defined as
efficient. In brief, the improvement of energy
efficiency in the Cloud environment is achieved by
reducing the sum of the energy consumed by the data
center components at different activity levels
(standby, full load, power off ...). Based on the
various studies considered, the components of the
data center has been classified into three categories:
IT equipment which includes servers and network
equipment, cooling equipment and power distribution
equipment (Aschberger and Halbrainer, 2013). The
evaluation of energy efficiency in data centers first
requires the identification of the elements that
consume electrical energy according to the different
levels of workload. As depicted in Figure 1 and
according to the formula (3), the energy consumed is
a function of time and can be represented as an
integral part of the energy consumption function over
a period of time. Thus, the energy consumption of a
data center (DC) which has nodes, between an
instant 1 and 2 is calculated according to the
equations below:
=()×
(3)
=(
+
+P
)−
(4)
=(P
+
+P
)×∆−E
(5)
Energy Efficiency Policies for Smart Digital Cloud Environment based on Heuristics Algorithms
357

Where
is the average power of the IT equipment,
is the average power of the cooling system,
is the average power of distributing system, and
is the energy produced by whole data center
components such as the heat produced by the servers
and reused in the air conditioning systems or to warm
water.
=
+
+
(6)
= (
+
+
+
)
(7)
Where
is the energy consumption of the
nodes of the data center,
is the power
consumed by the whole switching components, and
includes the energy consumption of the
auxiliary parts as well as the energy loss. According
to (Chinnici and Quintiliani, 2013), the energy
consumed related to CPU depends on the load of the
node and could be expressed as below:
=
×
(
)
×
(
ℎ
)
×
(8)
In summary, all studies agree that suspending and
activating servers according to the workload in the
data center remains the most efficient method of
ensuring overall energy efficiency including
equipment which ensures the proper functioning of a
data center. Nevertheless, continuous modification in
power modes causes significant delays. In addition,
the solution must take into account the case of the
inability to wake up a dormant server by quickly
making available another inactive server that can
receive a request without impacting the quality of
service. Further research works (Sarji et al., 2011)
have confirmed the importance of the operating
system (OS) layer in the process of setting up inactive
devices and thereby improving energy efficiency.
Lastly, the use of the technique (DVFS) to change the
server voltage in order to decrease the energy
consumed without violating SLA requirements is also
a technique that has proved its worth. However,
having a narrow number of statuses that can be
scheduled on the basis of the frequency and voltage
of the data combined to the fact that it is not adapted
to the other elements of the data center limits the gain
that can be derived from the DVFS technique. Thus,
we aim through this article to evaluate the energy
efficiency by applying the concept of Taguchi.
4.2 Problem Analysis Methodology
In order to evaluate the main factors which could
impact the energy efficiency of a data center, we have
used the GreenCloud simulation platform and the
performance analysis methodology which has been
defined in a previous paper (Ragmani et al., 2016a).
The main idea of the proposed methodology is to
describe a complex system by means of a set of inputs
that represent the most influential factors and outputs
that translate the key performance indicators (see
Figure 3) instead of evaluating all the system’s
components. Then, the Taguchi experiment plans are
used to study complex technical problems by
analyzing the various parameters that could influence
the effectiveness of the system. The performance to
analyze is represented by one or more responses such
as the response time and the energy consumed.
Experiment plans make it possible to evaluate the
parameters responsible for the variations of each
response. In short, the Taguchi experiment plan is a
set of trials arranged in advance so as to identify in a
minimum of manipulations and with a maximum of
precision the influence of multiple parameters on one
or more responses. The success of the performance
analysis approach according to the Taguchi concept
depends on the respect of the following steps:
Formalize the problem to study by defining the
influential factors and key performance;
Select the parameters, define their variation
levels and select their interactions;
Build the experiment plan according to the
Taguchi tables;
Carry out the tests;
Analyze the results;
Conclude after choosing the setting parameters
that can be controlled and achieve the
confirmatory test.
The applied Taguchi plans depend on the number
of modalities per parameter as well as the number of
interactions (Taguchi et al., 2005). Parameters are
assigned to columns taking into account interactions
and parameters that are difficult to modify. In our
case, we have 19 factors including 7 factors with two
levels and 12 factors with 3 levels. These parameters
correspond to the simulation variables defined by the
GreenCloud simulator and which make it possible to
describe the simulation scenarios. But the simulator
does not identify which parameter has the most
influence on the energy efficiency and also what
value must each parameter take in order to have the
best energy consumption. For these reasons, we have
performed this analysis. The description of the factors
CLOSER 2018 - 8th International Conference on Cloud Computing and Services Science
358

and their level is presented in Table 1. According to
the Taguchi tables predefined in the Minitab toolkit
and based on the number of factors, we have applied
the L36 matrix which corresponds to 36 trials. The
results are analyzed according to two complementary
modes. On the one hand, the graphical analysis that
allows representing the influence of the parameters
and their interactions. On the other hand, the
statistical analysis of the variance aims to separate, in
the global variations of the answer, the part due to the
real influence of the parameters of the part due to
chance. In brief, each factor of the inputs can take
several values identified by levels (see Table 2).
These values may be quantitative or qualitative (see
Table 1). The Taguchi method relies on the
calculation of the signal-to-noise ratio (SNR) in order
to rank factors based on their influence. According to
this concept, the optimization of outputs could be
achieved by minimizing the function described in the
equation (9).
SNR
=−10log
y
N
(9)
Where : experiment number; : trial number; Ni:
Number of trials for experiment and
: performance
representative measurements per trial.
The performance evaluation cannot be done
without key indicators that ensure an objective
assessment of the various technical and economic
aspects of a system. Thus, we have selected five key
performance indicators that include the switches
energy consumed by the core level, the switches
energy consumed by the aggregation level, the
switches energy consumed by the access level, the
energy consumed by servers, and the total energy
consumed the whole system.
Figure 3: A summarized view of Cloud model parameters.
Table 1: The factors values per level.
Level
Energy
Management
Network
Switches
Virtualization Simulation Setup
Host DVFS
Hosts Dynamic
shutdown
Net Switch DVFS
Dynamic shutdown
Shutdown/ wake up
time
(
s
)
DVFS
VM static
configuration
Datacenter Load
Task Scheduler
A B C D E F G H I
1 Yes Yes Yes Yes 0.01 Yes Yes 0.3 Green
2 No No No No 0.05 No No 0.4 Round Robin
3 - - - - - - - 0.5 Best DENS
Level
Datacenter Topology Task Description
Topology
Core to
a
gg
re
g
ation
Aggregation to
access
Access to host
Task size (MIPS)
Task memory
Task storage
Task description
size (bytes)
Task execution
deadline (s)
Task output
(Bytes)
J K L M N O P Q R S
1 T1 10 10 1 30 10 30 8.5 5 25
2 T2 100 15 5 35 15 35 9.0 10 30
3 T3 50 20 10 40 20 40 9.5 15 35
Where T1 is three-tier topology, T2 is three-tier high-speed and
T3 is three-tier heterogonous small
Moreover, these indicators make it possible to
evaluate the effectiveness of the various scheduling
algorithms. The first measure studied is the total
energy consumption by the physical resources of a
data center caused by the workload of the application.
the choice of model parameters including influencing
factors and key performance indicators was guided by
the possibilities allowed by the GreenCloud
simulator.
5 SIMULATION AND RESULTS
Through this article, we intend to evaluate the energy
efficiency of the Cloud model and to introduce a
solution of scheduling of the virtual machines while
respecting the energy efficiency aspect and the
response time aspect. In order to properly target the
actions to be undertaken, we proceed in the first place
to analyze the operation of the Cloud model through
the GreenCloud simulation platform. As announced,
we have carried out 36 simulations according to the
L36 Taguchi matric. During these experiments, we
have used three data center topologies. The first
topology used is a three-tier architecture which
includes 1536 servers organized into 512 racks as
Energy
Management
Network
Switches
Virtualization
Simulation
setup
Data center
Topo lo gy
Task
Description
Cloud
system
Simulation
duration
Switch Energy
(core)
Switch Energy
(agg.)
Switch Energy
(access)
Server Energy
Data center
load
Average Tasks
per server
Output
Input
Energy Efficiency Policies for Smart Digital Cloud Environment based on Heuristics Algorithms
359

well as 8 cores and 64 switches. The second topology
is a three-tier high speed which consists of 1536
servers and 2 cores and 256 switches. The last
topology applied is three-tier heterogeneous small
which consists of 288 servers organized in 48 racks,
2 cores, and 3 switches. Several conclusions have
emerged from the various simulations carried out (see
Table 3) and the analysis of the signal-to-noise ratio
(see Tables 4-7). Thereby, the first observation is that
the energy consumed depends strongly on the applied
topology.
Table 2: The Taguchi experience matrix L36.
Trials A B C D E F G H I J K L M N O P Q R S
1 1 1 1 1 1 1 1 1 1 1 1 1 1 1 1 1 1 1 1
2 1 1 1 1 1 1 1 2 2 2 2 2 2 2 2 2 2 2 2
3 1 1 1 1 1 1 1 3 3 3 3 3 3 3 3 3 3 3 3
4 1 1 1 1 1 2 2 1 1 1 1 2 2 2 2 3 3 3 3
5 1 1 1 1 1 2 2 2 2 2 2 3 3 3 3 1 1 1 1
6 1 1 1 1 1 2 2 3 3 3 3 1 1 1 1 2 2 2 2
7 1 1 2 2 2 1 1 1 1 2 3 1 2 3 3 1 2 2 3
8 1 1 2 2 2 1 1 2 2 3 1 2 3 1 1 2 3 3 1
9 1 1 2 2 2 1 1 3 3 1 2 3 1 2 2 3 1 1 2
10 1 2 1 2 2 1 2 1 1 3 2 1 3 2 3 2 1 3 2
11 1 2 1 2 2 1 2 2 2 1 3 2 1 3 1 3 2 1 3
12 1 2 1 2 2 1 2 3 3 2 1 3 2 1 2 1 3 2 1
13 1 2 2 1 2 2 1 1 2 3 1 3 2 1 3 3 2 1 2
14 1 2 2 1 2 2 1 2 3 1 2 1 3 2 1 1 3 2 3
15 1 2 2 1 2 2 1 3 1 2 3 2 1 3 2 2 1 3 1
16 1 2 2 2 1 2 2 1 2 3 2 1 1 3 2 3 3 2 1
17 1 2 2 2 1 2 2 2 3 1 3 2 2 1 3 1 1 3 2
18 1 2 2 2 1 2 2 3 1 2 1 3 3 2 1 2 2 1 3
19 2 1 2 2 1 1 2 1 2 1 3 3 3 1 2 2 1 2 3
20 2 1 2 2 1 1 2 2 3 2 1 1 1 2 3 3 2 3 1
21 2 1 2 2 1 1 2 3 1 3 2 2 2 3 1 1 3 1 2
22 2 1 2 1 2 2 2 1 2 2 3 3 1 2 1 1 3 3 2
23 2 1 2 1 2 2 2 2 3 3 1 1 2 3 2 2 1 1 3
24 2 1 2 1 2 2 2 3 1 1 2 2 3 1 3 3 2 2 1
25 2 1 1 2 2 2 1 1 3 2 1 2 3 3 1 3 1 2 2
26 2 1 1 2 2 2 1 2 1 3 2 3 1 1 2 1 2 3 3
27 2 1 1 2 2 2 1 3 2 1 3 1 2 2 3 2 3 1 1
28 2 2 2 1 1 1 1 1 3 2 2 2 1 1 3 2 3 1 3
29 2 2 2 1 1 1 1 2 1 3 3 3 2 2 1 3 1 2 1
30 2 2 2 1 1 1 1 3 2 1 1 1 3 3 2 1 2 3 2
31 2 2 1 2 1 2 1 1 3 3 3 2 3 2 2 1 2 1 1
32 2 2 1 2 1 2 1 2 1 1 1 3 1 3 3 2 3 2 2
33 2 2 1 2 1 2 1 3 2 2 2 1 2 1 1 3 1 3 3
34 2 2 1 1 2 1 2 1 3 1 2 3 2 3 1 2 2 3 1
35 2 2 1 1 2 1 2 2 1 2 3 1 3 1 2 3 3 1 2
36 2 2 1 1 2 1 2 3 2 3 1 2 1 2 3 1 1 2 3
Indeed, the classification of the most influential
factors on energy efficiency shows that the topology
factor is ranked first for the four indicators studied. In
other words, it is essential to optimize the number of
switches and servers used to handle the different
requests of users. This first observation confirms the
proposals already announced in the first paragraphs
of this article. Moreover, the topology three-tier
heterogonous small is the most efficient on the
energetic level.
Table 3: The simulation results.
Trials
Key Performance Indicators (W*h)
Switch
Energy
(core)
Switch
Energy
(agg.)
Switch
Energy
(access)
Server
Energy
Total
Energy
1 466.10 932.10 1 375.70 3 541.00 6 314.90
2 112.30 493.50 1 480.70 4 001.10 6 087.60
3 59.20 118.50 10.50 425.50 613.70
4 537.20 1 074.40 1 585.80 3 725.40 6 922.80
5 1 033.40 458.50 1 375.70 3 542.30 6 409.90
6 55.30 110.60 9.80 375.50 551.20
7 1 112.30 493.50 1 480.70 3 510.90 6 597.40
8 59.20 118.50 10.50 372.40 560.60
9 466.10 932.10 1 375.70 3 792.40 6 566.30
10 59.20 118.50 10.50 349.60 537.80
11 466.10 932.10 1 375.70 3 542.30 6 316.20
12 1 112.30 493.50 1 480.70 3 698.90 6 785.40
13 51.40 102.80 9.10 309.20 472.50
14 501.60 1 003.30 1 480.70 3 598.50 6 584.10
15 1 191.20 528.50 1 585.80 4 212.50 7 518.00
16 55.30 110.60 9.80 329.30 505.00
17 537.20 1 074.40 1 585.80 3 869.70 7 067.10
18 1 033.40 458.50 1 375.50 3 784.50 6 651.90
19 501.60 1 003.30 1 480.70 3 510.00 6 495.60
20 1 191.20 528.50 1 585.80 3 861.60 7 167.10
21 51.40 102.80 9.10 355.50 518.80
22 1 112.30 493.50 1 480.70 3 510.00 6 596.50
23 51.40 102.80 9.10 341.60 504.90
24 501.60 1 003.30 1 480.70 3 998.50 6 984.10
25 1 112.30 493.50 1 480.70 3 378.00 6 464.50
26 59.20 118.50 10.50 372.60 560.80
27 466.10 932.10 1 375.70 3 789.50 6 563.40
28 1 033.40 458.50 1 375.70 3 159.70 6 027.30
29 55.30 110.60 9.80 352.40 528.10
30 537.20 1 074.40 1 585.80 4 213.60 7 411.00
31 51.40 102.80 9.10 312.80 476.10
32 501.30 1 003.30 1 480.70 3 754.70 6 740.00
33 1 191.20 528.50 1 585.80 4 213.00 7 518.50
34 537.20 1 074.40 1 585.80 3 691.40 6 888.80
35 1 033.40 458.50 1 375.70 3 540.90 6 408.50
36 55.30 110.60 9.80 375.50 551.20
CLOSER 2018 - 8th International Conference on Cloud Computing and Services Science
360

Furthermore, the energy consumed by the servers
keeps the most impact on the total energy consumed
by the data center, hence the obligation to reduce the
number of servers used for processing a batch of
queries. The variance analysis of the server energy
indicator (see Table 7 and Figure 4) indicates that the
topology is a highly influential factor based on the
value of the ratio P which is equal to zero.
Table 4: Factors ranks based on SNR Switch Energy (core).
Factor A B C D E F G H I J
Rank 17 13 15 14 19 18 16 7 3 1
Factor K L M N O P Q R S
Rank 8 10 12 5 11 6 9 2 4
Table 5: Factors ranks based on SNR Switch Energy (agg.).
Factor A B C D O F G H I J
Rank 17 18.5 16 13 4 15 14 8.5 6.5 1
Factor K L M N E P Q R S
Rank 5 11 3 6.5 18.5 10 12 2 8.5
Table 6: Factors ranks based on SNR Switch Energy (acc.).
Factor A B C D O F G H I J
Rank 15 18.5 13.5 17 7 13.5 16 3 9 1
Factor K L M N E P Q R S
Rank 8 11 10 6 18.5 4 12 2 5
Table 7: Factors ranks based on SNR Server Energy.
Factor A B C D E F G H I
Rank 13 5 7 11 6 14 10 2 4
Factor J k L M N O P Q R S
Rank 1 19 16 18 12 15 9 8 3 17
Figure 4: Main Effects Plot for SNR of Server Energy.
The regression analysis allowed us to define the
regression equation (10) of the energy server
indicator. This equation reflects the weight of each
factor in the performance and the impact of each input
on the value of the server energy indicator.
= 5696.69−13.87+
50.26 +25.13 −6.49−52.38+
62.38−50.41+162.82−41.37−
1698.13−16.85−38.38+8.31+
14.0083 + 9.67 +23.63−50.74+
116.90−47.63
(10)
6 PROPOSED ALGORITHM
As depicted in Figure 5, we apply a three-tiered
architecture for the Cloud model studied. This
architecture relies on a combination of several
algorithms including ant colony optimization
(Ragmani et al., 2016b). Through the present article
and following analyses made in the previous
paragraph, we propose an algorithm for scheduling
virtual machines within Cloud by applying a
simulated annealing algorithm.
Figure 5: The proposed Cloud architecture.
Indeed, thanks to its interesting properties of
convergence, we target both to find an optimal
response in a reasonable time. In brief, the simulated
annealing (SA) is inspired by the Metropolis-
Hastings algorithm, which offers the possibility of
modeling a thermodynamic system. This algorithm
relies on a function to be minimized which refers to
the energy in the real process and a temperature
of the system. The variation of the temperature allows
to find out the different intermediary solutions before
reaching the optimal solution. This algorithm starts
with an initial state of the system that will be modified
to reach a new state. Two cases then arise; either the
new state improves the factor to be optimized or it
degrades it. The validation of the state which has
improved the factor to optimize allows us to find an
optimum in the vicinity of the initial state. On the
21
-64,55
-64,60
-64,65
21
-64,55
-64,60
-64,65
21
-64,55
-64,60
-64,65
21
-64,55
-64,60
-64,65
21
-64,55
-64,60
-64,65
21
-64,55
-64,60
-64,65
21
-64,55
-64,60
-64,65
321
-64,0
-64,5
-65,0
321
-64,5
-64,6
-64,7
321
-50
-60
-70
321
-64,58
-64,60
-64,62
321
-64,580
-64,605
-64,630
321
-64,58
-64,60
-64,62
321
-64,55
-64,60
-64,65
321
-64,56
-64,60
-64,64
321
-64,55
-64,60
-64,65
321
-64,55
-64,60
-64,65
321
-64,4
-64,8
-65,2
321
-64,58
-64,60
-64,62
A
Mean of SN ratios
B C D E
F G H I J
k L M N O
P Q R S
Energy Efficiency Policies for Smart Digital Cloud Environment based on Heuristics Algorithms
361
other hand, the acceptance of a bad state induces us
to seek an optimum outside the neighborhood of the
initial state (Chibante, 2010; Marotta et al., 2018).
There are two approaches to the variation of
temperature. The first approach is to keep the system
temperature constant. When the system reaches a
thermodynamic equilibrium, the temperature is
lowered. This approach corresponds to a resolution in
increments of temperature. The second approach is
based on a continuous decrease of the temperature
according to a precise law. The most applied one is
=, where is less than 1. In both approaches,
the algorithm stops at a predefined temperature (see
Figure 6). In our case, we keep the second approach
because it allowed us to achieve better results. The
pseudo-code of the proposed scheduling algorithm is
summarized on Algorithm I. The proposed algorithm
is an application of simulated annealing. This
algorithm uses several inputs including the list of
virtual machines; the available servers, the number of
iterations and the initial temperature. The ultimate
goal is to plan the placement of virtual machines in
the data center servers to minimize power
consumption. The function to be minimized by the
algorithm is the total energy consumed. At each
iteration, the temperature is multiplied by a parameter
α which makes it possible to reduce the temperature.
In order to avoid a rapid convergence to a local
minimum, a random perturbation is applied which
consists in randomly modifying the location of the
machines in order to force the algorithm to look for
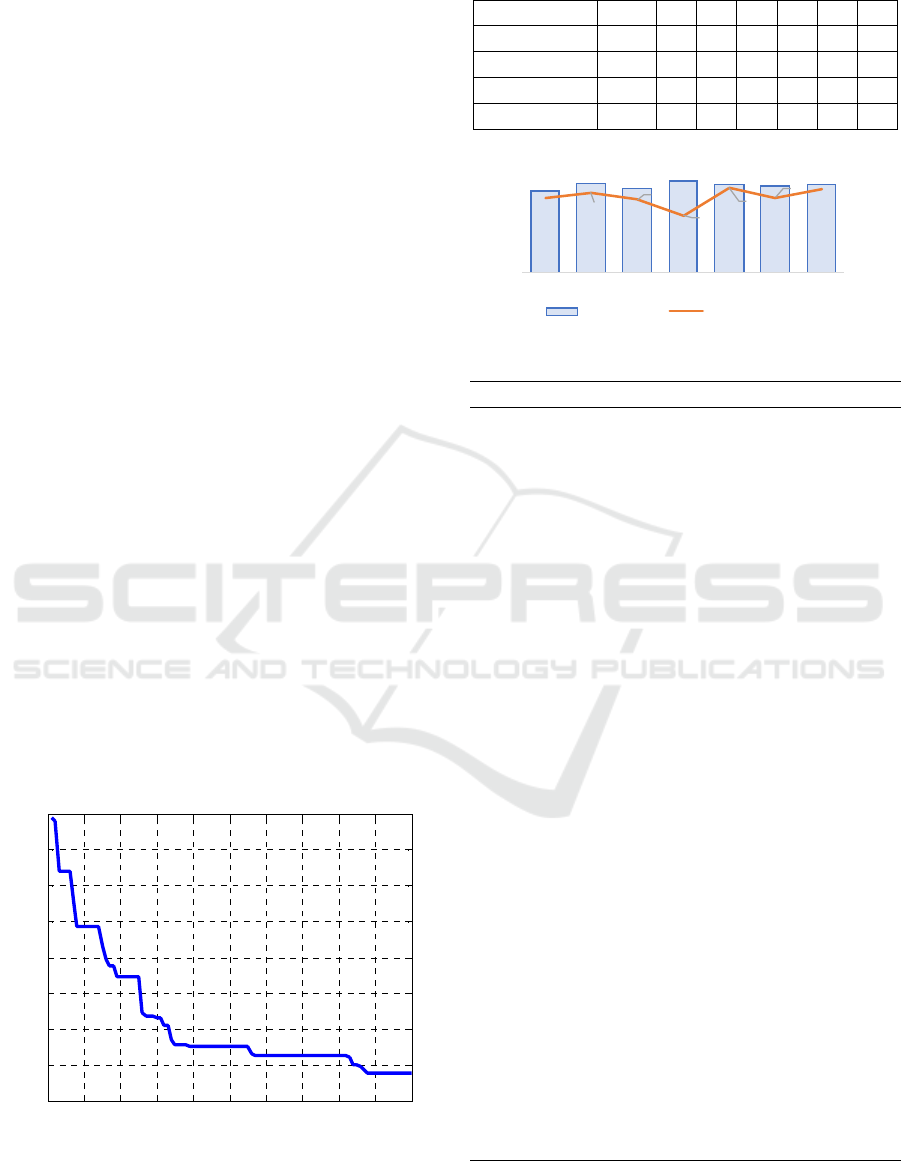
new possibilities. In order to validate the operation of
the proposed algorithm we have configured 22 virtual
machines and 5 servers and before testing several
combinations of parameters in order to identify the
best combination (see Table 8 and Figure 7).
Figure 6: The SA algorithme convergence for M=100,
N=50, T0=50, α= 0.87.
Table 8: SA parameters per combination.
Combination 1 2 3 4 5 6 7
M 100
10
0
10
0
10
0
10
0
20
0
10
0
N 50 50 50 50 50
10
0
50
T0 50 50 20 60
10
0
60 50
α 0.87 0.9 0.9 0.9 0.9 0.9 0.8
Figure 7: Best energy efficiency per configuration.
Algorithm I: SA Algorithm for VM Scheduling.
Inputs: VM list; hosts list;
N: Number iterations of first loop;
M: Number iterations of secondary loop;
T
0
: Initial Temperature; alpha: cooling
rate; G: Indicator of environmental
impact of data center (between 1 for good
data center and 10 for worst one);
Output: VM Allocation per server;
% Initialization
VM.affactation=random(Hosts)
% Replace by Best Solution identified
AllocatedHost= VM.affectation
T=T
0
;
% SA Iterations
For i=1to N
For j=1 to M
Set VM neighbor;
Apply random perturbation;
If AllocatedHostnew.Energy*G ≤
AllocatedHost.Energy
VM.affection = AllocatedHostnew;
else
delta= AllocatedHostnew.Energy
- AllocatedHost.Energy;
=(−/);
if p ≥ random
AllocatedHost = AllocatedHostnew;
End
End
% Save the best Energy Efficiency value
BestEnergyEfficency(i)=AllocatedHost
.Energy;
% Decrease temperature
T=alpha*T;
End
End
0 10 20 30 40 50 60 70 80 90 100
80
100
120
140
160
180
200
220
240
Iteration
Best Energy Efficiency
95
104
99
108
103
101
103
87
94
86
67
100
88
98
1234567
Best En ergy Number of Iteration
CLOSER 2018 - 8th International Conference on Cloud Computing and Services Science
362

7 CONCLUSIONS
In conclusion, through this article, we have pointed
out the importance of energy efficiency in the Cloud
computing environment. Then, we proceed to various
simulations based on the Taguchi concept in order to
evaluate deeply all major aspects of energy
consumption within a data center. Finally, we
introduced a scheduling proposal based on applying
an algorithm inspired by simulated annealing
algorithms in order to guarantee an efficient
scheduling strategy. We have proposed to integrate a
parameter relative to the source of the energy used in
a data center in order to give an advantage to data
center applying environmental standards. The main
characteristic of the proposed method is allowing to
model different responses according to influencing
factors. This knowledge is then used in the
optimization process of the studied system. In future
work, we propose to examine in more detail the
proposed solution within a real Cloud environment in
order to confirm its gain in terms of energy efficiency.
ACKNOWLEDGEMENTS
We express our deep thankfulness to the numerous
anonymous reviewers for their valuable comments.
REFERENCES
Aschberger, C., Halbrainer, F., 2013. Energy Efficiency in
Cloud Computing.
Beloglazov, A., Abawajy, J., Buyya, R., 2012. Energy-
aware resource allocation heuristics for efficient
management of data centers for Cloud computing.
Future Gener. Comput. Syst. 28, 755–768.
Canali, C., Lancellotti, R., Shojafar, M., 2017. A
Computation- and Network-Aware Energy
Optimization Model for Virtual Machines Allocation:
SCITEPRESS - Science and Technology Publications,
pp. 71–81.
Chibante, R., 2010. Simulated annealing, theory with
applications. Sciyo, Rijek, Crotia.
Chinnici, M., Quintiliani, A., 2013. An Example of
Methodology to Assess Energy Efficiency
Improvements in Datacenters. IEEE, pp. 459–463.
Guzek, M., Kliazovich, D., Bouvry, P., 2013. A holistic
model for resource representation in virtualized cloud
computing data centers, in: 2013 IEEE 5th
International Conference on Cloud Computing
Technology and Science (CloudCom), pp. 590–598.
Jin, H., Gao, W., Wu, S., Shi, X., Wu, X., Zhou, F., 2011.
Optimizing the live migration of virtual machine by
CPU scheduling. J. Netw. Comput. Appl. 34, 1088–
1096. https://doi.org/10.1016/j.jnca.2010.06.013.
Kliazovich, D., Arzo, S.T., Granelli, F., Bouvry, P., Khan,
S.U., 2013a. Accounting for load variation in energy-
efficient data centers, in: IEEE International
Conference on Communications (ICC), 2013. IEEE, pp.
2561–2566.
Kliazovich, D., Bouvry, P., Khan, S.U., 2013b. DENS: data
center energy-efficient network-aware scheduling.
Clust. Comput. 16, 65–75.
Kliazovich, D., Bouvry, P., Khan, S.U., 2012. GreenCloud:
a packet-level simulator of energy-aware cloud
computing data centers. J. Supercomput. 62, 1263–
1283. https://doi.org/10.1007/s11227-010-0504-1.
Li, D., Wang, W., Li, Q., Ma, D., 2013. Study of a Virtual
Machine Migration Method. IEEE, pp. 27–31.
https://doi.org/10.1109/CBD.2013.33.
Marotta, A., Avallone, S., 2015. A Simulated Annealing
Based Approach for Power Efficient Virtual Machines
Consolidation. Presented at the 2015 IEEE 8th
International Conference on Cloud Computing, IEEE,
New York, USA, pp. 445–452.
Marotta, A., Avallone, S., Kassler, A., 2018. A Joint Power
Efficient Server and Network Consolidation approach
for virtualized data centers. Comput. Netw. 130, 65–80.
Ragmani, A., El Omri, A., Abghour, N., Moussaid, K.,
Rida, M., 2016a. A global performance analysis
methodology: Case of cloud computing and logistics,
in: 3
rd
International Conference (GOL), 2016. IEEE,
Fes Morocco, pp. 1–8.
Ragmani, A., El Omri, A., Abghour, N., Moussaid, K.,
Rida, M., 2016b. A performed load balancing algorithm
for public Cloud computing using ant colony
optimization, in: 2
nd
International Conference
(CloudTech 2016). IEEE, Marrakech, Morocco, pp.
221–228.
Sallam, A., Li, K., 2014. A Multi-objective Virtual
Machine Migration Policy in Cloud Systems. Comput.
J. 57, 195–204. https://doi.org/10.1093/comjnl/bxt018.
Sarji, I., Ghali, C., Chehab, A., Kayssi, A., 2011.
CloudESE: Energy efficiency model for cloud
computing environments, in: 2011 International
Conference on Energy Aware Computing (ICEAC).
IEEE, pp. 1–6.
Sosinsky, B.A., 2011. Cloud computing bible. Wiley ; John
Wiley [distributor], Indianapolis, IN : Chichester.
Taguchi, G., Chowdhury, S., Wu, Y., Taguchi, S., Yano,
H., 2005. Taguchi’s quality engineering handbook.
John Wiley & Sons ; ASI Consulting Group, Hoboken,
N.J. : Livonia, Mich.
Velte, A.T., Velte, T.J., Elsenpeter, R.C., 2010. Cloud
computing a practical approach. McGraw-Hill, New
York.
Zhou, Z., Hu, Z., Song, T., Yu, J., 2015. A novel virtual
machine deployment algorithm with energy efficiency
in cloud computing. J. Cent. South Univ. 22, 974–983.
Energy Efficiency Policies for Smart Digital Cloud Environment based on Heuristics Algorithms
363
