
Problem-based Elicitation of Security Requirements
The ProCOR Method
Roman Wirtz
1
, Maritta Heisel
1
, Rene Meis
1
, Aida Omerovic
2
and Ketil Stølen
2
1
University of Duisburg-Essen, Duisburg, Germany
2
SINTEF Institute, Oslo, Norway
Keywords:
Risk Management, Security, Requirements Engineering, Problem-based, Model-based.
Abstract:
Security is of great importance for many software systems. The security of a software system can be com-
promised by threats, which may harm assets with a certain likelihood, thus constituting a risk. All such risks
should be identified, and unacceptable risks should be reduced, which gives rise to security requirements.
The relevant security requirements should be known right from the beginning of the software development
process. Eliciting security requirements should be done in a systematic way. We propse a method to elicit
security requirements that address unacceptable risks. They require a reduction of the risk to an acceptable le-
vel. Our method combines the CORAS risk management method with Jackson’s problem-based requirements
analysis approach. Based on the functional requirements for a software system, security risks are identified
and evaluated. Unacceptable risks give rise to high-level security requirements. To reduce the risk, treatments
are selected. Based on the selected treatments, concretized security requirements are set up and represented in
a similar way as functional requirements. Thus, both functional and security requirements can then drive the
software development process.
1 INTRODUCTION
In a connected world, almost every piece of software
may be subject to attacks. Such attacks can cause
great harm to enterprises and individuals. Almost
every week, media report on attacks against public
or private organizations. Therefore, software should
be developed with security issues in mind. Neverthe-
less, organizations can only spend a limited amount
of resources on security. These resources should be
spent in a way that maximizes return on investment,
i.e., that provides the best possible protection against
attacks.
In this paper, we describe a risk-based method to
elicit security requirements. Given the functional re-
quirements for a software system, possible threats to
security and the corresponding risks are identified and
evaluated. A risk is determined by two factors: the
likelihood of the threat leading to harm of an asset,
and the severity of the harm, i.e., the consequence.
For each identified risk, it has to be determined if it
is acceptable or not. Only unacceptable risks need
to be treated, thus leading to corresponding security
requirements for the software system to be develo-
ped. Moreover, our method supports the selection of
treatments that are suitable to achieve the necessary
risk reduction. The result of our method is a set of
functional and corresponding security requirements
that form the basis for the subsequent software de-
velopment process.
Our method is model-based, so that the results
of the risk analysis can be smoothly integrated in
a model-based software development process. The
name of the method is ProCOR – Problem-based CO-
RAS, because it combines parts of the model-based
risk management method CORAS (Lund et al., 2010)
with Jackson’s problem frames approach (Jackson,
2001). Functional requirements expressed using pro-
blem diagrams (according to the problem frames ap-
proach) form the starting point of the risk analysis.
The elicited security requirements are expressed in a
similar way, using a new kind of diagram, called treat-
ment problem diagram. The so enhanced requirement
model forms the starting point for a software develop-
ment that adequately balances functionality and secu-
rity.
The paper is structured as follows: In Section
2, we explain problem frames and CORAS in more
detail before introducing our running example in
Section 3. In Section 4, we discuss all steps of the
26
Wirtz, R., Heisel, M., Meis, R., Omerovic, A. and Stølen, K.
Problem-based Elicitation of Security Requirements.
DOI: 10.5220/0006669400260038
In Proceedings of the 13th International Conference on Evaluation of Novel Approaches to Software Engineering (ENASE 2018), pages 26-38
ISBN: 978-989-758-300-1
Copyright
c
2019 by SCITEPRESS – Science and Technology Publications, Lda. All rights reserved
ProCOR method in detail. The paper concludes with a
discussion of related work in Section 5 and an outlook
on an evaluation we plan for our method in Section 6.
2 BACKGROUND
In this section, we introduce necessary background
knowledge. Our proposed method is mainly based on
the two concepts of Problem Frames and CORAS.
2.1 Problem Frames
To model requirements, we make use of Michael
Jackson’s problem frames (Jackson, 2001) that can be
expressed using diagrams as shown in Figures 3 and
4. Problem frames are patterns to describe subpro-
blems of a complex software development problem
in the early stages of the software development life-
cycle. An instance of such a pattern is called pro-
blem diagram and contains a functional requirement
(dashed ovals) for the system-to-be. A requirement is
an optative statement which describes how the envi-
ronment of the software should behave when the soft-
ware is in action. The entities related to a requirement
are represented as domains (rectangles). There are
different types of domains: biddable domains (e.g.,
persons), causal domains (e.g., technical equipment),
machine domains (representing the software to be
developed, rectangle with vertical bars) and lexical
domains (data representations). There are symbolic
phenomena, representing some kind of information or
a state, and causal phenomena, representing events,
actions, operations and so on. Each phenomenon is
controlled by exactly one domain and can be obser-
ved by other domains. A phenomenon controlled by
one domain and observed by another is called a shared
phenomenon between these two domains. Interfaces
(solid lines) contain sets of shared phenomena. Such a
set contains phenomena controlled by the same dom-
ain (indicated by A!{...}, where A is an abbreviation
for the controlling domain). Some domains are refer-
red to by a requirement (dashed line) via some phe-
nomena, and at least one domain is constrained by a
requirement (dashed lines with arrowhead) via some
phenomena. The domains and their phenomena that
are referred to by a requirement are not influenced by
the machine, whereas we build the machine to influ-
ence the constrained domain’s phenomena in such a
way that the requirement is fulfilled.
Faßbender et al. describe a way to draw problem
diagrams with regard to security, so that no domain
is left out which might be relevant for the analysis
(Faßbender et al., 2014).
2.2 CORAS
CORAS (Lund et al., 2010) is a model-based met-
hod for risk management. It consists of a step-wise
process and different kinds of diagrams. The met-
hod follows the ISO 31000 risk-management standard
(ISO, 2009). Each step provides guidelines for the in-
teraction with the customer on whose behalf the risk
management activities are carried out and how to add
the results to the model using the CORAS language.
The method starts with the establishment of the con-
text and ends up with the suggestion of treatments to
address the risk.
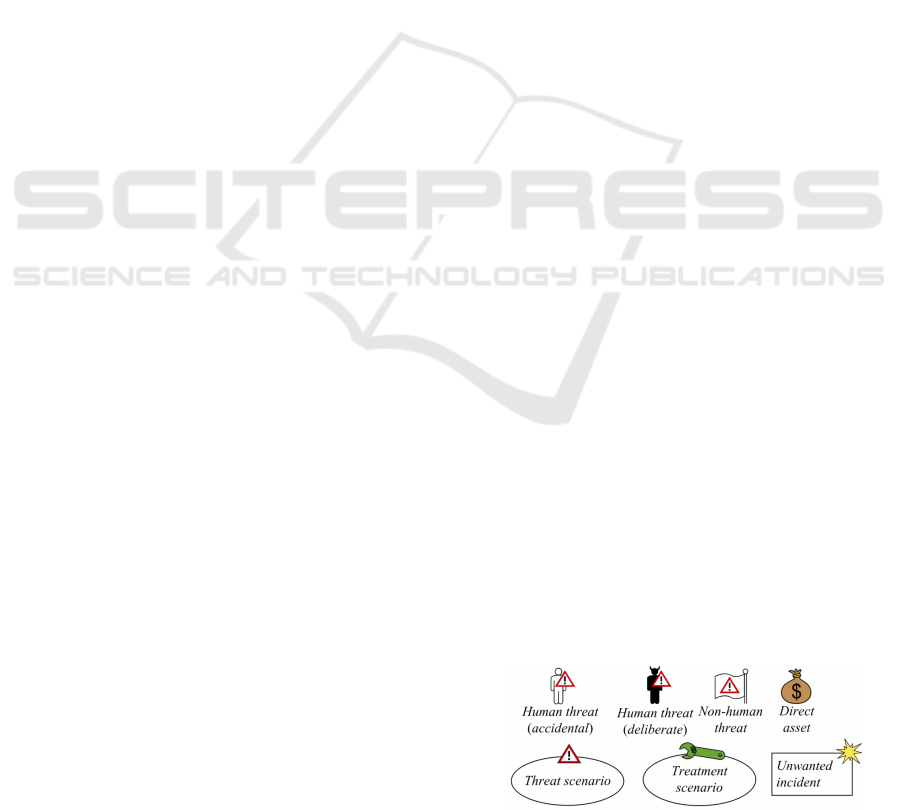
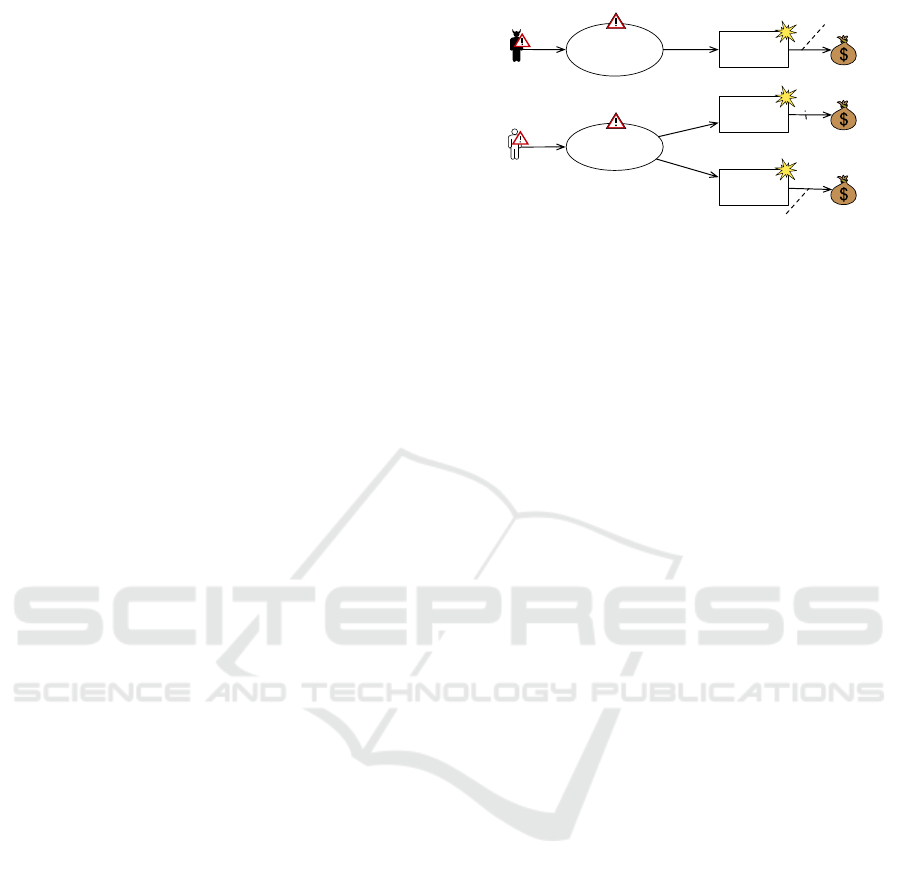
The CORAS language consists of several ele-
ments. In this work, we make use of the following
ones: Direct Assets are items of value. There are
Human-threats deliberate, e.g. a network attacker,
as well as Human-threats accidental, e.g. an em-
ployee pressing a wrong button accidentially. To des-
cribe technical issues Non-human threats are used,
e.g. power loss of a server. A Threat scenario des-
cribes a state, which may possibly lead to an unwan-
ted incident, where an Unwanted incident describes
the action that harms an asset. Risk is defined as the
combination of a likelihood and a consequence accor-
ding to ISO 31000 (ISO, 2009). In CORAS, the like-
lihood of an unwanted incident which harms an asset
and the consequence on the asset is used to derive a
risk. Treatment scenarios are used to describe coun-
termeasures to reduce the risk. The symbols we make
use of in CORAS diagrams are shown in Figure 1.
The relations between CORAS and problem fra-
mes we developed for this work are described in
Section 4.1, using a conceptual model.
3 CASE STUDY
To exemplify out method, we use a running example
for which we apply the different steps of the ProCOR
method.
The running example is a subsystem of a smart
grid system inspired by the OPEN meter project
(OPEN meter Consortium, 2009). A smart grid is
an intelligent power supply network, in which diffe-
rent participants are able to interact and control the
Figure 1: CORAS Language (Lund et al., 2010).
Problem-based Elicitation of Security Requirements
27
Unwanted Incident
Threat Scenario
Threat
initiates
leads to
Asset
Consequence
Risk
Likelihood
harms
has a
Security
Requirement
aims to
protect
High-Level SR
!addresses
Concretized
SR
!specifies
Treatment
implemented
by
Requirement
Functional
Requirement
Domain
applied at
refers to
constrains
associated with
associated with
CORAS elements Problem Frames ProCOR
reduction
for
Phenomenon
related to
*
*
*
*
*
*
*
* *
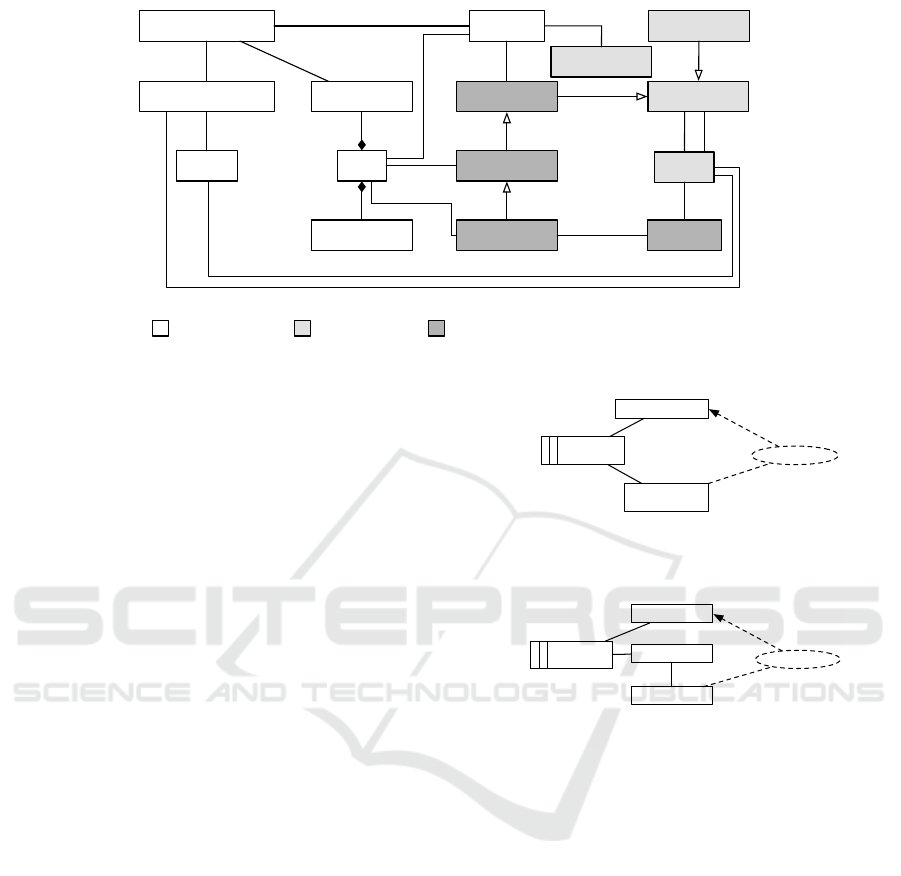
Figure 2: ProCOR Conceptual Model.
grid. For example, it is possible to retrieve the me-
asurements of the power consumption remotely. In
the following, we describe the main components of
the scenario. The system-to-be (i.e., the machine) is
the Communication Hub. It serves as the connection
between all other components and actors and is used
to perform some calculations, e.g. to provide invoi-
ces to the customer for consumed energy. Smart Me-
ters measure the consumption of energy with sensors.
They are connected to the Communication Hub using
a local metrological network (LMN) which might be
wired or realized with a wireless connection. The
Energy supplier is the provider of the smart grid. It
is able to do an initial setup locally on the communi-
cation hub to be able to initiate a remote connection
for later interaction. The End customer is the one
who pays the energy supplier’s invoices and in whose
home the communication hub is installed.
In this paper, we focus on two functional require-
ments:
Setup: The energy supplier performs an initial setup
for the communication hub. The personal data of the
client and tariff parameters are stored in a configura-
tion. Figure 3 shows the problem diagram for Setup.
The requirement refers to a phenomenon of Energy-
Supplier and constrains a phenomenon of Configura-
tion.
Measuring: In given intervals, the communication
hub receives measured data from smart meters and
stores it persistently. Figure 4 shows the problem dia-
gram for Measuring. The requirement refers to a phe-
nomenon of SmartMeter and constrains a phenome-
non MeterData.
Configuration
Communi-
cationHub
Setup
EnergySuppl
ier
a a
b c
a: ES!{insertConfiguration} b: CH!{storeConfiguration}
c: C!{configuration}
Figure 3: Case study: Problem diagram for Setup.
MeterData
Communi-
cationHub
Measuring
SmartMeter
LMN
a
a
b
c
d
a: SM!{sendData} b: LMN!{forwardData}
c: CH!{storeData} d: MD!{meterData}
Figure 4: Case study: Problem diagram for Measuring.
4 ProCOR METHOD
The ProCOR method consists of five steps. We first
introduce a conceptual model which describes the dif-
ferent terms used in the method and their relations.
Next, we give an overview of the method which is
followed by a detailed description of each step. For
each step, we illustrate the method on the case study
introduced in Section 3.
4.1 Conceptual Model
The conceptual model is shown in Figure 2 as a UML
class diagram. All multiplicities not specifically men-
tioned are considered as 1. The elements contained
in CORAS are drawn in white. The meaning of the
elements has already been described in Section 2.2.
A Threat initiates some Threat Scenarios. Both ele-
ENASE 2018 - 13th International Conference on Evaluation of Novel Approaches to Software Engineering
28

ments are associated with a Domain, which is part
of Jackson’s problem frames terminology. That ter-
minology is shown in light gray. The association is
used to identify risks based on the functional requi-
rements. A Threat Scenario leads to some Unwanted
Incidents. An Unwanted Incident harms some Assets
which is related to a phenomenon with a specific Con-
sequence, which is part of a Risk. A Risk exists for an
Asset. A Likelihood is also part of a Risk. A Requi-
rement can be of type Functional Requirement or Se-
curity Requirement (SR) and refers to and constrains
Domains. A Security Requirement aims to protect an
Asset. A High-Level SR is a specialization and addres-
ses a Risk, whereas a Concretized SR specifies how
the risk is reduced. A Concretized SR is implemented
by some Treatments, which are applied at a Domain.
Thus, a Treatment is used to avoid or mitigate a Threat
Scenario or Threat contained in this Domain.
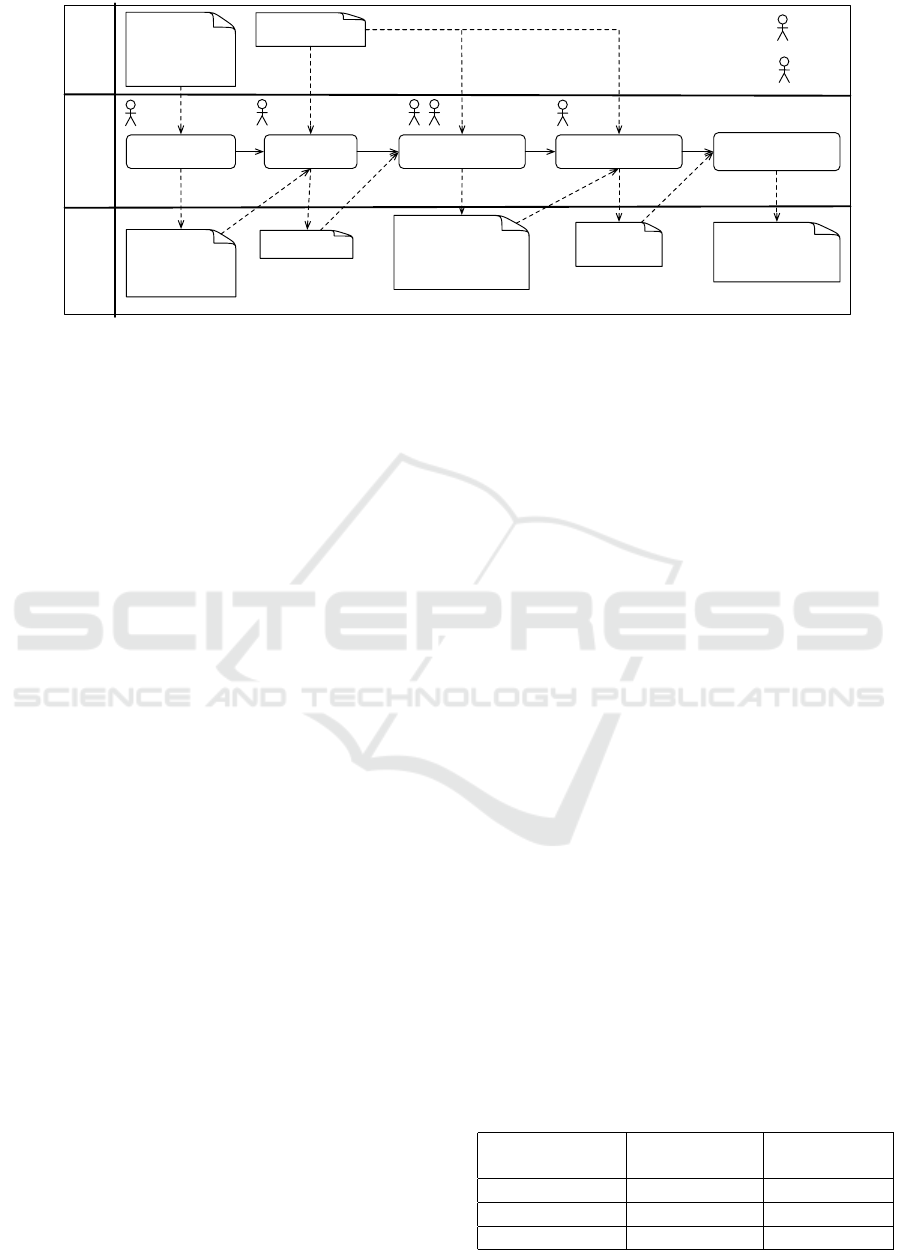
4.2 Overview
Figure 5 provides an overview of the five steps of the
ProCOR method. For each step, we define the neces-
sary external inputs, as well as the outputs. The gene-
rated output serves as an input for the following steps
and can be used for documentation purposes. We dis-
tinguish three stakeholder roles: analysts take part in
each step of the method. Therefore, we do not show
them explicitly in Figure 5. Customers are the ones
on whose behalf the analysts perform the risk analy-
sis. Experts are persons with specific knowledge, e.g.,
about threats.
The method is structured as follows: (1) First, the
scope and focus of the risk analysis are defined, based
on the security goals of the customer and the functi-
onal requirements, which are expressed as problem
diagrams. (2) The risks for the assets are identified
and are documented with a CORAS threat diagram.
(3) To evaluate the risks, likelihoods and consequen-
ces are estimated and annotated in the threat diagram.
For each unacceptable risk, a high-level security re-
quirement is set up. (4) To fulfill the high-level se-
curity requirements, treatments that reduce the risks
are selected. These treatments are evaluated with re-
spect to their costs, which should not be higher than
the value of the asset they protect. The selected treat-
ments are then added to the threat diagram. (5) For
each high-level security requirement, a concretized
security requirement is set up, which reflects the cho-
sen treatments. Finally, for each concretized security
requirement, a treatment problem diagram is set up.
Such a diagram is similar to a problem diagram. It
states which domains are referred to and constrained
when fulfilling the concretized security requirements
using the selected treatment. Thus, security require-
ments can be incorporated in the subsequent software
development process in a similar way as functional
requirements.
In addition, we identified validation conditions for
each step that check the coherence of the results of
each step, thus helping to identify errors in the appli-
cation of the method as early as possible. We give
examples of such validation conditions in the follo-
wing. For reasons of space, we cannot present all of
them.
We now describe each of the above steps in detail.
4.3 Step 1: Definition of Scope & Focus
In the first step, we define the focus (assets to be pro-
tected) and scope (domains which shall be conside-
red) of the analysis.
4.3.1 Description
With ProCOR, we aim to support the protection of
information in a software-based system with regard
to the three security properties confidentiality, inte-
grity and availability. In problem diagrams, informa-
tion is represented by symbolic phenomena, whereas
commands or events are represented by causal pheno-
mena. Hence, we define an asset as a combination of
a symbolic phenomenon and a security property. The
results are documented in a table, such as Table 1. We
also document the value of the asset for the customer
to make it comparable with the costs of a treatment.
The scope of the analysis is defined as the set
of domains where the information to be protected is
available. “Available” means that the domain obser-
ves or controls the symbolic phenomenon represen-
ting the information to be protected, as specified in
the set of problem diagrams that is part of the input
for this step. However, it does not suffice to only
consider symbolic phenomena, because valuable in-
formation can also be part of commands or events,
i.e., causal phenomena. For example, there may be
an interface with a causal phenomenon to store some
user data. This phenomenon is a command, but con-
tains information in form of user data. Hence, it is
necessary to document that a phenomenon is contai-
ned in another to decide whether an interface contains
some information or not.
To document the availability of information at a
domain and the information flow between domains,
we developed the concept of an Information Flow
Graph, which is a directed graph. Its nodes are dom-
ains, and its edges denote the information flowing
from one domain to another. To create this graph, we
consider all interfaces contained in the set of problem
Problem-based Elicitation of Security Requirements
29
Step 1: Definition of
Scope & Focus
- Security goals of
customer
- Problem diagrams
- List of assets
- Information flow
graph
- Domains in scope
Step 2: Risk
Identification
Step 3: Risk Evaluation
& High-Level SR
- Threat expertise
- Threat diagram
- Annotated threat
diagram
- Set of high-level
security requirements
- Risk matrices
Step 4: Treatment
Selection & Evaluation
- Augmented
threat diagram
External
Input
MethodInput/Output
Step 5: Concretized
SR & Treatment
Problem Diagrams
- Set of concretized
security requirements
- Treatment problem
diagrams
C
E
Customer
Expert
C
E E
E
C
Legend:
Figure 5: ProCOR Method Overview.
diagrams. A domain is contained in the graph iff it
observes or controls a phenomenon that is related to
an asset. Either, the phenomenon is a symbolic one,
which contains the asset directly. Or the phenomenon
is related to such a symbolic phenomenon, as explai-
ned earlier.
The directed edges of the graph indicate an asset-
related information flow. The starting nodes of the
edges are the domains which control the asset-related
symbolic phenomenon or the one in which it is con-
tained. The end nodes are the domains that observe
the respective phenomenon.
As a result, the domains that are contained in the
generated graph are considered to be in scope of the
analysis, because the information to be protected is
available there. In the next step, risks for the assets
are identified at these domains.
4.3.2 Validation Conditions
We identified the following validation conditions
(VCs) for the definition of focus and scope:
VC1 All interfaces contained in the set of problem di-
agrams are considered for the information flow
graph.
VC2 Only domains on which an asset-related in-
formation is available are considered to be in
scope.
VC3 For all information to be protected, the desired
security goals (confidentiality, integrity, availa-
bility) are documented.
4.3.3 Case Study
The ProCOR method is carried out based on the pro-
blem diagrams shown in Figures 3 and 4. We assume
that a fictitious customer has specified the assets to be
protected as given in Table 1. The values of the assets
are estimated in Euros per year according to the follo-
wing reasoning: (1) The integrity of tariff parameters
has a value of 20.000 Euros because without correct
parameters, the invoicing cannot be performed cor-
rectly. Because of periodical updates of the parame-
ters, incorrect parameters will be overwritten at some
time. Therefore, the incorrect values exist only for
a limited amount of time. This results in a relatively
small value of the asset. (2) The availability of measu-
red data is important for invoicing, too. The absence
of measured data leads to the case that an invoicing is
not possible. In this case, an employee needs to col-
lect the data manually. For this reason, we estimate
the overall costs for all clients to 10.000 Euros. (3)
A harm of the integrity of stored measured data leads
to an incorrect invoicing. Due to the high number of
clients of an energy supplier, the financial consequen-
ces are estimated with 50.000 Euros.
Next, we have to identify the phenomena in Fi-
gures 3 and 4 that are related to the assets given
in Table 1. The results of that identification pro-
cess are shown in Figure 6. The symbolic pheno-
mena which are considered as an asset are shown
in gray. An arrow pointing from one phenome-
non to another means that it is contained in the ot-
her one. For example, ES!{clientData} representing
the personal information of a client is contained in
ES!{insertConfiguration}.
The corresponding information flow graph is
shown in Figure 7. Below a domain name, the avai-
lable asset-related information is given in gray. For
Table 1: Asset documentation.
Symbolic Phe-
nomenon
Security Pro-
perty
Value
tariffParameters Integrity 20.000 Euros
measuredData Availability 10.000 Euros
measuredData Integrity 50.000 Euros
ENASE 2018 - 13th International Conference on Evaluation of Novel Approaches to Software Engineering
30
ES!{insertConfiguration} CH!{storeConfiguration}
C!{configuration}
ES!{tariffParameters} ES!{clientData}
SM!{measuredData}
MD!{meterData}
SM!{sendData} LMN!{forwardData}
CH!{storeData}
Figure 6: Case study: Phenomena relations.
Configuration
tariffParameters
Communi-
cationHub
measuredData,
tariffParameters
EnergySupplier
tariffParameters
SmartMeter
measuredData
LMN
measuredData
MeterData
measuredData
a
a
a
b
b
a: measuredData
b: tariffParameters
Figure 7: Case study: Information flow graph.
example, at the domain Configuration the information
tariffParameters is available, and there is a correspon-
ding information flow to this domain from the Com-
municationHub.
4.4 Step 2: Risk Identification
Based on the definition of focus and scope, we now
identify possible risks for the assets.
4.4.1 Description
To identify risks, we make use of a structured brain-
storming process as proposed by CORAS (Lund et al.,
2010). The analysts moderate a meeting with experts
which have different expertises. The results of this
brainstorming session are documented in a threat di-
agram. Such a diagram (see Figure 8) contains CO-
RAS elements as described in Section 2.2, and rela-
tions between them, as described in the conceptual
model given in Section 4.1.
The domains that are contained in the information
flow graph are inspected in this meeting, and possible
attacks on these domains have to be elicited. For ex-
ample, a domain representing an employee needs in-
vestigation for social engineering attacks. However,
it might be the case that additional domains have to
be considered for risk identification. This is because
the information flow graph has been created based on
the functional requirements. These requirements only
Integrity of
tariffParameters
Integrity of
measuredData
Availability of
measuredData
Changed
tariff
parameters
Bribe
EnergySuppli
er
EndCustomer
Disrupt
frequency of
LMN
Incorrect
transmission
of data
No
transmission
of data
EndCustomer
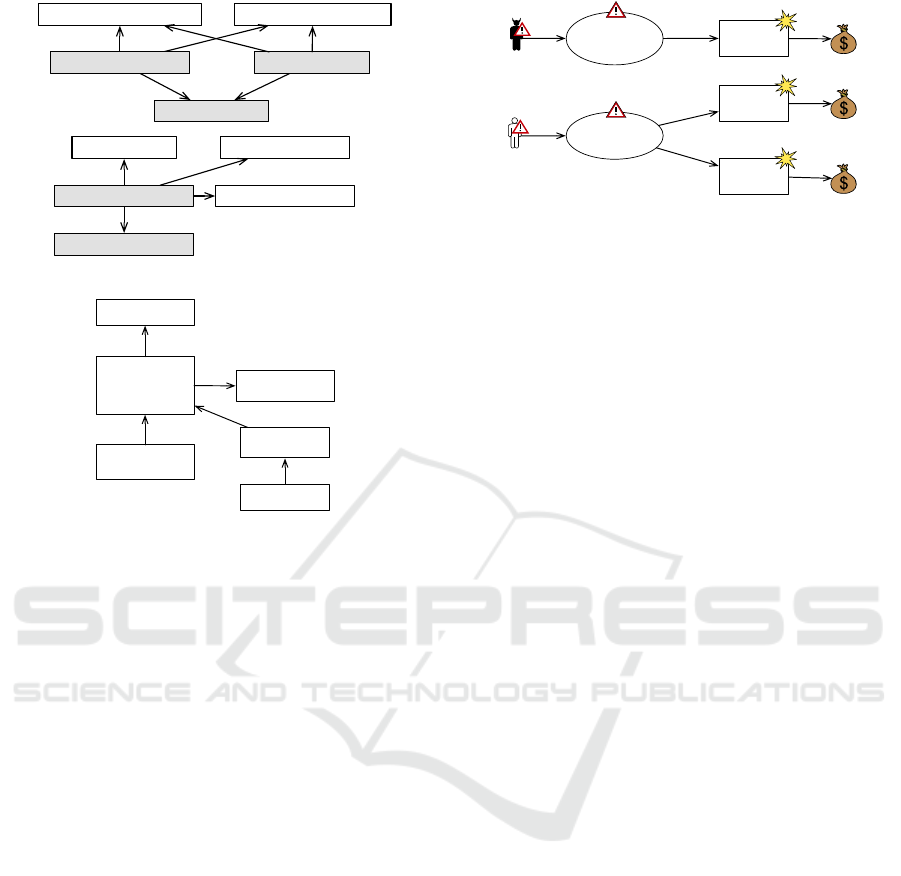
Figure 8: Case study: Threat diagram.
describe the desired behavior. For example, the at-
tacker who performs a social engineering attack on
the employee is not part of the desired behavior and
is hence not contained in the information flow graph.
This threat is then newly introduced in the threat dia-
gram, even though it is not contained in any problem
diagram.
4.4.2 Validation Conditions
We identified the following validation conditions for
the risk identification:
VC1 All domains contained in the information flow
graph have to be investigated for some threat or
threat scenario.
VC2 Only domains on which an asset-related infor-
mation is available can have a threat or threat
scenario which can harm the asset.
4.4.3 Case Study cont’d
Figure 8 shows the outcome of the risk identification
process for our case study. There is one human-threat
deliberate EndCustomer who bribes the energy sup-
plier (threat scenario) to change the tariff parameters
(unwanted incident). This harms the integrity of the
tariff parameters (asset). The end customer is also a
human-threat accidental who disrupts the frequency
of the local metrological network (threat scenario),
for example by using the same frequency for other
purposes. This leads to two unwanted incidents. First,
the integrity of measured data (asset) is harmed by
an incorrect transmission of data (unwanted incident).
Second, the availability of measured data (asset) is
harmed by no transmission of data (unwanted inci-
dent).
4.5 Step 3: Risk Evaluation &
High-Level Security Requirements
In this step, we evaluate the identified risks and set up
a high-level security requirement for each unaccepta-
Problem-based Elicitation of Security Requirements
31
ble risk, based on a given risk matrix.
4.5.1 Description
The risk evaluation process is performed as propo-
sed by CORAS (Lund et al., 2010). Based on the
threat diagram and the knowledge of experts, likeli-
hoods and consequences are estimated. There is a li-
kelihood for the following elements of the threat dia-
gram: (1) for a threat to initiate a threat scenario, (2)
for a threat scenario to occur, (3) for a threat scenario
leading to an unwanted incident and (4) for an unwan-
ted incident to occur. The likelihoods for (2) and (4)
are derived from the likelihoods of the incoming ed-
ges (i.e., (1) and (3)) based on empirical knowledge
about the dependencies between the different likeli-
hoods. The consequences for an asset are annotated
on the relation between an unwanted incident and an
asset. Thus, it describes what consequence an unwan-
ted incident has on an asset.
The likelihoods and consequences are expressed
using scales. These scales can for example be defined
based on intervals. To evaluate the risks, we make use
of a risk matrix. For each asset, a risk matrix must
be defined. On the x-axis of the matrix, the different
values of the consequence scale and on the y-axis the
values for the likelihood scale are annotated. Since a
risk consists of a likelihood and a consequence, a cell
in the matrix denotes a risk level. For each risk le-
vel, it must be decided whether the risk is acceptable
or not. Each risk of the threat diagram, represented
as the likelihood of an unwanted incident and the cor-
responding consequence on an asset, is added to the
risk matrix. Using the matrix, it is now possible to
decide whether a risk is acceptable or not. For each
unacceptable risk, a high-level security requirement
(HL-SR) is set up, which describes the necessary risk
reduction. Such a requirement is expressed using the
following textual pattern:
Ensure that the risk for A due to UI caused by
T S and initiated by T is acceptable accor-
ding to the risk matrix of the asset.
A stands for the asset, UI for the unwanted incident,
T S for the set of threat scenarios that lead to the un-
wanted incident and T for the set of threats that initi-
ate the threat scenarios.
To achieve such a likelihood reduction and the-
reby fulfill the HL-SR, we select treatments in the
next step.
4.5.2 Validation Conditions
We identified the following validation conditions for
the risk evaluation and the instantiation of high-level
security requirements:
Integrity of
tariffParameters
Integrity of
measuredData
Availability of
measuredData
Changed
tariff
parameters
Bribe
EnergySuppli
er
EndCustomer
Disrupt
frequency of
LMN
Incorrect
transmission
of data
No
transmission
of data
EndCustomer
20.000
50.000
10.000
10/y
10.000/y
0.02
0.5
0.01
0.2/y
5.000/y
100/y
10/y
10.000/y
Figure 9: Case study: Threat diagram with annotated risks.
VC1 All likelihoods and consequences are documen-
ted in the threat diagram to ensure a correct es-
timation of the risks.
VC2 For each asset, a risk matrix is defined which
specifies the acceptable and unacceptable risks
for that asset.
VC3 The likelihood scales and consequence scales
used for the documentation in the threat dia-
gram are consistent with the ones used in the
risk matrices.
VC4 For each risk that is considered as unacceptable
according to the corresponding risk matrix, ex-
actly one high-level security requirement is set
up.
4.5.3 Case Study cont’d
In Figure 9, we show the threat diagram with anno-
tated likelihoods and consequences. We express the
likelihood of an event as the frequency of the event
per year. We assume that ten times a year some end
customer tries to bribe the energy supplier, which is
successful in 2% of the cases and leads to a change of
tariff parameters. The consequence is given in Euros
as a value loss, here 20.000 Euros. There are 10.000
disruptions of the local metrological network by the
end customer per year, because the local metrological
network and most of the wireless equipment used in
private areas make use of the 2.4GHz band. In 50%
of the cases, this leads to an incorrect transmission of
data and a value loss of 50.000 Euros for the integrity
of measured data. In one percent of the cases it leads
to no transmission of data, which harms the availabi-
lity of measured data completely and hence, produces
a value loss of 10.000 Euros.
Since there is only at most one incoming edge per
element, the likelihood for each unwanted incident is
calculated by multiplying both previous likelihoods.
The risk for each pair of unwanted incident and asset
is documented in Table 2. The risks are then added to
the risk matrix as shown in Table 3. Here, we assume
ENASE 2018 - 13th International Conference on Evaluation of Novel Approaches to Software Engineering
32
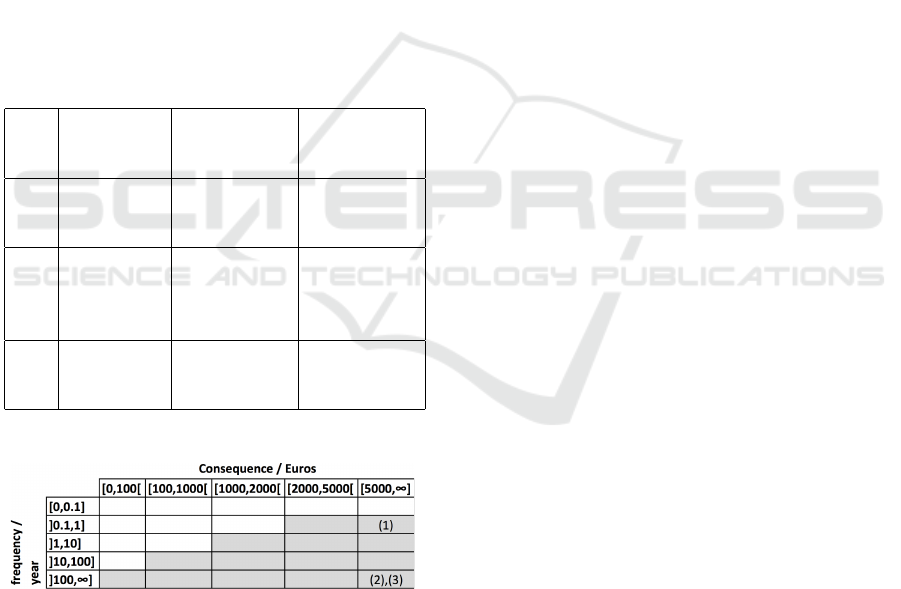
that the values for the risk matrix are the same for
each asset. The unacceptable risks are marked with
gray. Hence, there are three unacceptable risks, and it
is necessary to provide a high-level security require-
ment for each of them:
HL-SR1. Ensure that the risk for Integrity of tariff-
Parameters due to Changed tariff parameters cau-
sed by {Bribe EnergySupplier} and initiated by
{EndCustomer} is acceptable according to the
risk matrix of the asset.
HL-SR2. Ensure that the risk for Integrity of mea-
suredData due to Incorrect transmission of data
caused by {Disrupt frequency of LMN} and ini-
tiated by {EndCustomer} is acceptable according
to the risk matrix of the asset.
HL-SR3. Ensure that the risk for Availability of me-
asuredData due to No transmission of data cau-
sed by {Disrupt frequency of LMN} and initiated
by {EndCustomer} is acceptable according to the
risk matrix of the asset.
Table 2: Case study: Risk calculation.
No. Unwanted
Incident
Asset Risk
( f requ./y
× consequ.)
(1) Changed
tariff
parameters
Integrity of
tariffPara-
meters
(0.2, 20.000)
(2) Incorrect
transmis-
sion of
data
Integrity of
measured-
Data
(5.000,
50.000)
(3) No trans-
mission of
data
Availability
of measu-
redData
(100,
10.000)
Table 3: Case study: Risk matrix.
4.6 Step 4: Treatment Selection &
Evaluation
In this step, we first select treatments based on the
threat diagram to fulfill the previously determined
high-level security requirements. Then, the treat-
ments are evaluated to decide whether an application
is worthwhile or not, based on the overall costs com-
pared to the value of the asset.
4.6.1 Description
For each high-level security requirement, treatments
have to be selected to achieve the necessary risk re-
duction. The elements which a treatment can possibly
address are described in the high-level security requi-
rement (threats and threat scenarios) and can also be
found in the threat diagram. As shown in the concep-
tual model (see Section 4.1) a threat or threat scena-
rio, respectively, is associated with a domain. The-
refore, a treatment is applied at that domain. A tre-
atment either leads to a likelihood or a consequence
reduction. To express this in a threat diagram, we ex-
tend the CORAS language with a new arrow type for a
treatment scenario, called addresses, which points to
the likelihood or consequence to be reduced, whereas
the treats arrow points to the threat or threat scenario
on whose domain the treatment is applied.
The treatments can be selected in a brainstorming
session. It is necessary to add treatments until all risks
have been reduced to an acceptable level. If such a re-
duction is not possible, the high-level security requi-
rement cannot be fulfilled. The customer then has to
decide whether to accept a higher risk (changing the
risk matrix), change the functional requirements, e.g.
by not offering risky services any more, or search for
other possibilities to mitigate the unacceptable risk.
Furthermore, the treatments should not cost more
than the value of the asset they protect. Therefore, it
is necessary to calculate the overall costs for all tre-
atments that are related to a high-level security requi-
rement. The overall costs are then compared to the
value of the asset to be protected. If the costs are hig-
her than the value, the customer has to decide how to
proceed with the development, similarly as described
above.
4.6.2 Validation Conditions
We identified the following validation conditions for
the selection of treatments:
VC1 Treatments are selected in the way that they re-
duce a certain risk (consequence and/or likeli-
hood) and are applied to a domain that is related
to a threat or threat scenario which leads to the
risk.
VC2 The costs for treatments are not higher than the
value of the asset to be protected.
VC3 All risks are reduced to an acceptable level ac-
cording to the risk matrices.
Problem-based Elicitation of Security Requirements
33
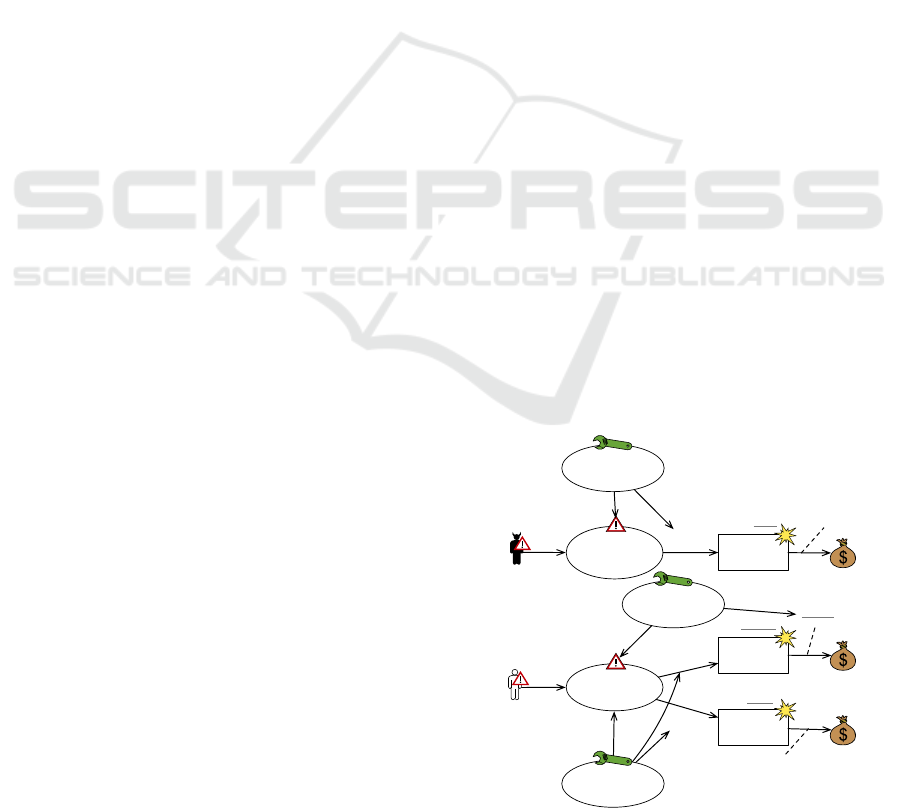
4.6.3 Case Study cont’d
We selected three treatments to illustrate the fourth
step of our method, using fictitious values for their
costs. (1) To reduce the likelihood that bribing the
energy supplier will be successful, there is a treatment
providing better working conditions, e.g. more mo-
ney. There are only few employees who are able to
change the tariff parameters. Hence, the costs of the
treatment are 5.000 Euros. This is less than the va-
lue loss of 20.000 Euros. The likelihood reduction is
estimated to be 80%. The residual likelihood for the
unwanted incident is then 10∗(1 − 0.8)∗0.02 = 0.04.
According to the risk matrix (see Table 3), the risk is
now acceptable. (2) To avoid disruption of the local
metrological network (LMN), the frequency is repla-
ced by a 5GHz band. As there are major changes to
the LMN, the costs are estimated with 40.000 Euros.
This treatment addresses two likelihoods, because the
threat scenario leads to two unwanted incidents. Both
likelihoods are reduced by 99,9%, because the 5GHz
band allows much more concurrent connections. The
value loss for an incorrect transmission of data is
50.000 Euros, and for no transmission of data it is
10.000 Euros. Hence, the costs of the treatment are
less than the value loss. Recalculating the likelihoods
for the unwanted incidents leads to 5/y for an incor-
rect transmission and 0.1/y for no transmission. Ac-
cording to the risk matrix, the likelihood for an incor-
rect transmission is still too high, so we need an addi-
tional treatment. (3) The implementation of a check-
sum can be realized by an existing component that
can be applied at the LMN. The costs are 1.000 Euros.
Since a checksum makes it possible to detect modifi-
cations of data, the consequences for the integrity of
measured data are reduced by 99%. In fact, the incor-
rect data is still transmitted, but the communication
hub as the receiver is able to detect the incorrectness.
The incorrect data will not be used for the invoicing.
There is still a value loss, because the data has to be
retrieved in a different way. The residual consequence
is (1 − 0.99) ∗ 50000 Euros = 500 Euros. According
to the risk matrix and the likelihood reduction by the
second treatment, the risk is now acceptable.
There are no unacceptable risks left in our exam-
ple, and hence all high-level security requirements
can be fulfilled. The augmented threat diagram con-
taining all treatment scenarios is shown in Figure 10.
4.7 Step 5: Concretized Security
Requirements & Treatment
Problem Diagrams
Based on the previously determined high-level secu-
rity requirements and the proposed treatments, we
concretize the security requirements and close the ci-
rcle to the functional requirements by setting up treat-
ment problem diagrams.
4.7.1 Description
A Concretized Security Requirement (C-SR) adds in-
formation about selected treatments to a high-level se-
curity requirement. For this reason, there is one C-SR
for each HL-SR set up in step 4. A C-SR has the fol-
lowing form:
The risk for A due to UI caused by T S and
initiated by T is reduced to an acceptable le-
vel according to the risk matrix of the asset by
applying T R.
There, T R describes the required treatments as a
set of tuples domain × treatment where domain des-
cribes the domain to which the treatment is applied.
To align the concretized security requirements with
the functional ones, we introduce a new type of pro-
blem diagram, called Treatment Problem Diagram. In
contrast to a functional requirement, a C-SR is not im-
plemented by a machine but by a treatment. This tre-
atment can be technical. In this case, it could lead to a
software development problem, similar to the functi-
onal requirements. But treatments can also be non-
technical, for example training personnel to resist so-
cial engineering attacks. Therefore, a new type of pro-
blem diagrams is needed to specify the treatments to
Integrity of
tariffParameters
Integrity of
measuredData
Availability of
measuredData
Changed
tariff
parameters
Bribe
EnergySuppli
er
EndCustomer
Disrupt
frequency of
LMN
Incorrect
transmission
of data
No
transmission
of data
EndCustomer
20.000
50.000
10.000
10/y
10.000/y
0.02
0.5
0.01
Better working
conditions, e.g.
more money
5.000
0.8
40.000
0.999
Replace
frequency by
5GHz
0.999
Implement
Checksums
1.000
0.99
0.2/y
5.000/y
100/y
0.04/y
5/y
0.1/y
500
10/y
10.000/y
Figure 10: Case study: Threat diagram with treatments.
ENASE 2018 - 13th International Conference on Evaluation of Novel Approaches to Software Engineering
34

be implemented and their effects on the relevant dom-
ains.
As a counterpart of the machine domain in pro-
blem diagrams, we introduce a new domain type cal-
led treatment for treatment problem diagrams. For
each C-SR, one treatment problem diagram must be
set up. All domains and treatments given by the C-
SR are added to the diagram. To indicate that a treat-
ment treats a domain, we add an interface between the
treatment domain and treated domain. These dom-
ains share a phenomenon controlled by the treatment
domain, which describes how the treated domain is
influenced. The C-SR constrains the treated domain
and refers to all other domains related to the elements
mentioned in the C-SR. The referring edges of the re-
quirement are annotated with a phenomenon that is
controlled by the domain and describes the harm on
the asset.
The result of the last step is an extended require-
ment model consisting of a set of functional requi-
rements, expressed as problem diagrams, and a set
of security requirements, expressed as treatment pro-
blem diagrams. In subsequent phases of a software
development lifecycle, it is now possible to consider
both types of requirements directly and to ensure that
the security requirements are considered right from
the beginning of the software development process,
instead of treating them as an add-on.
4.7.2 Validation Conditions
We identified the following validation conditions for
the instantiation of concretized security requirements
and the creation of treatment problem diagrams:
VC1 For each high-level security requirement, there
is exactly one concretized security requirement.
VC2 Each concretized security requirement is repre-
sented by exactly one treatment problem dia-
gram.
VC3 Only domains that are related to the concretized
security requirement are contained in the treat-
ment problem diagram.
VC4 A domain in a treatment problem diagram is
constrained iff a treatment is applied to it.
VC5 For each applied treatment, a treatment domain
is contained in the treatment problem diagram.
4.7.3 Case Study cont’d
We had identified three high-level security require-
ments. Hence, we have to set up three concretized
security requirements (C-SR).
EndCustomer
C-SR1
EnergySupplier
a
c
a: ES!{insertConfiguration} b: WC!{payMoreMoney}
c: EC!{bribeEnergySupplier}
Working
Conditions
b
Figure 11: Case study: Treatment problem diagram for C-
SR1.
C-SR1. The risk for Integrity of tariffParameters due
to Changed tariff parameters caused by {Bribe
EnergySupplier} and initiated by {EndCustomer}
is reduced to an acceptable level according
to the risk matrix of the asset by applying
{(EnergySupplier, Better working conditions e.g.
more money)}.
C-SR2. The risk for Integrity of measuredData due
to Incorrect transmission of data caused by
{Disrupt frequency of LMN} and initiated by
{EndCustomer} is reduced to an acceptable level
according to the risk matrix of the asset by ap-
plying {(LMN, Implement checksums),(LMN, Re-
place frequency by 5GHz)}.
C-SR3. The risk for Availability of measuredData
due to No transmission of data caused by
{Disrupt frequency of LMN} and initiated by
{EndCustomer} is reduced to an acceptable level
according to the risk matrix of the asset by ap-
plying {(LMN, Replace frequency by 5GHz)}.
We have to set up three treatment problem dia-
grams, one per concretized security requirement. A
machine domain is represented by a rectangle with
two vertical bars. Similarly, we represent the ne-
wly introduced treatment domain with two horizontal
bars.
Figure 11 shows the treatment problem diagram
for C-SR1. The domain EnergySupplier is constrai-
ned, because the application of the treatment Wor-
kingConditions, describing a better payment for the
employees, influences that domain. The domain En-
dCustomer is referred to by C-SR1, because the end
customer is mentioned in the requirement.
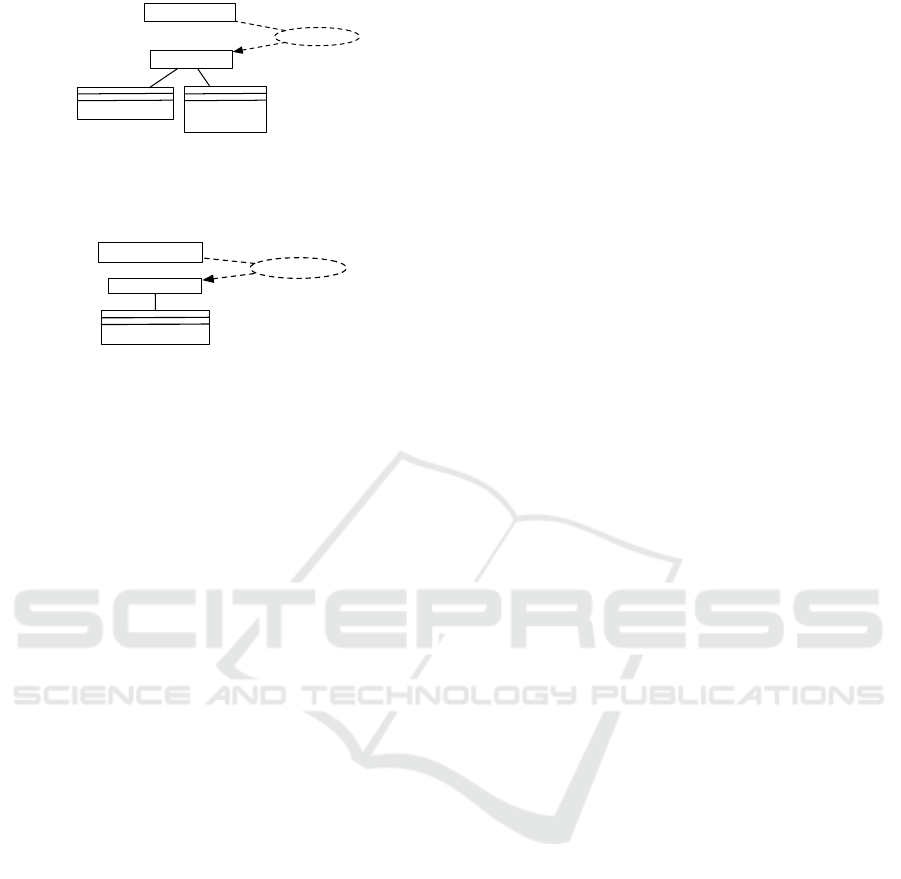
Figure 12 shows the treatment problem diagram
for C-SR2. Since there is no treatment for domain
EndCustomer, the requirement only refers to it. For
the domain LMN, there are two treatments. Thus, it is
constrained by the requirement. The treatment New-
Frequency enables the LMN to make use of a 5GHz
band. The treatment ImplementChecksums allows the
generation of message codes to verify the correctness
of transmitted data.
Figure 13 shows the treatment problem diagram
Problem-based Elicitation of Security Requirements
35
EndCustomer
C-SR2
LMN
a
c
a: LMN!{forwardData} b: NF!{use5GHz}
c: EC!{disruptFrequency} d: IC!{generateMessageCode}
NewFrequency
b
Implement
Checksums
d
Figure 12: Case study: Treatment problem diagram for C-
SR2.
EndCustomer
C-SR3
LMN
a
c
a: LMN!{forwardData} b: NF!{use5GHz}
c: EC!{disruptFrequency}
NewFrequency
b
Figure 13: Case study: Treatment problem diagram for C-
SR3.
for C-SR3. It is similar to the one for C-SR2, except
that the implementation of a new frequency suffices
to fulfill the requirement.
The final requirements model now consists of the
functional requirements represented as problem dia-
grams and the security requirements represented as
treatment problem diagrams.
5 RELATED WORK
Faßbender et al. (Faßbender et al., 2014) propose the
PresSuRE method. The method provides a process to
elicit security requirements. The starting point of the
process are functional requirements, represented as
problem diagrams. The authors define an elicitation
process which consists of an identification of assets
and an elicitation of attackers and their abilities based
on attacker templates. The security requirements are
derived from graphs that are created based on the in-
formation about the functional requirements and the
elicited knowledge about attackers. The process does
not cover a risk estimation or risk evaluation. The
selection of treatments is not part of the method, as
well.
The CORAS method (Lund et al., 2010) (see
Section 2.2) is a model-based method for risk mana-
gement. For each step, the input and output is defined
as well as a language to describe the results in a mo-
del. The method is used for existing software. The se-
curity requirements are not explicitly stated, but there
is a risk-based selection of treatments to achieve an
acceptable risk level.
MAGERIT (Ministerio de Administraciones Pu-
blicas, 2014) is a methodology for Information Sys-
tems Risk Analysis and Management. It consists of
several books. Book 1 describes the risk management
method itself, which covers all steps of the risk mana-
gement process and provides detailed mechanisms to
evaluate the risk. There are no security requirements,
and the method is not model-based.
Mayer et al. provide a risk-based security engi-
neering framework (Mayer et al., 2005). The frame-
work is used in the earliest stages of a software deve-
lopment life-cycle. It describes a way to extend exis-
ting requirements engineering methods with security
aspects. The framework describes an iterative way to
perform this extension. It is not model-based, and no
security requirements are produced.
Herrmann et al. propose a method for managing
IT risks (Herrmann et al., 2011). This method pro-
vides a risk identification with a corresponding risk
prioritization and a selection of countermeasures to
address the identified risk. The security requirements
are elicited based on business goals. Business goals
describe the expectations of different stakeholders for
the software. For each business goal, one has to de-
cide whether it is related to security. The method is
not based on functional requirements, and is applied
to an existing software. It is not model-based.
In Section 6.1, we refer to Microsoft’s STRIDE
(Shostack, 2014). STRIDE is a popular security fra-
mework which is used to identify security threats.
Using data flow diagrams for modeling the system
and its behavior, threats are elicted based on existing
threat categories. In the end, threats are documen-
ted as a basis for the instantiation of security requi-
rements. The security requirements are not part of
STRIDE.
6 CONCLUSION AND OUTLOOK
In this paper, we have described a step-wise method
to derive security requirements from functional requi-
rements based on a risk analysis to protect valuable
information. We make use of models to document the
results of each step and to express the relations be-
tween the functional requirements and the identified
risks. The relations between the models are clearly
defined using a conceptual model. The risk evaluation
and the resulting high-level security requirements en-
sure that only unacceptable risks are treated. This is
achieved by selecting appropriate treatments and set-
ting up concretized security requirements that specify
how the necessary risk reduction can be achieved. To
ensure that the security requirements can be taken into
account in the software development process in a si-
ENASE 2018 - 13th International Conference on Evaluation of Novel Approaches to Software Engineering
36

milar way as the functional requirements, we repre-
sent the elicited security requirements in a similar way
as the functional ones. Finally, the validation condi-
tions of our method assist analysts in detecting errors
in the application of the method as early as possible.
6.1 Experimental Evaluation
We plan to evaluate the ProCOR method with an ex-
periment. With this evaluation, we aim to measure
the performance and success rate of our method. Our
experimental setup is inspired by an evaluation of
Microsoft’s STRIDE (Scandariato et al., 2015). In
this study, the authors evaluate Microsoft’s method,
e.g. with regard to its performance, but do not com-
pare it with other methods. Since we introduce no-
vel elements such as treatment problem diagrams, it
is not possible to compare our ProCOR method di-
rectly with existing ones. The cited study can there-
fore serve as a blueprint for our experiment.
The experiment will be carried out as an applica-
tion of the ProCOR method. As an initial input, we
provide a document describing a case study. It con-
sists of a detailed textual description of the scenario,
the security goals of the customer and the set of initial
problem diagrams. These elements represent the in-
put of Step 1 of the ProCOR method. We plan to have
several groups of five participants which perform the
experiment independently. All groups start with the
same amount of (virtual) money and time that is avai-
lable for the analysis. The comparison of the different
groups is used to avoid statistical flaws. During the
experiment, there will be some experts available for
the participants who can be asked for help. Asking an
expert for help will cost money.
We define the following research questions (RQ)
to be addressed during the experiment:
RQ1 How many correct threats can be identified by
applying the ProCOR method?
Scandariato et al. define an expected rate of one
threat per hour (Scandariato et al., 2015). We
will adapt this assumption. The threats that are
considered as correct have to be defined before
executing the experiment.
RQ2 How long does each phase of the method take?
Does the method help to reduce the effort for
the steps?
We define a maximum time for the analysis in
person hours. We will not assign a specific time
slot to any step. Hence, the participants are free
in their time management. We will record the
time that is used for each step. Additionally,
we will make use of camcorders to record the
performance. Together with the measured time,
we will be able to identify problems during the
application of the method.
RQ3 How much interaction between the experts and
the participants takes place during the experi-
ment?
A certain amount of money is available for the
analysis. For each consultation of an expert,
the participants have to pay which limits the
amount of expert help the participants can re-
ceive. Based on the money that is left in the
end, we will be able to measure the contribution
of the participants compared to the input that is
provided by the experts.
RQ4 How confident are the participants of their per-
formance?
After the experiment, we plan to make inter-
views with the participants and ask them about
their feelings and their self-confidence about
the results. The results of these interviews will
be compared with the actual results as desribed
in the other research questions.
6.2 Future Work
In the future, we will investigate in more detail how
the treatments are considered in the subsequent de-
sign and implementation phases. Moreover, we in-
tend to support some of the brainstorming processes
with further methods, e.g., a systematic risk identifi-
cation method. Currently, we assume that there are
experts with a deeper background knowledge about
threats. Our vision is to provide a library of possible
threats and to assist the analysts in identifying the re-
levant threats by searching the library. Such a library
has been proposed by Uzunov and Fernandez (Uzu-
nov and Fernandez, 2014). The search process shall
be based on problem diagrams or problem frames, as
these are reusable patterns.
We intend to provide a web-based tool which as-
sists analysts in enacting the method. The results of
each step are documented in a model. This allows
the analysts to generate a documentation automati-
cally and to ensure consistency between the different
diagrams. Some of the proposed validation conditi-
ons can be checked automatically. The documenta-
tion can be used to certify the developed software ac-
cording to a standard. The tool will provide a walk-
trough of the steps described in Section 4. For adding
new diagrams, we will provide a graphical diagram
creation tool.
Problem-based Elicitation of Security Requirements
37

REFERENCES
Faßbender, S., Heisel, M., and Meis, R. (2014). Functional
Requirements Under Security PresSuRE. In ICSOFT-
PT 2014 - Proceedings of the 9th International Confe-
rence on Software Paradigm Trends, Vienna, Austria,
29-31 August, 2014. SciTePress.
Herrmann, A., Morali, A., Etalle, S., and Wieringa, R.
(2011). Riskrep: Risk-based security requirements
elicitation and prioritization. In 1st Intern. Works-
hop on Alignment of Business Process and Security
Modelling, ABPSM 2011, Lect. Notes in Business In-
form. Processing. Springer Verlag.
ISO (2009). ISO 31000 Risk management – Principles and
guidelines. International Organization for Standardi-
zation.
Jackson, M. (2001). Problem Frames: Analyzing and Struc-
turing Software Development Problems. Addison-
Wesley Longman Publishing Co., Inc.
Lund, M. S., Solhaug, B., and Stølen, K. (2010). Model-
Driven Risk Analysis. The CORAS Approach. Sprin-
ger.
Mayer, N., Rifaut, A., and Dubois, E. (2005). Towards a
risk-based security requirements engineering frame-
work. In In Proc. of REFSQ’ 05.
Ministerio de Administraciones Publicas (2014). MAGERIT
- version 3.0. Methodology for Information Systems
Risk Analysis and Management. Book I - The Method.
Ministry of Finance and Public Administration.
OPEN meter Consortium (2009). Report on the identifi-
cation and specification of functional, technical, eco-
nomical and general requirements of advanced multi-
metering infrasturcture, including security require-
ments.
Scandariato, R., Wuyts, K., and Joosen, W. (2015). A des-
criptive study of Microsoft’s threat modeling techni-
que. Requirements Engineering, 20(2):163–180.
Shostack, A. (2014). Threat Modeling: Designing for Se-
curity. Wiley.
Uzunov, A. and Fernandez, E. (2014). An extensible
pattern-based library and taxonomy of security thre-
ats for distributed systems. Computer Standards &
Interfaces, 36.
ENASE 2018 - 13th International Conference on Evaluation of Novel Approaches to Software Engineering
38
