
Automatic Tree Annotation in LiDAR Data
Ananya Gupta
1,2
, Jonathan Byrne
2
, David Moloney
2
, Simon Watson
1
and Hujun Yin
1
1
School of Electrical and Electronic Engineering, The University of Manchester, Manchester, U.K.
2
Movidius Group, Intel Corporation, Dublin, Ireland
Keywords:
Airborne LiDAR, Urban Areas, Classification, Tree Detection, Voxelization.
Abstract:
LiDAR provides highly accurate 3D point cloud data for a number of tasks such as forest surveying and urban
planning. Automatic classification of this data, however, is challenging since the dataset can be extremely large
and manual annotation is labour intensive if not impossible. We provide a method of automatically annotating
airborne LiDAR data for individual trees or tree regions by filtering out the ground measurements and then
using the number of returns embedded in the dataset. The method is validated on a manually annotated dataset
for Dublin city with promising results.
1 INTRODUCTION
Trees are critical to the healthy functioning of the
ecosystem and provide a number of benefits to the en-
vironment such as regulation of water systems, main-
taining air quality, carbon sequestration and promot-
ing biodiversity. Hence, up-to-date tree inventories
are extremely important for monitoring and preserva-
tion of ecological environments so much so, that, one
of the key items on the top ten initiatives of the World
Economic Forum on the Future of Cities in 2015 was
to increase green canopy (Treepedia, 2015).
LiDAR sensors are a good tool for acquiring dense
point cloud data for the purpose of surveying in short
ranges. These sensors measure the distance by tim-
ing a laser pulse reflected from a target and have been
applied in a number of remote sensing applications
ranging from mapping (Schwarz, 2010), landslide in-
vestigations (Jaboyedoff et al., 2012) to tree inven-
tories (Shendryk et al., 2016b). LiDAR systems are
particularly suited to surveying forest canopies due
to their active sensors and their ability to penetrate
canopies.
Currently, most of the research on isolating trees
focuses on forested areas, with little emphasis given
to urban areas where there are more complex environ-
ments due to the presence of multiple types of natural
and artificial objects. However, surveying trees in ur-
ban areas is of paramount importance for applications
such as city planning, estimating green canopy of ar-
eas and monitoring solar radiations (Jochem et al.,
2009).
In this work, we provide an algorithm to identify
trees in urban areas using information embedded in
the LiDAR data without requiring human interven-
tion. Contrary to the common use of the Canopy
Height Model (CHM) for this task, our method works
directly with the LIDAR data and uses the number of
returns information from the LiDAR data to isolate
trees.
2 RELATED WORK
A number of methods have been developed to seg-
ment trees in LiDAR data with the most common be-
ing based on CHM (Lu et al., 2014; Ferraz et al.,
2016; Reitberger et al., 2009; Smits et al., 2012;
Mongus and Zalik, 2015).
Hyyppa et al. (2001) pioneered work in this area;
they used the information from the highest laser re-
turns to build a tree height model and then used region
growing techniques to for tree segmentation. Koch
et al. (2006) used local maximum filters to identify
potential tree regions followed by the use of a pour-
ing algorithm and knowledge-based assumptions to
identify tree crowns. Li et al. (2012) took advan-
tage of the spacing between treetops at their highest
points to identify trees and used a region growing al-
gorithm to segment them. More recently, Shendryk
et al. (2016a) used Euclidean distance clustering to
delineate trunks in eucalypt forests. These methods
proved highly effective in identifying trees in forested
areas but are unsuitable for use in urban environments
36
Gupta, A., Byrne, J., Moloney, D., Watson, S. and Yin, H.
Automatic Tree Annotation in LiDAR Data.
DOI: 10.5220/0006668000360041
In Proceedings of the 4th International Conference on Geographical Information Systems Theor y, Applications and Management (GISTAM 2018), pages 36-41
ISBN: 978-989-758-294-3
Copyright
c
2019 by SCITEPRESS – Science and Technology Publications, Lda. All rights reserved
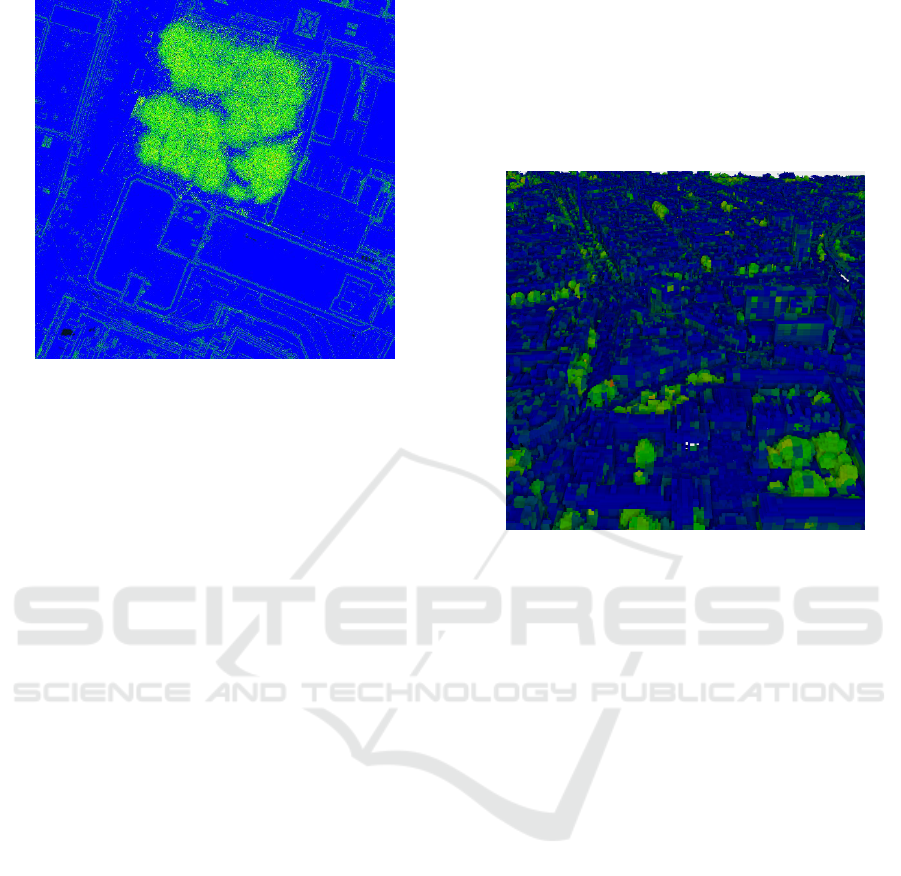
Figure 1: LiDAR point cloud showing decreasing number
of returns where Red>Yellow>Green>Blue.
since the assumption of highly dense collections of
trees does not apply to isolated individual trees.
Pioneering work in urban tree detection was based
on machine learning techniques. Secord and Zakhor
(2007) used a combination of aerial images and Li-
DAR data for segmentation and classification with
Support Vector Machines (SVM). They extended this
work to using features derived from depth images of
LiDAR data with an SVM classifier (Chen and Za-
khor, 2009). Carlberg et al. (2009) used a cascade
of binary classifiers to progressively identify water,
ground, roofs and trees by conducting 3D shape anal-
ysis. Segmenting foreground and background and
classifying object-like clusters was used to locate dif-
ferent 3D objects in an urban environment (Golovin-
skiy et al., 2009). Decision trees and Artificial Neural
Networks have also been used for segmenting features
from Digital Surface Models for classification (H
¨
ofle
et al., 2012). The main drawback with these meth-
ods is that they need pre-labelled data in order to
train their models and cannot work in an unsupervised
manner.
There has been some work done on identifying
trees in urban environments without the need for la-
belled data. Liu et al. (2013) proposed a method for
extracting tree crowns by filtering out ground points
and using a spoke wheel method to get tree edges. Wu
et al. (2013) proposed a voxel-based method to extract
individual trees from mobile laser scanning data but
their method is not suitable for use with airborne Li-
DAR scans. Zhang et al. (2015) developed a method
to estimate tree metrics for urban forest inventory pur-
poses by detecting treetops and using a region grow-
ing algorithm for segmentation.
We propose a new technique for automatically de-
tecting trees in urban environments by using the num-
ber of returns information embedded in LiDAR data.
Similar to previous approaches, our method starts
with ground removal; however, following that step we
voxelise the point cloud data and show that trees can
easily be extracted from this subsampled data by us-
ing certain heuristics and data analysis.
Figure 2: Voxelized point cloud showing number of returns.
3 METHODOLOGY
Our method for labelling trees is based on four dis-
tinct steps: ground filtering, voxelizing non-ground
point cloud data, isolating tree-like regions using the
information gained from the number of returns, and
post-processing to remove false positives.
3.1 Ground Filtering
A Digital Terrain Model (DTM) is used to represent
the surface of the Earth and there is a vast body of re-
search in extracting ground points from LiDAR scans
in order to produce a DTM. There are number of dif-
ferent algorithms for ground filtering such as morpho-
logical filtering, surface based adjustment and statis-
tical analysis (Chen et al., 2017).
We use a Progressive Morphological Filter
(PMF) (Zhang et al., 2003) to identify ground points.
PMF uses the morphological operations of dilation
and erosion, where it uses progressively increasing
window sizes to identify non-ground points. We filter
out the ground points identified using this technique
and the results are shown in Figure 3(b). However,
it is not successful in removing all the ground points,
hence we do statistical outlier removal on the filtered
point cloud and get a much cleaner result can be seen
in Figure 3(c).
Automatic Tree Annotation in LiDAR Data
37
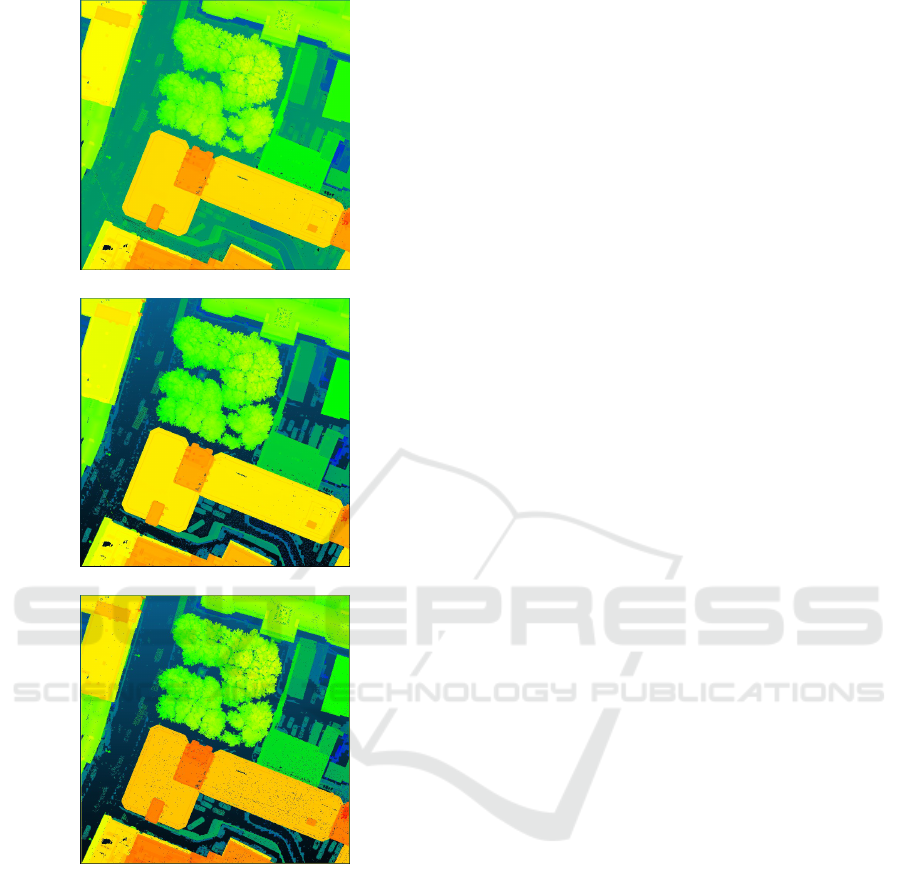
(a) Original Point Cloud
(b) Result of filtering with PMF
(c) Result after cleaning for noise
Figure 3: Ground Filtering.
3.2 Voxelization
An aerial LiDAR survey returns an extremely large
volume of data, with an hour-long survey generat-
ing over a billion unique points (Geosystems, 2015).
Even after filtering the ground points, the dataset can
retain more than half of the original points if the sur-
vey was in an occupied region, such as forests or ur-
ban areas. Hence, LiDAR point cloud data is often
converted to a mesh in order to reduce its dimen-
sionality. However, meshing algorithms can be error
prone when there are voids in the data since they make
assumptions about the shape in order to make water-
tight meshes. Meshing algorithms such as Poisson re-
construction require normals for the points which are
not directly available from the LiDAR output. They
also remove tall thin objects such as lampposts, tree
trunks and chimneys during the fitting process.
We convert the data into a volumetric occupancy
grid in order to overcome the limitations of mesh-
ing algorithms while reducing its dimensionality. A
fixed size 3 dimensional grid is overlaid on the point
cloud and the occupancy of each cell depends on the
presence of points within the cell, i.e. the cell is un-
occupied if there are no points in the cell’s volume
and vice versa. In this case, each volumetric ele-
ment, Voxel, represents a region in the subsampled
point cloud. Following the original tile dimensions of
100m × 100m, we convert each tile into a voxel grid
of dimensionality 256 ×256 × 256 hence limiting the
resolution of the voxel grid to be ≈ 0.39m × 0.39m ×
0.39m per voxel. Any further increase in resolution
does not noticeably increase accuracy and causes an
exponential increase in the processing time due to the
increased dimensionality of the data.
Furthermore, we use VOLA (Byrne et al., 2017)
to sparsely encode the voxel representation. VOLA is
a hierarchical 3D data structure which only encodes
for occupied voxels with a one bit per voxel using a
standard unsigned 64 bit integer. Unlike standard oc-
trees, which does not explicitly encode empty voxels,
we use a 2 bits per voxel approach to encode the ad-
ditional information per voxel such as colour, number
of returns and intensity value.
3.3 Isolating Tree Regions
LiDAR pulses reflect from from surfaces they en-
counter such as buildings, vegetation and ground.
Each pulse can return to the LiDAR sensor once or
multiple times, depending on the number of surfaces
it encounters. Trees typically have a high number of
returns since the laser pulses can reflect from multiple
edges of leaves and branches. Other features that can
have a high number of returns are the edges of build-
ing and window ledges. However, these latter values
are more scattered than in the case of trees which have
a large number of high returns closely packed as can
be seen in Figure 1.
We use this insight to isolate tree regions by iden-
tifying voxels with multiple returns (greater than 3 per
voxel) and then doing a connected component analy-
sis on these voxels. Regions with a minimum num-
ber of connected components are then identified as
tree regions, while any regions with smaller than the
threshold value are discarded as noise from buildings,
corners, etc.
GISTAM 2018 - 4th International Conference on Geographical Information Systems Theory, Applications and Management
38
3.4 Identifying Individual Trees
The tree regions isolated by using connected compo-
nents typically only return tree canopy as trunks might
have only a few disconnected voxels. Hence, in or-
der to find tree trunks, the maximum and minimum x
and y coordinates of each region are identified, along
with the maximum z coordinate. These coordinates
are then used to place a three dimensional bounding
box in the original data which is extended to ground
level in order to capture the trunk information.
The width to length ratio of the bounding box is
constrained so that one dimension is never more than
twice the other. Any regions not matching these con-
straints are discarded as a false positive. This allows
to discard walls covered with ivy since walls are typi-
cally long but not very thick, whereas trees have sim-
ilar widths and lengths and hence the width to length
ratio ≈ 1.
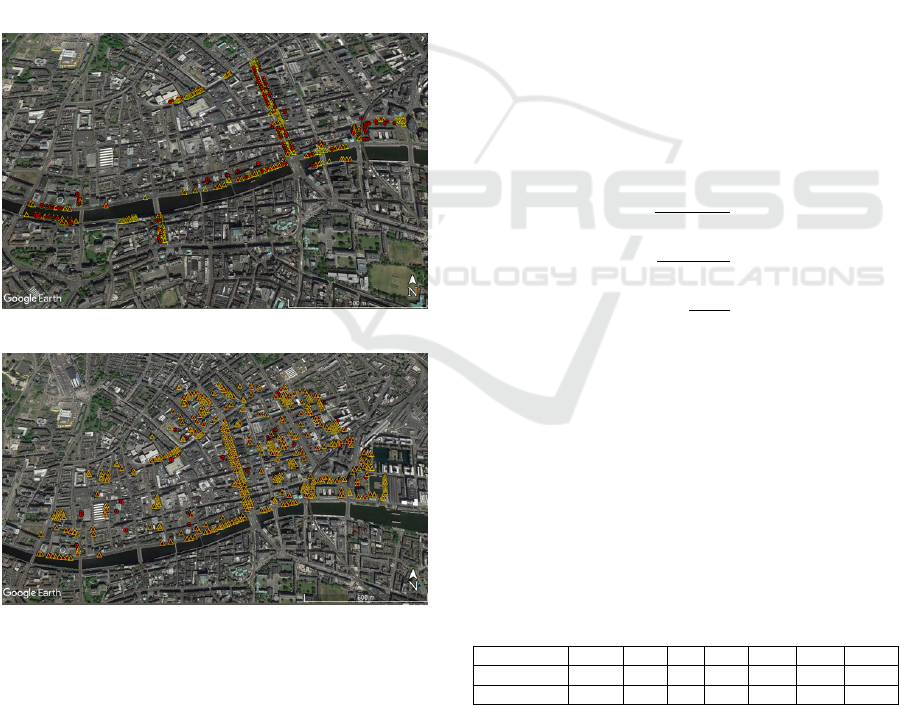
(a) Experiment 1
(b) Experiment 2
Figure 4: Map of survey area with tree locations shown in
yellow and the outputs of our labelling algorithm shown in
red.
4 EXPERIMENTS AND RESULTS
4.1 Data
This method was tested on a dense LiDAR dataset of
Dublin city (Laefer et al., 2015). This dataset was
captured at an altitude of 300m using a TopEye sys-
tem S/N 443. It consists over 600 million points with
an average point density of 348.43points/m
2
. It cov-
ered an area of 2km
2
in Dublin city centre.
We tested our results with the labels from Ningal
(2012) containing tree annotations around some of the
major streets in Dublin from 2008. In order to get
more up to date results, we manually annotated the
region north of the Liffey river for trees.
4.2 Evaluation Metric
There are three different results for the purposes of
detection: True Positives (TP) where the trees are cor-
rectly recognised, False Positives (FP) where regions
are incorrectly identified as trees, and False Negatives
(FN) where trees are not detected. Based on these re-
sults we evaluate the following metrics (Goutte and
Gaussier, 2005):
r =
T P
T P + FN
× 100
p =
T P
T P + FP
× 100
F
score
= 2 ×
r × p
r + p
× 100
(1)
where r (recall) is the tree detection rate, p (precision)
is the tree detection precision and F
score
is the total
accuracy.
4.3 Results
The extracted trees have been shown in Figure 4 along
with the original labels. We compared our labelled
outputs with two different sets of annotations, the first
from 2008 and the second from 2015 and the results
are summarized in Table 1.
Table 1: Summary of Results.
Experiment Trees TP FP FN p r F
score
1 313 178 45 135 0.57 0.8 0.66
2 535 469 56 66 0.88 0.89 0.88
The results of Experiment 1 (against 2008 anno-
tations) seem to suggest that the accuracy of our la-
belling method is extremely low with an F
score
of
0.66. On further analysis, we discovered that the ur-
ban landscape had changed a lot from when the tree
Automatic Tree Annotation in LiDAR Data
39
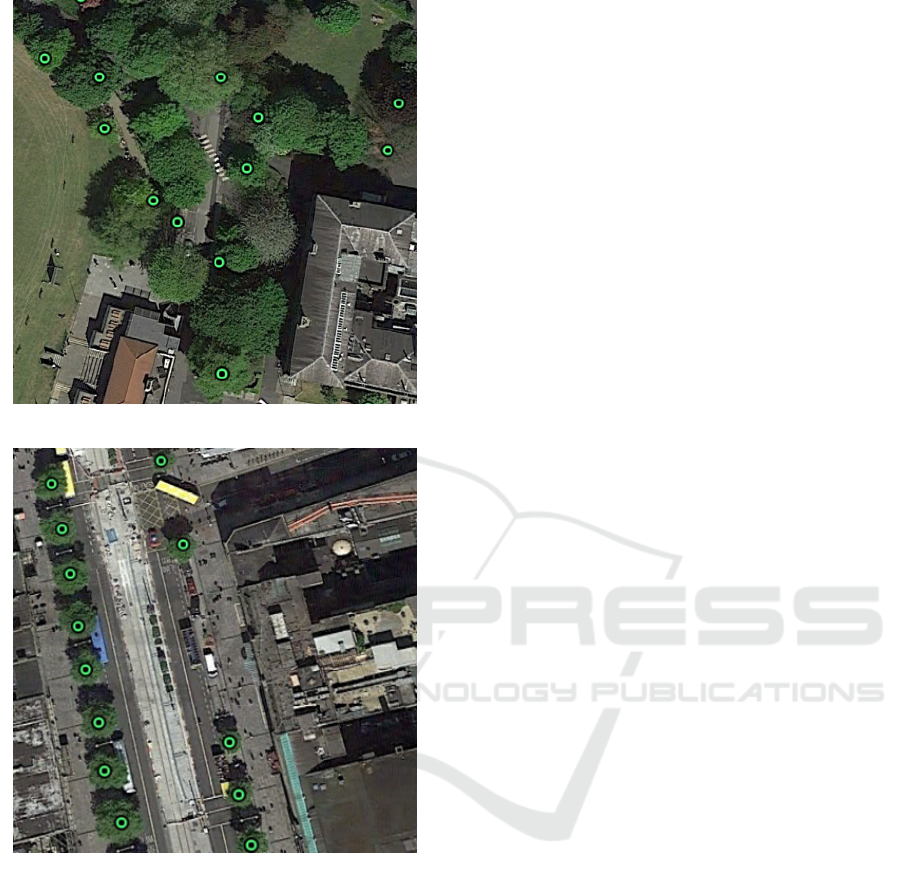
(a) Missed trees due to combined canopies
(b) Correctly labelled individual trees
Figure 5: Results.
labels were acquired in 2008 to when the LiDAR sur-
vey was done in 2015 due to roadworks and the con-
struction of the city tram. Hence, we annotated a sec-
tion of the city using imagery from 2015 to obtain a
fair analysis of our methods.
The results from the second experiment show that
our algorithm performs well by identifying almost
90% of the trees in Dublin correctly but has some
weak points. It is unable to distinguish between mul-
tiple trees packed closely as shown in Figure 5(a) and
assumes the entire canopy is a single tree leading to a
number of missed detections. Also, it mislabels heavy
ivy and bushes as trees since those produce multiple
returns as well. Our method performs extremely well
in labelling isolated trees irrespective of size, one of
such cases is shown in Figure 5(b), where all trees
along the side of O’Connell Street have been correctly
identified.
5 CONCLUSIONS
This paper addresses the challenge of automatic la-
belling trees in LiDAR data from urban environments.
Most previous work in this area focused on extract-
ing trees in forested regions, but the techniques can-
not directly be applied to urban environments due to
the complexity of the environment and the presence
of multiple objects.
The proposed method uses the number of returns
information present in the LiDAR data to isolate tree
regions and isolates individual trees by voxelizing
the data and finding clusters resembling trees using
connected component analysis. It deals well with
partially occluded trees and has achieved a satisfac-
tory accuracy of almost 90% in central Dublin hence
showing the effectiveness of the method. The method
has some drawbacks, namely that it is unable to sepa-
rate all individual trees within a large clump.
In order to deal with the current drawbacks, this
work can be extended in a number of ways in the fu-
ture:
• Improving individual tree detection in clumps by
isolating individual trunks along with the tree
canopy.
• Combining photogrammetry data with LiDAR
point cloud for more robust interpretation.
• Utilising the labelled trees from this method to
train a more robust machine learning based clas-
sifier which can generalise across point cloud
datasets for tree detection.
• Identifying building edges and windows using the
number of returns information and extrapolating
from those to obtain building reconstructions.
ACKNOWLEDGMENT
This research was undertaken while A. Gupta was an
intern at Intel Corporation and was partly funded by
the HiPEAC4 Network of Excellence under the EU’s
H2020 programme, grant agreement number 687698.
GISTAM 2018 - 4th International Conference on Geographical Information Systems Theory, Applications and Management
40

REFERENCES
Byrne, J., Caulfield, S., Xu, X., Pena, D., Baugh, G., and
Moloney, D. (2017). Applications of the VOLA For-
mat for 3D Data Knowledge Discovery . In Inter-
national Conference on Natural Computation, Fuzzy
Systems and Knowledge Discovery, pages 1–8.
Carlberg, M., Gao, P., Chen, G., and Zakhor, A. (2009).
Classifying urban landscape in aerial lidar using 3D
shape analysis. In Proceedings - International Con-
ference on Image Processing, ICIP, pages 1701–1704.
IEEE.
Chen, G. and Zakhor, A. (2009). 2D tree detection in large
urban landscapes using aerial LiDAR data. In Im-
age Processing (ICIP), 2009 16th IEEE International
Conference on, pages 1693–1696. IEEE.
Chen, Z., Gao, B., and Devereux, B. (2017). State-of-the-
Art: DTM Generation Using Airborne LIDAR Data.
Sensors, 17(1):150.
Ferraz, A., Saatchi, S., Mallet, C., and Meyer, V. (2016). Li-
dar detection of individual tree size in tropical forests.
Remote Sensing of Environment, 183:318–333.
Geosystems, L. (2015). Leica scanstation p30/p40. Techni-
cal report, Heerbrugg, Switzerland.
Golovinskiy, A., Kim, V. G., and Funkhouser, T. (2009).
Shape-based recognition of 3D point clouds in urban
environments. In 2009 IEEE 12th International Con-
ference on Computer Vision, pages 2154–2161. IEEE.
Goutte, C. and Gaussier, E. (2005). A Probabilistic Inter-
pretation of Precision, Recall and F-Score, with Im-
plication for Evaluation. In European Conference on
Information Retrieval, pages 345–359.
H
¨
ofle, B., Hollaus, M., and Hagenauer, J. (2012). Urban
vegetation detection using radiometrically calibrated
small-footprint full-waveform airborne LiDAR data.
ISPRS Journal of Photogrammetry and Remote Sens-
ing, 67(1):134–147.
Hyyppa, J., Kelle, O., Lehikoinen, M., and Inkinen, M.
(2001). A segmentation-based method to retrieve stem
volume estimates from 3-D tree height models pro-
duced by laser scanners. IEEE Transactions on Geo-
science and Remote Sensing, 39(5):969–975.
Jaboyedoff, M., Oppikofer, T., Abell
´
an, A., Derron, M.-H.,
Loye, A., Metzger, R., and Pedrazzini, A. (2012). Use
of LIDAR in landslide investigations: a review. Natu-
ral Hazards, 61(1):5–28.
Jochem, A., H
¨
ofle, B., Hollausb, M., and Rutzingerc, M.
(2009). Object detection in airborne LIDAR data for
improved solar radiation modeling in urban areas. In
Laser scanning, volume 38, pages 1–6. International
Society for Photogrammetry and Remote Sensing (IS-
PRS).
Koch, B., Heyder, U., and Weinacker, H. (2006). De-
tection of Individual Tree Crowns in Airborne Lidar
Data. Photogrammetric Engineering & Remote Sens-
ing, 72(4):357–363.
Laefer, D. F., Abuwarda, S., Vo, A.-V., Truong-Hong,
L., and Gharibi, H. (2015). 2015 Aerial Laser and
Photogrammetry Survey of Dublin City Collection
Record.
Li, W., Guo, Q., Jakubowski, M. K., and Kelly, M. (2012).
A New Method for Segmenting Individual Trees from
the Lidar Point Cloud. Photogrammetric Engineering
& Remote Sensing, 78(1):75–84.
Liu, J., Shen, J., Zhao, R., and Xu, S. (2013). Extraction
of individual tree crowns from airborne LiDAR data
in human settlements. Mathematical and Computer
Modelling, 58(3-4):524–535.
Lu, X., Guo, Q., Li, W., and Flanagan, J. (2014). A bottom-
up approach to segment individual deciduous trees us-
ing leaf-off lidar point cloud data. ISPRS Journal of
Photogrammetry and Remote Sensing, 94:1–12.
Mongus, D. and Zalik, B. (2015). An efficient approach to
3D single tree-crown delineation in LiDAR data. IS-
PRS Journal of Photogrammetry and Remote Sensing,
108:219–233.
Ningal, T. (2012). PhD Thesis. PhD thesis, UCD School of
Geography.
Reitberger, J., Krzystek, P., Stilla, U., and Sensing, R.
(2009). Benefit of airborne full waveform lidar for
3D segmentation and classification of single trees.
Schwarz, B. (2010). Lidar: Mapping the world in 3D. Na-
ture Photonics, 4(7):429–430.
Secord, J. and Zakhor, A. (2007). Tree Detection in Urban
Regions Using Aerial LiDAR and Image Data. IEEE
Geoscience and Remote Sensing Letters, 4(2):196–
200.
Shendryk, I., Broich, M., Tulbure, M. G., and Alexan-
drov, S. V. (2016a). Bottom-up delineation of individ-
ual trees from full-waveform airborne laser scans in a
structurally complex eucalypt forest. Remote Sensing
of Environment, 173:69–83.
Shendryk, I., Broich, M., Tulbure, M. G., McGrath, A.,
Keith, D., and Alexandrov, S. V. (2016b). Mapping in-
dividual tree health using full-waveform airborne laser
scans and imaging spectroscopy: A case study for a
floodplain eucalypt forest. Remote Sensing of Envi-
ronment, 187:202–217.
Smits, I., Prieditis, G., Dagis, S., and Dubrovskis, D.
(2012). Individual tree identification using different
LIDAR and optical imagery data processing methods.
Biosystems and Information Technology, 1(1):19–24.
Treepedia (2015). MIT Senseable City Lab.
Wu, B., Yu, B., Yue, W., Shu, S., Tan, W., Hu, C., Huang, Y.,
Wu, J., and Liu, H. (2013). A Voxel-Based Method for
Automated Identification and Morphological Parame-
ters Estimation of Individual Street Trees from Mobile
Laser Scanning Data. Remote Sensing, 5(2):584–611.
Zhang, C., Zhou, Y., and Qiu, F. (2015). Individual Tree
Segmentation from LiDAR Point Clouds for Urban
Forest Inventory. Remote Sens, 7:7892–7913.
Zhang, K., Chen, S. C., Whitman, D., Shyu, M. L., Yan, J.,
and Zhang, C. (2003). A progressive morphological
filter for removing nonground measurements from air-
borne LIDAR data. IEEE Transactions on Geoscience
and Remote Sensing, 41(4 PART I):872–882.
Automatic Tree Annotation in LiDAR Data
41
