
A Visual Computing Approach for Estimating
the Motility Index in the Frail Elder
Chiara Martini
1
, Nicoletta Noceti
1
, Manuela Chessa
1
, Annalisa Barla
1
, Alberto Cella
2
,
Gian Andrea Rollandi
2
, Alberto Pilotto
2
, Alessandro Verri
1
and Francesca Odone
1
1
Department of Informatics, Bioengineering, Robotics and System Engineering,
Universit
`
a degli Studi di Genova, Genova, Italy
2
E.O. Ospedali Galliera, Genova, Italy
Keywords:
Visual Computing, Skeleton Data, Motility Index, Frailty, Aging.
Abstract:
The accurate estimation of frailty is an important objective to assess the overall well-being and to predict
the risk of mortality of elderly. Such evaluation is commonly based on subjective quantities both from self-
reported outcomes and occasional physicians evaluations, leading to possibly biased results. An objective and
continuous frailty screening tool may be more appropriate for routine assessment. In this paper, we present a
data driven method to evaluate one of the main aspect contributing to the frailty estimation, i.e. the motility
of the subject. To this aim, we define a motility index, estimated following a visual computing approach
analysing streams of RGB-D data. We provide an extensive experimental assessment performed on two sets
of data acquired in a sensorised facility located within a local hospital. The results are in good agreement with
the assessment manually performed by the physicians, nicely showing the potential of our approach.
1 INTRODUCTION
According to the World Bank, Italy has the second-
highest share of population aged over 65 worldwide,
i.e., 22% in 2014, and statistics related to G20 coun-
tries are becoming increasingly similar. Our region, is
among the highest in this ranking worldwide. Aging
causes, in general, the reduction of the individual’s
potential, leading to a state of vulnerability and in-
stability of the clinical condition. To highlight this
condition, recent medical literature has proposed the
notion of frail elderly, an individual with an eleva-
ted risk of complications that may result in loss of
functional autonomy or death (Fried et al., 2004). The
accurate estimation of the frailty of an elderly is there-
fore an important objective to assess the overall well-
being and to predict the risk of mortality (Pilotto et al.,
2008) (Angleman et al., 2015). Moreover, an hospital
stay, especially if prolonged, can lead an elderly per-
son to develop new disabilities (Volpato et al., 2007)
and dramatically worsen the risk of mortality (Volpato
et al., 2016). Therefore, it is of particular clinical in-
terest to correctly quantify the frailty of the patient
just before being discharged. One of the most com-
monly accepted operational definition of frailty is the
classification proposed by Fried et al. (Fried et al.,
2001). In this study the authors define frailty as a cli-
nical syndrome in which three or more of the follo-
wing criteria are present: unintentional weight loss,
exhaustion, decrease grip strength, slow gait speed,
low physical activity. The criteria of weight loss,
exhaustion, and grip strength are usually self-reported
measures and may be prone to bias. An objective frai-
lty screening tool may be more appropriate for routine
assessment.
Another universally shared strategy for the estima-
tion of patients frailty index and related risk of morta-
lity is the Multidimensional Prognostic Index (MPI)
score (Pilotto et al., 2008), that is based on the eva-
luation of the clinical, cognitive, functional, nutritio-
nal, and social domains, as defined in the International
Classification of Functioning, Disability, and Health
1
.
The evaluation is mostly carried out through question-
naires and self-reported outcomes.
Recently, with the advent of the assistive
technologies, various approaches for the automa-
tic estimation of frailty have been proposed (Cao
et al., 2009),(Zouba et al., 2010),(Liu and Liu,
1
http://apps.who.int/classifications/icfbrowser/
Martini, C., Noceti, N., Chessa, M., Barla, A., Cella, A., Rollandi, G., Pilotto, A., Verri, A. and Odone, F.
A Visual Computing Approach for Estimating the Motility Index in the Frail Elder.
DOI: 10.5220/0006602004390445
In Proceedings of the 13th International Joint Conference on Computer Vision, Imaging and Computer Graphics Theory and Applications (VISIGRAPP 2018) - Volume 5: VISAPP, pages
439-445
ISBN: 978-989-758-290-5
Copyright © 2018 by SCITEPRESS – Science and Technology Publications, Lda. All rights reserved
439
2010),(Bathrinarayanan et al., 2013).
In this paper, we present a data driven method to
evaluate the motility index, one of the main aspect
contributing to the frailty estimation, with visual fe-
atures.
We aim to perform a continuous motility asses-
sment of frail persons and to produce reports infor-
ming medical staff in case of medical assistance is
required. We target elderly and people with mild cog-
nitive impairments, partially autonomous, but in need
of a light assistance, possibly in a post-hospitalisation
stage. This study is a part of a larger project whose
aim is to design and implement a model of protected
discharge, in which the patient, after being discharged
from the hospital, is hosted for few days (about one
week) in an apartment. This is novel with respect to
the state of the art, since current literature is based on
long observation of the patient (6-12 month)(Scanaill
et al., 2006), our new challenge is instead to infer the
frailty of the patient in a short time. The facility is lo-
cated within the Galliera Hospital a local hospital in
Genova (Italy) and equipped as a comfortable apart-
ment, where the patient can be monitored by a system
of sensors, while physicians and nurses have the op-
portunity of monitoring the patient remotely. We re-
port an extensive analysis on two sets of data, acqui-
red within the facility. The obtained estimates are in
line with the geriatricians assessment, even if the two
evaluations have been carried out in a different way
and consider different aspects of the overall health
status. The structure of the paper can be summarised
as follows. Firstly, we describe the facility and our
research objectives (Sec. 2). Then we present data
analysis and the obtained results (Sec. 3). The paper
is closed with conclusion and future works (Sec. 4).
2 CONCEPT
In this section we first describe the apartment, then
we summarise the sensors installed in the facility and
the corresponding measurements. The experimental
set up is rich of sensors, we will briefly illustrate all
the devices but, for the purpose of the study, we will
use only a subset of them.
The aim of our project is the continuous monitoring
of the patient’s motility. In particular, we focus on the
automatic estimation of the motility index (see Sec.
3.3) based on walking time and physical activity that,
according to (Fried et al., 2001), are strongly related
to the patients frailty.
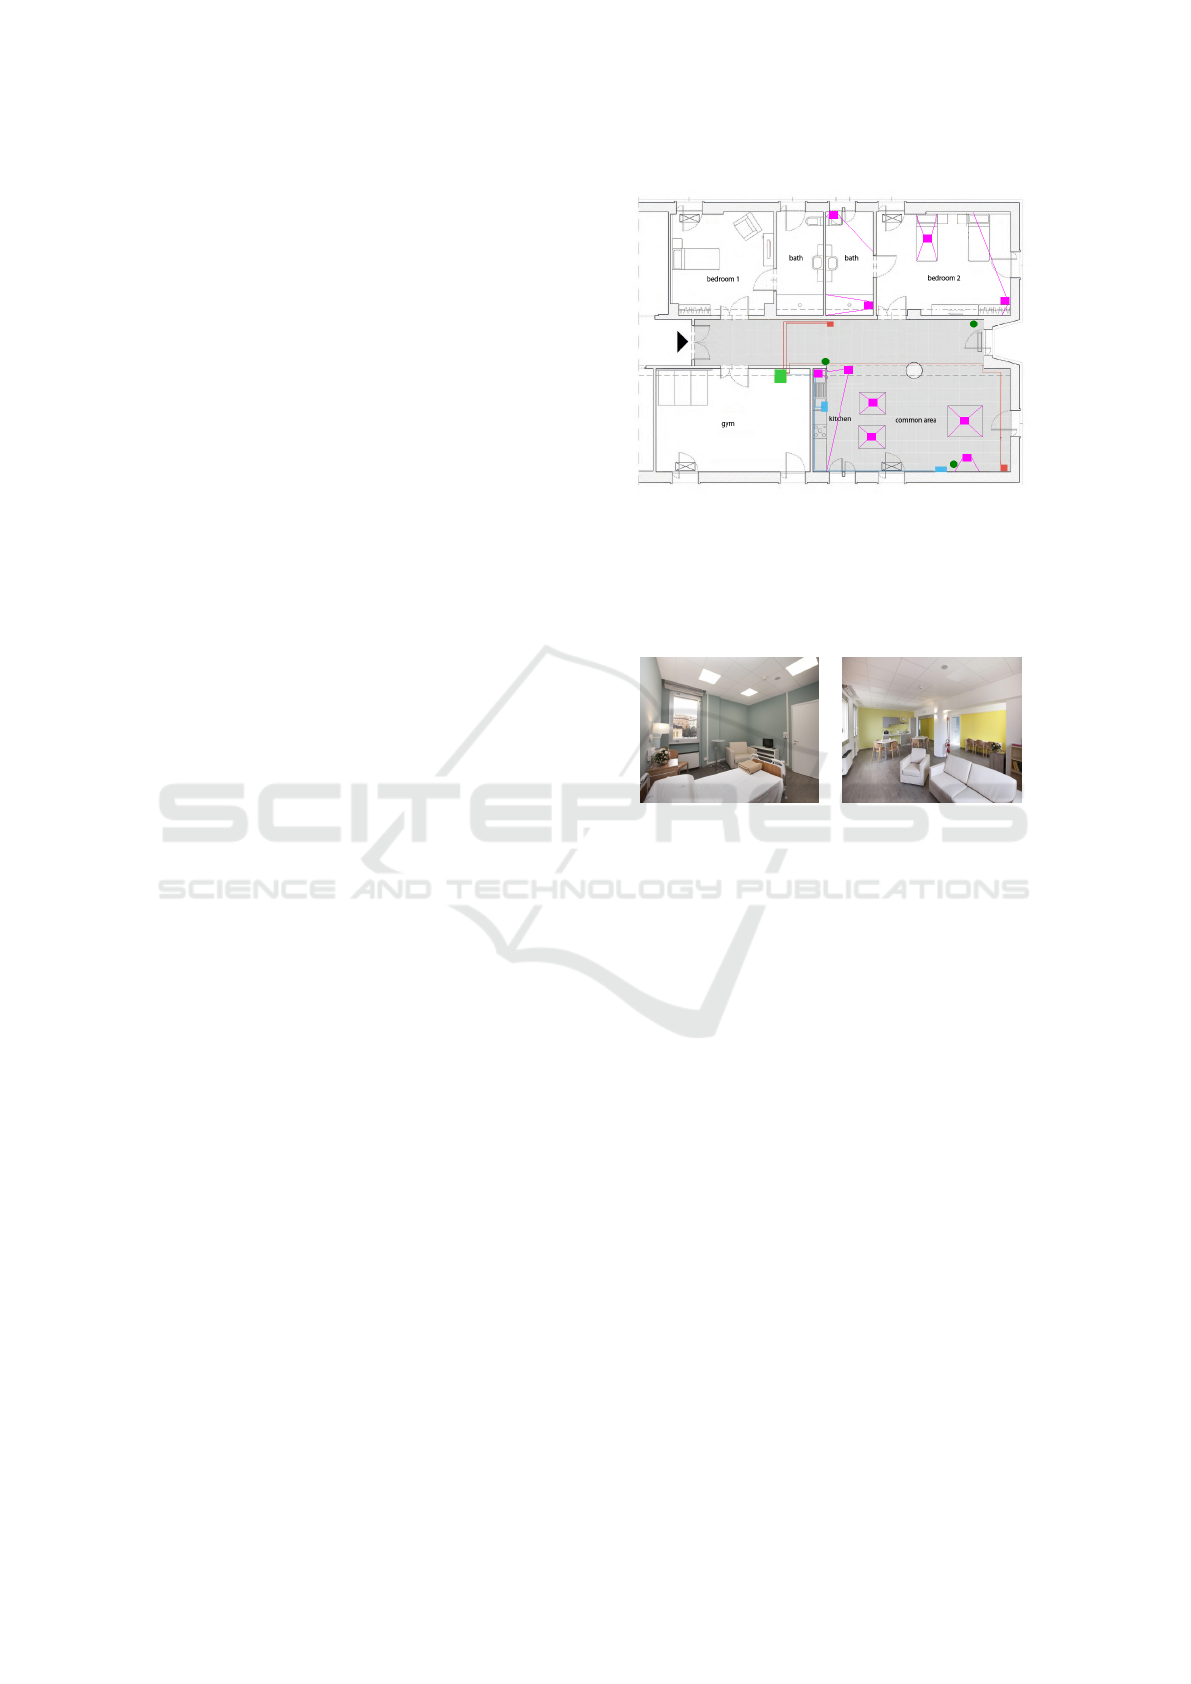
As shown in Figure 1 and Figure 2, the apart-
ment consists of two bedrooms, one with a bed and a
sofa-bed (for an accompanying person) and one with
Figure 1: Apartment plan. Blue rectangles represent the
RGB-D sensors, the small red squares correspond to the ca-
meras. Green circles represent the localisation tags, while
purple rectangles indicate the Passive Infra-red (PIR) sen-
sors and their field of view (through purple lines). They are
all wired to the workstation (green square), placed in the
gym.
Figure 2: Left panel shows one of the two bedrooms, right
panel shows the common room.
two beds (patient and caregiver), a gym, and a com-
mon room with kitchenette and living room. To make
the atmosphere homely, an architectural study was
conducted to choose appropriate colors, arrangements
and furniture, leading to an environment similar to a
regular apartment rather than a hospital room.
The common room, where most of the daily acti-
vities take place, hosts the majority of the sensors,
including cameras and RGB-D sensors, localisation
anchors, presence sensors, occupancy sensors for the
chairs (pressure sensors), usage sensors on some cabi-
net door of the kitchenette (luminosity sensors). He-
alth monitoring devices are located on a console table
in the same area. Bedrooms and bathrooms, for ob-
vious privacy concerns, are only equipped with pre-
sence sensors, which detect whether there is any mo-
vement in the room.
Lastly, presence sensors have also been placed for
monitoring specific meaningful disjointed locations,
such as: the kitchen table, the desk, the bed and the
shower. Similarly, an additional luminosity sensors
has been installed to monitor the status of the TV set.
The redundancy of sensors and measures to moni-
tor similar activities is a design choice that guarantee
the robustness of the results.
VISAPP 2018 - International Conference on Computer Vision Theory and Applications
440

2.1 Distributed Sensors and Health
Devices
For the sake of completeness we first describe all the
non-vision sensors installed in the apartment.
The localisation system, Eliko KIO RTLS
2
, is a
Real Time Locating System (RTLS) based on the Ul-
tra WideBand (UWB) technology, which allows for a
positioning precision of about 30cm. The system is
based on the “tag and anchor” paradigm, which assu-
mes the tag to be always attached to the person and
the anchors to be in fixed, a-priori known locations in
the environment (green dots in Figure 1). The system
allows for a continuous and unambiguous tracking of
the monitored person.
The presence sensors, Aeotek MultiSensor 6
3
, are
devices integrating six channels,incuding the Passive
Infra-Red (PIR) and the light sensors. They have been
placed in different locations (in purple in Figure 1)
and calibrated in such a way to monitor disjointed lo-
cations.
Chair occupancy sensors, SparkFun Force Sensi-
tive Resistor, detect whether there is a load or not on
the chair by monitoring the pressure level measured
below its legs.
For gesture recognition purpose, we endow the pa-
tient with a LG G Watch R5 equipped with a triaxial
accelerometer.
Health Monitoring sensors allow to acquire a mi-
nimal set of vital parameters including: weight, blood
pressure, heart rate, Oxygen saturation SpO2 level,
glucose. To this aim, we identified a set of wearable
and non-invasive devices, selected to guarantee the
patient complete freedom of movement (no cables,
data are transmitted via wireless communication). All
devices are provided by iHealth Labs
4
.
2.2 Vision Sensors
Figure 3 shows the arrangement of visual sensors in
the living room of the apartment, highlighting their
fields of view and overlaps. The RGB-D sensors are
Asus Xtion Pro, acquiring a depth stream with VGA
resolution (640 × 480 pixels, at 30 fps). They co-
ver a field of view of about 58deg horizontal, 45 deg
vertical and 70 deg diagonal, with a range of opera-
tion between 0.8m and 3.5m. The first RGB-D sensor
(RGBD
1
) is located over the kitchen’s sink. Its Field
Of View (FOV) is highlighted in blue in Figure3,
right, and it covers all the kitchen and table area, i.e.
2
http://www.eliko.ee/products/kio-rtls/
3
http://aeotec.com/z-wave-sensor
4
https://ihealthlabs.com/
Figure 3: A sketch of the visual sensors fields of view and
their overlap. Left panel shows the field of view of the two
cameras, while right panel shows the field of view of the
two RGB-D sensors.
where patients are supposed to have breakfast, lunch
and dinner. The second one (RGBD
2
) is located near
the TV in front of the sofa, its field of view is high-
lighted in red in Figure 3 right, and it covers the li-
ving room, i.e. the sofa, the armchair, the library,
and the area of the vital monitoring devices. The ca-
meras, henceforth referred to as CAM
1
and CAM
2
,
are high resolution mini-dome IP cameras acquiring
1920 ×1080 pixels frames at 25 fps. They are located
in the two opposite corners of the room, indicated in
green in Figure 3 left. The mutual position of RGB-D
sensors and cameras is intended to provide a partial
overlap of the fields of view while covering comple-
mentary areas.
3 VISUAL DATA ANALYSIS AND
RESULTS
Figure 4 shows the pipeline of our monitoring sy-
stem, from the acquisition and processing stages, to
the computation of the motility quantities, and to the
estimation of the motility index. Finally, all evaluated
motility quantities and associated statistics are made
available to physicians on a daily report. In the re-
mainder of this section we introduce the dataset, the
motion analysis pipeline and discuss the results.
3.1 Dataset
The dataset we consider in our experimental analysis
is composed of two batches of data acquired with the
help of 10 volunteers.
The first batch is used for validating the system,
the other to assess its performance. All subjects had
not constraints in the apartment, and spontaneously
performed common daily-life activities.
The first batch includes 5 young volunteers (3
male and 2 female, mean age 27±4) who spent at le-
ast 3 days in the facility, alone or in pairs, for a total
of about 123 hours of data. The collected data include
A Visual Computing Approach for Estimating the Motility Index in the Frail Elder
441
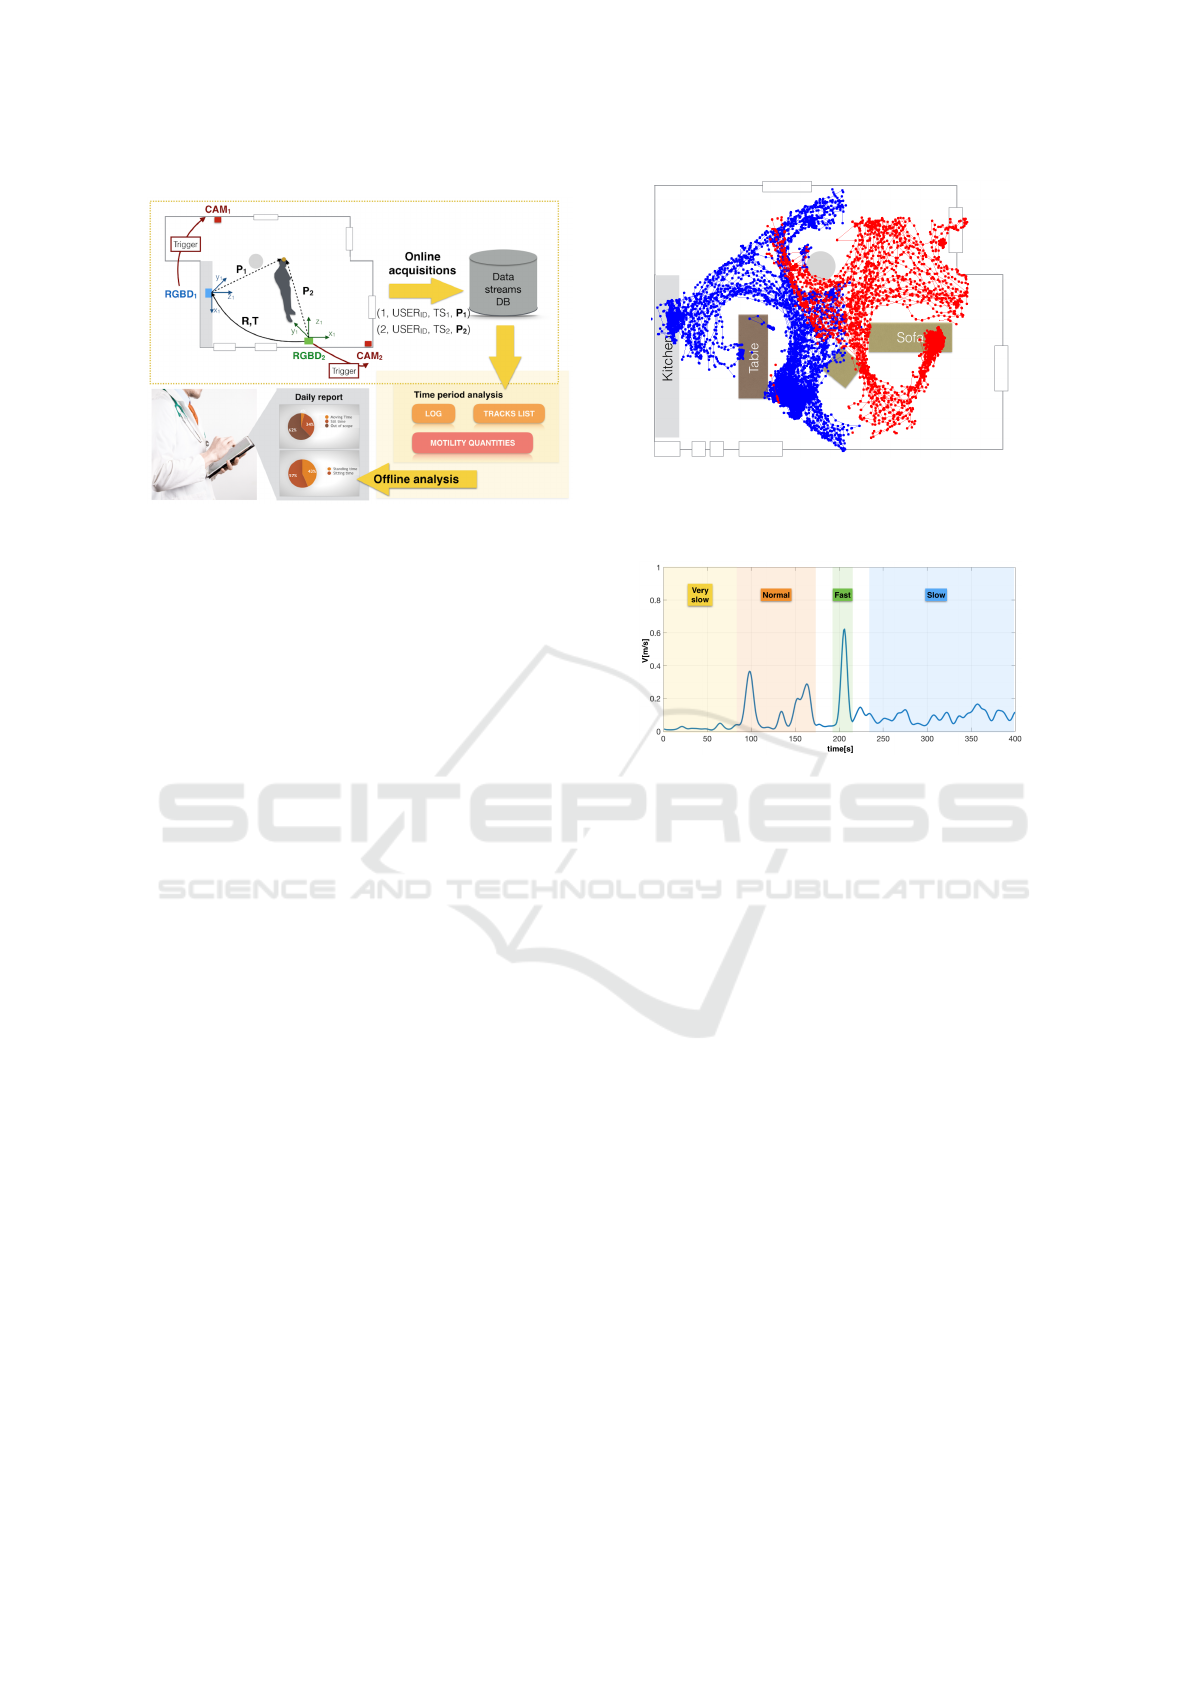
Figure 4: A visual sketch of the pipeline of our system. Vi-
deo acquisition is triggered by the RGB-D depth sensors
which detect the presence of individuals in the common
room. Acquired data are stored online in a Data Base that
makes data available for offline analysis.
simpler and more complex scenarios (single or mul-
tiple persons in the apartment), and they represent a
suitable test-bed for the evaluation of our algorithms.
Our current analysis considers three activities types:
walking, sitting, standing. To provide a quantitative
evaluation of the proposed methods, we selected 5 se-
quences from the data set in which a single subject is
observed, and we carefully annotated them by exploi-
ting the available video sequences. A coarser annota-
tion is provided also for the rest of the data, allowing
us to present a broader quantitative analysis.
The experimental results comparing the geriatric
assessment and the automatic analysis are presented
on data acquired from 5 healthy elder subjects (3 male
and 2 female, mean age 72.4±5.2) who spent at le-
ast two hours each inside the facility alone. During
their stay clinical test were performed by physicians
and data were collected and manually analysed. This
ground truth that incorporates both the geriatric asses-
sment and the manual annotation of the data is sum-
marised in Table 1.
3.2 Localisation
The first task we need to address, prior higher level
analysis, is localisation. The goal of localisation is
to determine, at each time instant, the position of a
person in the apartment. For this task we used the
information coming from the RGB-D depth sensors
providing (X,Y, Z) coordinates of the body joints.
Figure 5 provides an overall visual impression of
the localisation obtained by RGB-D sensors installed
in the common room, considering measures obtained
on a temporal span of 30 minutes. The figure clearly
shows the complexity of the trajectories collected in
Figure 5: A visual impression of the trajectories collected
in the environment. A volunteer was asked to perform nor-
mal daily activities for 30 minutes (points are color-coded
according to the acquisition sensor).
Figure 6: Estimation of the velocity of a person moving at
different speeds.
the environment by the RGB-D sensors. The maps
are computed automatically and incorporate informa-
tion from the two different sensors, one of which is
considered as a reference frame (blue dots), while the
other is related to the reference frame through a rigid
roto-translation transformation which is learnt from
data (red dots). As expected (see also Figure 3 right),
there are a few blind spots. This issue will be easily
overcome by integrating data from the cameras.
Notice how from a simple analysis of these data it is
immediate to identify regions of the common room
where the volunteers spend most of the time, e.g. sit-
ting at the bottom-right corner of the table, at the rig-
htmost part of the sofa, or standing at the kitchen.
3.3 Motility Analysis
In this section we aim at automatically analyse pa-
tient’s motility and postural transfers.
We first consider a low-level motion feature, i.e.,
an estimate of instantaneous velocity which we derive
directly from localisation measurements. In Figure
6 we provide an example of a velocity estimation in
which a subject has been asked to walk at different
speeds. As it can be noticed, the different dynamics
are nicely estimated.
At a higher level, we compute the following mo-
VISAPP 2018 - International Conference on Computer Vision Theory and Applications
442

Table 1: Geriatric evaluation of 5 elder subjects in good health: summary of the geriatricians assessment, in terms of MPI
(Multidimensional Prognostic Index), gait speed measured during test by physicians in a 4 meters walk. The last three columns
report a manual annotation carried out by the authors on the percentage of time spent standing still, sitting or walking.
ID Gender Age MPI Measured Gait Speed [m/s] % STILL % SIT % MOVING
#v1 M 68 0.063 1.299 20 54 26
#v2 M 71 0.063 1.026 15 71 14
#v3 M 66 0.125 1.556 26 50 24
#v4 F 79 0.125 0.875 19 62 19
#v5 F 78 0.188 1.084 4 89 7
Table 2: A summary of the quantitative analysis on the motility quantities we performed on 5 annotated sequences. When
appropriate, we report the ground truth value between brackets. The final column reports the estimates of the motility index.
Seq. Age Time T
sit
[s] T S[s] T M[s] T R
2st
T R
2sit
W S MI
[min]
#u1 23 90 496 (478) 74 (79) 283 (296) 10 (8) 8 (8) 6 (5) 13 (14) 0.65
#u2 22 150 5239 (5260) 752 (755) 1189 (1165) 20 (23) 21 (23) 37 (38) 57 (48) 0.83
#u3 24 120 202 (224) 164 (174) 213 (181) 5 (5) 5 (5) 11 (13) 10 (12) 0.60
#u4 36 30 128 (126) 84 (79) 377 (384) 9 (10) 8 (10) 9 (9) 18 (14) 0.34
#u5 40 30 92 (99) 81 (77) 167 (196) 3 (3) 3 (3) 7 (7) 7 (7) 0.46
tility quantities, identified with the help of geriatrici-
ans:
- Number of postural changes, i.e. from sitting
to standing (T R
2st
) and vice-versa (T R
2sit
): this
is done by looking at the variation in heights of
the detected skeletons (through RGB-Ds) in the
scene;
- The total time spent moving (T M), standing still
(T S), and sitting (T
sit
): this is done by checking
the variation in the distribution of the velocity mo-
dulus;
- Number of instances of walk (W ) – i.e. how many
times, in a given observation period, people start
walking – and stop (S) events;
- Longest walk distance;
- Longest walk time.
Such quantities are empirically estimated accor-
ding to (Chessa et al., 2017) analysing the instanta-
neous measures or series of temporally adjacent ob-
servations. More specifically we follow an approach
based on thresholding the y coordinate of the skeleton
representation and the velocity (see Figure 6). Then,
some of them are used to compute the motility index
which we see as a first quantitative continuous contri-
bution to the frailty index.
We formalise the estimation of the motility index
MI on the time period T as follows
MI(T ) = (1 − α)
T
sit
+ T S
T T
+
+ α
C
1 −
T R
2sit
+ T R
2st
+W + S
T T
where the first term quantifies the percentage of
inactivity time, while the second determines the
relative amount of postural and dynamic transitions
with respect to the entire time period (T T ). The
parameter α is a value to be chosen to weight the
importance of the two terms of the equation, while
C is a factor to make the second term numerically
comparable with the first one. The motility index
takes values between 0 and 1, approaching 1 when
the motility of the subject is not satisfactory.
A coarse quantitative analysis carried out on all
the sequences of the young volunteers (for which we
have a partial annotation available) shows an accu-
racy in estimating the overall moving time of ∼ 95%.
Users are correctly associated with a sitting state with
an accuracy of ∼99%, and the percentage of correctly
detected sit-to-stand transitions is ∼ 79%. Table 2
reports a more detailed experimental analysis perfor-
med on the 5 fully annotated sequences of young vo-
lunteers. All the above mentioned measurements have
been assessed, and the estimate of the overall MI is
reported. The latter can not be associated with an ob-
jective ground truth, but we can comment on the ap-
propriateness of the estimate with respect to a diary of
activities maintained by the volunteers. For instance,
in sequence #2 the volunteer spent most of the time
sitting (about the 83% of the total time of observation)
and this corresponds to a high value of MI. Conver-
sely, the dynamism of subject for sequence #4 is ri-
cher (the volunteer spent about the 64% of the total
time walking around the apartment), thus the motility
index is much lower.
Table 3 reports an analysis on the set of data acqui-
red with elderly healthy patients. We first observe
A Visual Computing Approach for Estimating the Motility Index in the Frail Elder
443
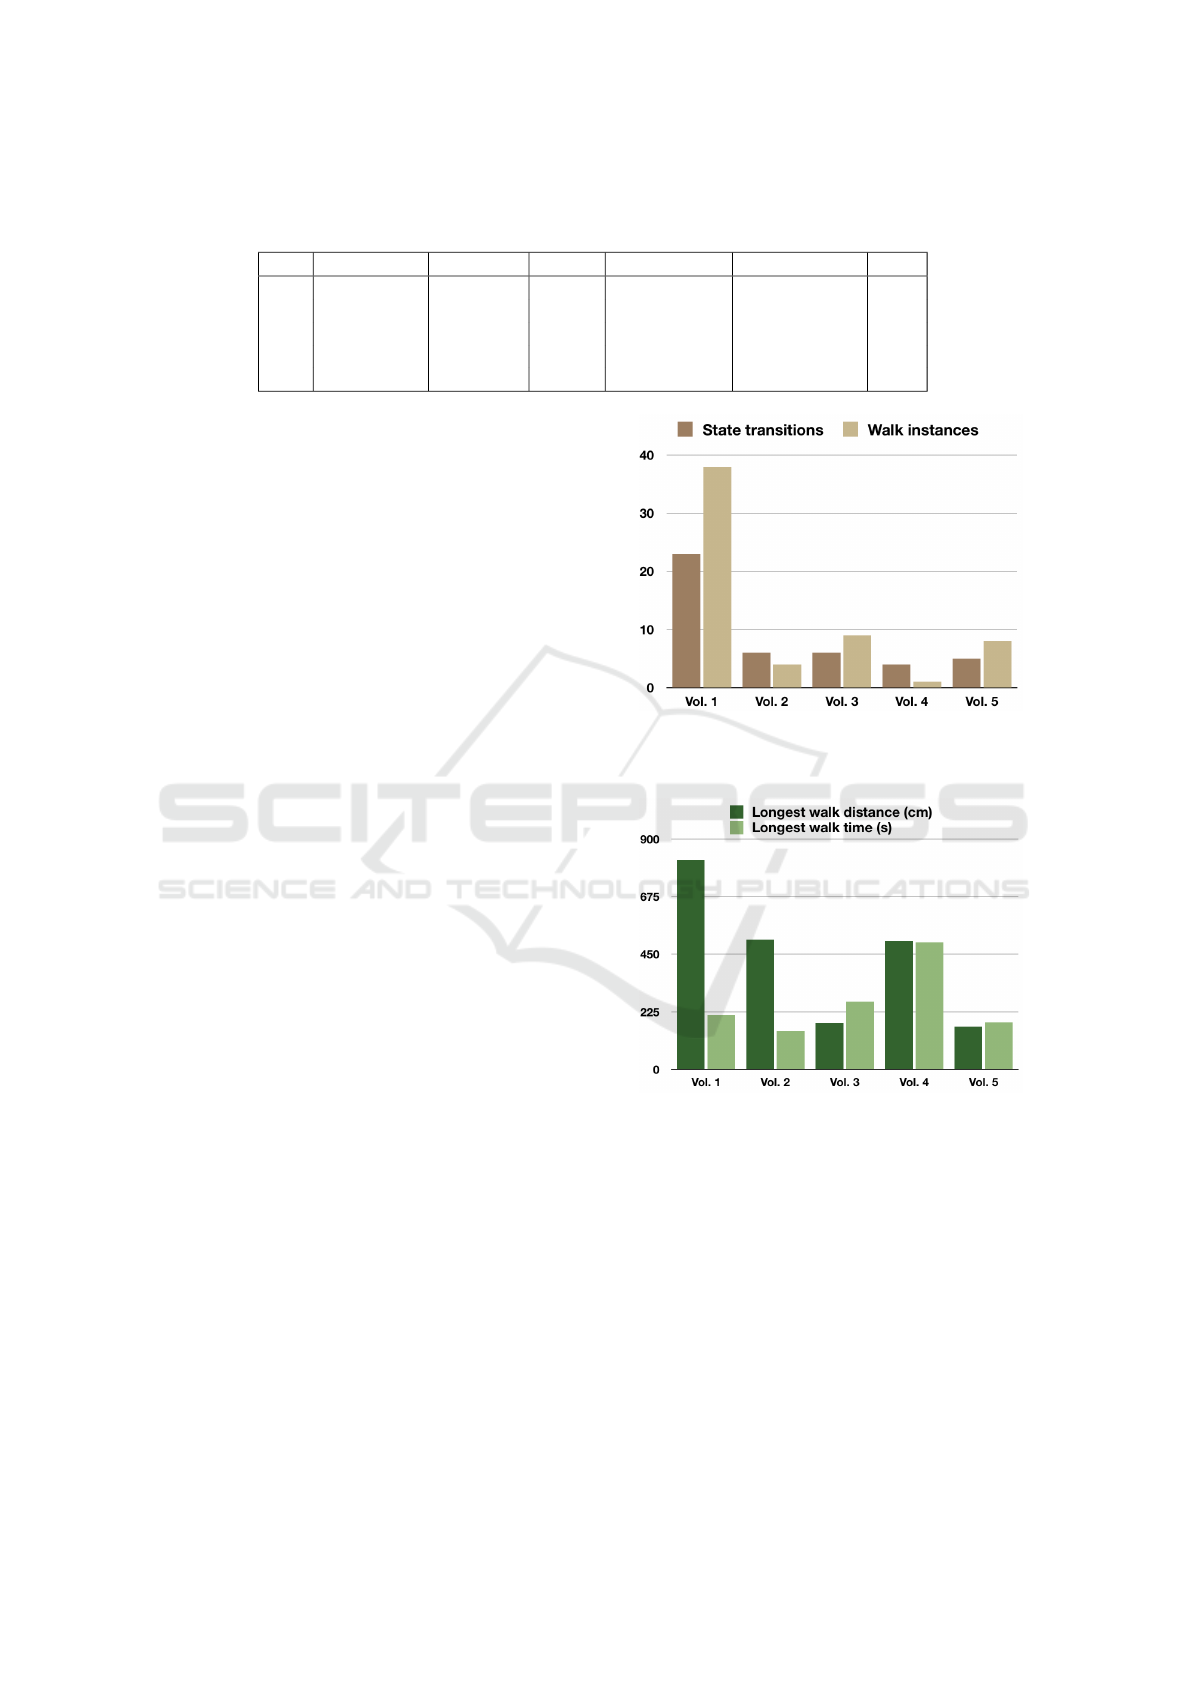
Table 3: Automatic evaluation of 5 elder subjects in good health: the observation time, the estimated percentage of time spent
standing still, sitting, or walking, the estimated average speed, and the overall estimated motility index (MI).
ID Time [min] % STILL % SIT % MOVING Avg. Velocity MI
#v1 150 22 52 26 0.39±0.21 0.52
#v2 90 12 70 18 0.27±0.19 0.62
#v3 90 24 51 25 0.31±0.21 0.70
#v4 30 19 61 20 0.19±0.12 0.82
#v5 120 9 86 5 0.26±0.18 0.91
how our estimate, in percentage, of the amount of
time spent by patients in standing, sitting, moving
state is very coherent with the manual annotation per-
formed in Table 1. We can also notice that our estima-
ted average speed, albeit difficult to compare with the
speed estimated by geriatricians in a single walk, pro-
duces the same relative ordering among volunteers.
Lastly, the motility index produces a result which is
very much in line with the reported MPI: in particu-
lar, the healthier volunteer is #v1, the weaker is #v5.
From this analysis it appears that the MI could effecti-
vely complement and enrich the MPI estimation.
Finally, Figures 7 and 8 report for each volunteer
the details on some of the estimated motility quanti-
ties carried out on the elderly volunteer data. Figure 7
shows the average number of state transitions (T R
2sit
,
from stand to sit and T R
2st
from sit to stand) and the
number of walk instances in the observed time span.
Figure 8 reports for each subject the longest walk dis-
tance and the longest walk time: here in particular
we notice how #v1 walks faster and spans longer dis-
tances than other subjects, confirming the conclusions
obtained from the motility index.
4 CONCLUSION AND FUTURE
WORKS
In this paper we presented a visual computing appro-
ach to estimate frailty in elderly based on the evalua-
tion of the motility index. The experimental setup is a
protected discharge facility which has been planned,
implemented, and validated within the Galliera Hos-
pital. After being discharged from the hospital, the
patients are hosted in the apartment for a few days.
Here, a system, based on vision sensors, continuously
assesses patients’ motility index while physicians and
nurses have the opportunity of monitoring them re-
motely.
The system was validated on 5 volunteers and tes-
ted on 5 healthy elder subjects. The results are very
encouraging, as they show correlation between the au-
tomatic motility evaluation and the corresponding cli-
nical analysis performed by the physicians. Hence,
Figure 7: Number of state transitions evaluated as the
average of T R
2sit
and T R
2st
and walk instances W for each
volunteer (#v1 to #v5).
Figure 8: Longest walk distance and walk time for each
volunteer (#v1 to #v5).
the motility index may be used as a valid integration
to the frailty index, with the advantage of a continu-
ous, automatic and objective assessment.
In the next future we aim at adding further dimen-
sions to the assessment of frailty, by integrating data
coming from all different devices installed in the fa-
cility. The investigation of other physical and cog-
nitive domains will allow the evaluation of frailty in
the widely used context of the multidimensional as-
sessment according to the International Classification
of Functioning, Disability and Health.
VISAPP 2018 - International Conference on Computer Vision Theory and Applications
444

ACKNOWLEDGEMENTS
The authors are indebted to the Associazione Volon-
tari Ospedalieri (A.V.O) association for their precious
help in the data collection process.
REFERENCES
Angleman, S. B., Santoni, G., Pilotto, A., Fratigli-
oni, L., Welmer, A.-K., Investigators, M. P., et al.
(2015). Multidimensional prognostic index in asso-
ciation with future mortality and number of hospital
days in a population-based sample of older adults: re-
sults of the EU funded MPI AGE project. PloS one,
10(7):e0133789.
Bathrinarayanan, V., Fosty, B., Konig, A., Romdhane, R.,
Thonnat, M., Bremond, F., et al. (2013). Evaluation
of a monitoring system for event recognition of older
people. In Advanced Video and Signal Based Surveil-
lance (AVSS), 2013 10th IEEE International Confe-
rence on, pages 165–170.
Cao, Y., Tao, L., and Xu, G. (2009). An event-driven con-
text model in elderly health monitoring. In Ubiqui-
tous, Autonomic and Trusted Computing, 2009. UIC-
ATC’09. Symposia and Workshops on, pages 120–
124. IEEE.
Chessa, M., Noceti, N., Martini, C., Solari, F., and Odone,
F. (2017). Design of assistive tools for the market. In
Leo, M. and Farinella, G., editors, Assistive Computer
Vision (SUBMITTED). Elsevier.
Fried, L. P., Ferrucci, L., Darer, J., Williamson, J. D., and
Anderson, G. (2004). Untangling the concepts of di-
sability, frailty, and comorbidity: implications for im-
proved targeting and care. The Journals of Geronto-
logy Series A: Biological Sciences and Medical Scien-
ces, 59(3):M255–M263.
Fried, L. P., Tangen, C. M., Walston, J., Newman, A. B.,
Hirsch, C., Gottdiener, J., Seeman, T., Tracy, R., Kop,
W. J., Burke, G., et al. (2001). Frailty in older adults:
evidence for a phenotype. The Journals of Geronto-
logy Series A: Biological Sciences and Medical Scien-
ces, 56(3):M146–M157.
Liu, R. and Liu, M. (2010). Recognizing human activities
based on multi-sensors fusion. In Bioinformatics and
Biomedical Engineering (iCBBE), 2010 4th Internati-
onal Conference on, pages 1–4. IEEE.
Pilotto, A., Ferrucci, L., Franceschi, M., D’Ambrosio, L. P.,
Scarcelli, C., Cascavilla, L., Paris, F., Placentino, G.,
Seripa, D., Dallapiccola, B., et al. (2008). Develop-
ment and validation of a multidimensional prognostic
index for one-year mortality from comprehensive ge-
riatric assessment in hospitalized older patients. Reju-
venation research, 11(1):151–161.
Scanaill, C. N., Carew, S., Barralon, P., Noury, N., Lyons,
D., and Lyons, G. M. (2006). A review of approaches
to mobility telemonitoring of the elderly in their li-
ving environment. Annals of biomedical engineering,
34(4):547–563.
Volpato, S., Daragjati, J., Simonato, M., Fontana, A., Fer-
rucci, L., and Pilotto, A. (2016). Change in the mul-
tidimensional prognostic index score during hospi-
talization in older patients. Rejuvenation research,
19(3):244–251.
Volpato, S., Onder, G., Cavalieri, M., Guerra, G., Sioulis,
F., Maraldi, C., Zuliani, G., Fellin, R., of Pharmacoe-
pidemiology in the Elderly Study (GIFA, I. G., et al.
(2007). Characteristics of nondisabled older patients
developing new disability associated with medical ill-
nesses and hospitalization. Journal of general internal
medicine, 22(5):668–674.
Zouba, N., Bremond, F., and Thonnat, M. (2010). An acti-
vity monitoring system for real elderly at home: Va-
lidation study. In Advanced Video and Signal Based
Surveillance (AVSS), 2010 Seventh IEEE Internatio-
nal Conference on, pages 278–285. IEEE.
A Visual Computing Approach for Estimating the Motility Index in the Frail Elder
445
