
Video-based Patient Monitoring System
Application of the System in Intensive Care Unit
Vladimir Kublanov
1
, Konstantin Purtov
1
and Mikhail Kontorovich
2
1
Research Medical and Biological Engineering Center of High Technologies, Ural Federal University,
Mira str. 19, 620002, Yekaterinburg, Russian Federation
2
Department of Anesthesiology and Resuscitation, Regional Anti-Tuberculous Dispensary,
Chapaeva str. 9, 620142, Yekaterinburg, Russian Federation
Keywords: Remote Sensing, Remote Photoplethysmography, Respiration Monitoring, Intensive Care Unit, Video
Processing.
Abstract: The paper presents the video-based monitoring system to assess the physiological parameters and patient
state in intensive care unit. It allows to measure thoracic and abdominal breathing movements, remote
plethysmography signals, tissue perfusion, patient activity and changes in psycho-emotional state. Thus, the
system provides a comprehensive assessment of patient state without contact. The system works in usual
illumination conditions of intensive care unit and consists of a personal computer with specialized software
and two low-cost Logitech C920 webcams with RGB sensors (8 bit per channel), 30 Hz sampling frequency
and 640x480 pixel resolution. The webcams were placed at a distance of 80 cm above the patient’s body.
The software provides automatic assessment of psychophysiological parameters and determination the
following patterns: heart rate, heart rate variability, asystole and arrhythmias, breathing rate, spontaneous
breathing recovery, breathing muscle tone and patient consciousness recovery, motor activity and control of
ventilation parameters. The proposed system can be used as an additional diagnostic tool of anesthesia
equipment for non-invasive patient monitoring in intensive care unit.
1 INTRODUCTION
Modern clinical monitoring devices presuppose the
presence of a large number specialized contact
sensors placed on patient body for continuous
evaluation of vital physiological parameters. The
minimal set of intensive care unit equipment consist
of pulse oximeter, multichannel electrocardiograph,
impedance pneumograph, temperature sensor, and
tonometer. An additional equipment depends on
specific diseases of the patient.
Contact-based equipment connection requires
approximately 5 minutes by a pre-trained medical
staff. It is more difficult to maintain constant contact
with equipment in stressful situations, for example,
when the patient wakes up and trying to move hands
or change position of the body. In that case, the
quality of patient monitoring procedure largely
depends on intensity care unit staff discipline,
because it is necessary to provide constant visual
control of patient condition by a nurse or in specific
situations by a doctor.
At present time, video-based remote
measurement technologies are continuously
investigating. The recent technologies remote and
imaging photoplethysmography (Wang et al., 2017),
optoelectronic plethysmography (Aliverti et al.,
2000) allow to measure skin blood volume changes
and chest wall respiratory movements, respectively.
In this work the non-invasive video-based patient
monitoring system for intensive care unit was
proposed. It does not require any contacts with
patient body and potentially allows to reduce
presence time of qualified medical personnel near to
patient bed. The proposed system contains modules
which measure the physiological parameters and
changes in patient psycho-emotional state. Thus, it
allows to monitor functional state for patients with
limitation of use conventional contact devices.
In general, the proposed video monitoring
system can be used as an additional device of
non-invasive patient monitoring systems to obtain
complex psychophysiological information in
conjunction with anesthesia equipment.
132
Kublanov, V., Purtov, K. and Kontorovich, M.
Video-based Patient Monitoring System - Application of the System in Intensive Care Unit.
DOI: 10.5220/0006598101320139
In Proceedings of the 11th International Joint Conference on Biomedical Engineering Systems and Technologies (BIOSTEC 2018) - Volume 2: BIOIMAGING, pages 132-139
ISBN: 978-989-758-278-3
Copyright © 2018 by SCITEPRESS – Science and Technology Publications, Lda. All rights reserved
2 MATERIALS AND METHODS
The proposed system, consists of only inexpensive
and accessible components which are selected as a
most suitable for common conditions of intensive
care unit. In particular, the most important criteria
for webcams were possibility of a reliable
determination remote plethysmography signals with
minimal intrinsic noise and ability to turn off
automatic image correction settings. The system
software was developed on the basis of real-time
algorithms to provide working abilities on an
ordinary personal computer.
2.1 System Architecture
Since all components of the system are affordable
and widespread, the greatest difficulty in creating
such system are analysis and development of video
processing technologies, designing system
architecture for physician needs with taking into
account performance requirements.
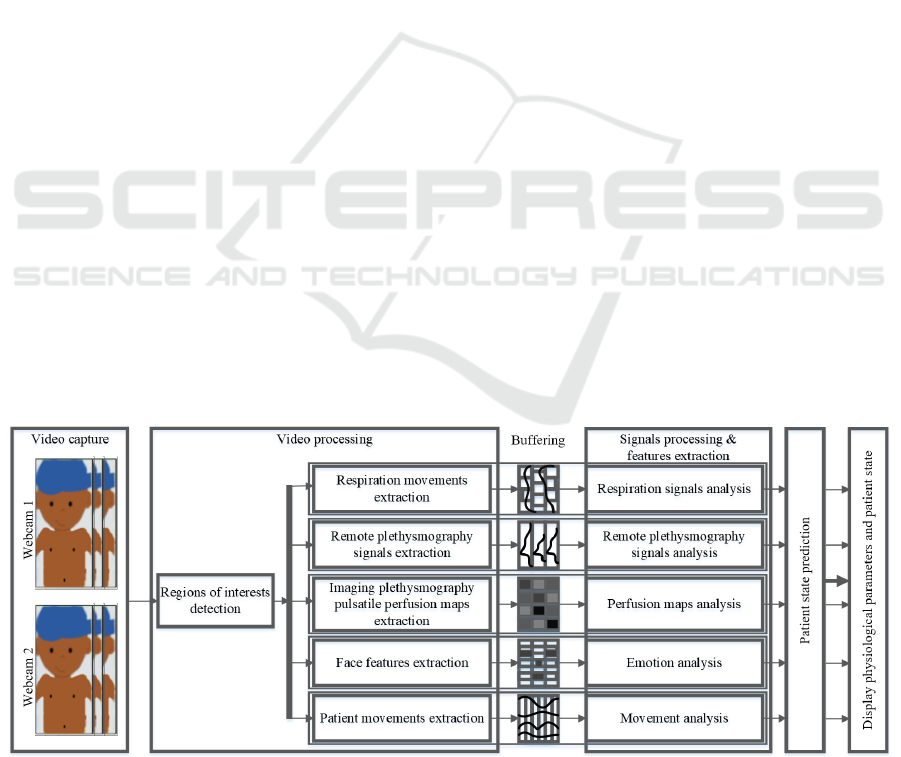
The software architecture of the proposed video
monitoring system is shown in Figure 1.
Architecture structure can be conditionally
represented as a set of consecutive stages and
processing modules. The stages are conventionally
determine logical separation of video processing and
data analysis procedures to consecutive set of
operations. Each psychophysiological measurement
technology was separated as a software module.
Stages of the proposed system:
1) Video capture. This is the first stage, where
the set of frames from two or more video
cameras is recorded and transmitted for
further calculations;
2) Video processing. This is the most
computationally intensive stage where
received videos are processed as a sequence of
frames to measure the significant
physiological signals, psycho-emotional
features and attributes. All these data are
transmitted for further analysis in the next
stages;
3) Buffering. The buffering stage allows to
analyze the received data in the frequency and
time domains in the subsequent stages, and
estimate intensity of occurring changes,
depending on individual buffer sizes for each
module;
4) Signals processing and features extraction. At
this stage, analysis of received data buffers is
performed to determine the quality of
measured signals and calculate significant
physiological parameters and patterns, such as
respiratory rate and heart rate.
5) Patient state prediction. A comprehensive
analysis of measured physiological parameters
is an important part of modern patient
monitoring systems. These part is responsible
for detecting and informing medical staff
about existing problems and emergency
situations.
6) The display of patient state and physiological
parameters assessment. This is the final stage
where the physiological parameters and
signals of patient state were presented on
display with audio notification in emergency
situations. At this stage the software should
allow to customize interfaces and predefined
conditions to provide the features and signals
which are necessary for a doctor.
Figure 1: Block diagram of system architecture.
Video-based Patient Monitoring System - Application of the System in Intensive Care Unit
133

Determination of physiological parameters
according to above mentioned stages was carried out
by following modules:
▪ Regions of interest detection. This module is
designed to automatically determine locations
of various parts of the patient's body on the
image. The choice of parts (regions of
interest) can be determined or adjusted by a
doctor depending on individual patient
characteristics or diseases and the structure of
the patient's body. In general, the module
allows to detect:
▪ the face region, landmarks, structure features
and direction of sight (King, 2015);
▪ right and left lung regions, with projections
of each lung lobe onto the chest wall;
▪ abdominal regions: epigastric, umbilical,
hypogastric, bilateral-subcranial, flank and
iliac regions;
▪ regions marked by a doctor as a cross;
▪ Respiratory movements extraction and
analysis. Using of respiratory movements
evaluation technics can be considered as an
optimal way to diagnose respiratory
parameters (Aliverti et al., 2000). This module
assesses respiratory movements and their
characteristics in various regions of interest in
different directions. The dynamic changes of
respiratory movements are measured
(Brochard et al., 2012; Hess et al., 2015);
▪ Imaging plethysmography analysis. Imaging
plethysmography technology was firstly
proposed by Vladimir Blazek group (Blazek et
al., 1996) .That allows to measure and create a
maps of skin perfusion. At the moment,
significant achievements in this direction are
made at the works (Kamshilin et al., 2015;
Moco et al., 2016). The recent work (Rubins
et al., 2017) proposed that perfusion maps can
be used to analyze the depth of anesthesia;
▪ Remote plethysmography signals extraction
and analysis. Remote photoplethysmography
(rPPG) technology is different than imaging
photoplethysmography. The goal of that
technology is to obtain the best pulsation
signal, assuming that in selected region the
skin perfusion changes occur almost
simultaneously. The main achievements in
this technology are presented in following
works: (de Haan and Jeanne, 2013a;
Lewandowska et al., 2011; Poh et al., 2010;
Sun et al., 2013; Verkruysse et al., 2008;
Wang et al., 2017).
Thus, above mentioned modules provide control
over main physiological parameters and patterns
recorded by using the anesthesia equipment and
bedside monitoring systems.
It is well known that, medical personnel should
carry out continuous visual observation of changes
in psycho-emotional state, check movement’s
activity and position of the body to ensure the safety
of patients in the intensive care unit and conduct
timely adequate medical and diagnostic procedures.
Modern video processing technologies allow to
register and analyze these parameters which are
inaccessible to contact methods. In the proposed
system for solving similar problems, the following
modules are used:
▪ Patient face feature extraction and
psycho-emotional state analysis. Modern
video processing technics allows to assess
person psycho-emotional state by
measurements of facial expression changes
according to existing emotion models (Sun et
al., 2004). For example, the sudden pain state
can be observed as a fast dynamic expression
changes with high rate of motor activity.
Grimaces and facial distortions can be a
consequence of an insufficient level of
sedation. A fast and periodic jaw movements
can indicate an unintended hypothermia,
which requires additional medical staff
activity;
▪ Patient movements extraction and analysis.
This module produces a qualitative and
quantitative assessment of patient movement’s
activity by real-time tracking body and head
position. The unnatural position of the body
may indicate the presence of internal or
external irritating factors. Excessive motor
activity during the recovery of consciousness
is also an important factor, which required
constant monitoring, especially with artificial
ventilation. Thus, patient position on the bed,
motor activity and stress level on previous
module may help to predict the awake
moment.
The combination of these modules and steps
allows to create a new system that provides
registration of many conventional physiological
parameters. At the same time, it offers additional
possibilities due to evaluation of skin perfusion,
analysis of psycho-emotional state and movements
of the patient. In the future, such structure provides
easy integration of new technologies for estimating
physiological parameters. They can be added in
form of additional separated modules.
BIOIMAGING 2018 - 5th International Conference on Bioimaging
134
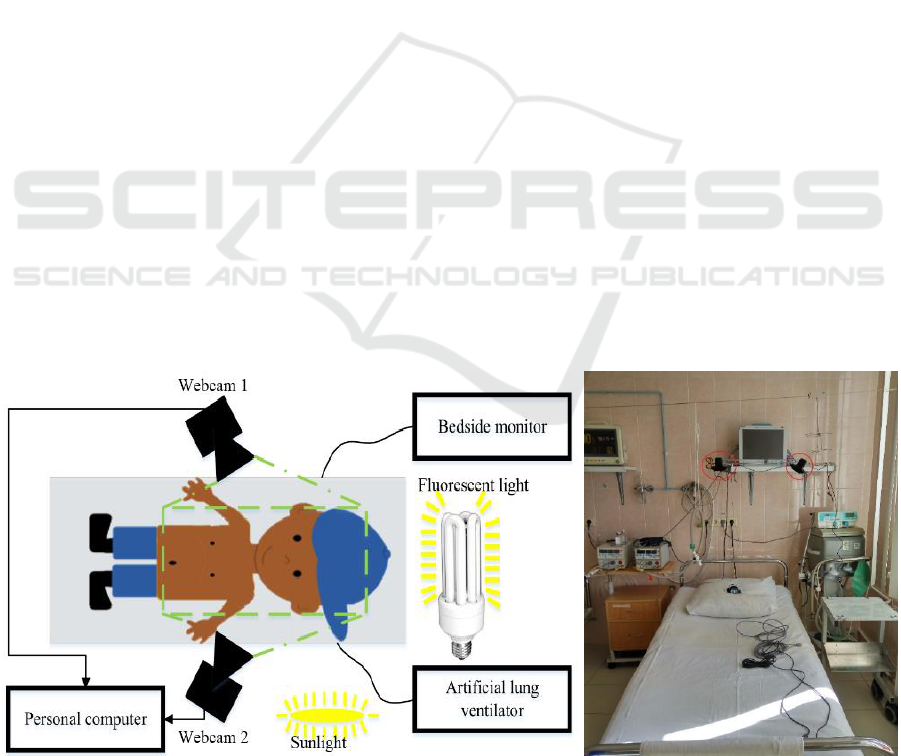
2.2 Experiment
The system was tested on the video data which were
recorded at the Department of Anesthesiology and
Resuscitation of Regional Anti-Tuberculosis
Dispensary (Yekaterinburg, Russia). The study
involved 17 patients (male and female) aged from 24
to 76 years with surgical lung diseases. Each patient
provided written informed voluntary consent prior to
study procedures. Immediately before the study each
patient underwent surgery operation on the thoracic
cavity. The example of scheme and study conditions
were presented in Figure 2.
After the operation in nearest postoperative
period, patients enter the intensive care unit where
they have regained consciousness from 30 minutes
up to 2 hours on artificial ventilation until full
recovery of muscle tone, consciousness and
adequate spontaneous breathing is made.
The artificial ventilation was provided by using
two different types of ventilation devices. The
choice of the device was made by the doctor,
depending on patient diseases. 16 patients were
ventilated by using the high frequency jet-ventilator
(HFJV) ZisLine JV100A (Triton Electronics
Systems Ltd., Russia, registration №2010/08739).
1 patient was ventilated by using mechanical
ventilator ZisLine MB200 (Triton Electronics
Systems Ltd., Russia, EC registration
№D1237200008).
To measure reference physiological signals, the
contact bedside monitor MP 6-03 (Triton Electronics
Systems Ltd., Russia, registration №2007/00597)
was used. It allows to independently and
simultaneously measure the electrocardiography
(ECG), photoplethysmography (PPG), impedance
pneumography, blood pressure signals and obtain
more complex and informative parameters, such as
blood oxygen saturation, magnitude of cardiac
output, peripheral vascular resistance, respiratory
rate, heart rate and some other values.
The illumination in intensive care unit was made
by fluorescent lamp sources which selected and
placed in accordance with requirements of Russian
standard for medical equipment SanPiN 2.1.3.2630-
10 dated May 18, 2010. The part of illumination was
provided by sunlight entering through the window as
shown in Figure 2b).
The experiments were recorded in lossless LAGS
format with 1-minute-long sequences of AVI
containers by using two low-cost Logitech C920
webcams located above the patient’s body at a
distance of 80 cm. Each camera was installed to
capture frames which contain patient face and body
(down to the waist), as shown in Figure 2a). Each
frame was captured with 640x480 pixels resolution
in RGB format (8 bit per channel) and 30 Hz
sampling frequency. The full database size is 1.5 TB
of video and 100 MB of source signals.
Video processing and analysis were carried out
by using a personal computer and specialized
software, created in accordance with the previously
mentioned architecture. The software was written in
C++ with the use of open-source libraries and
frameworks OpenCV, FFmpeg and others. It is
allow to measure all above mentioned parameters
and signals in real-time with using less than 500 Mb
RAM memory per camera.
a) b)
Figure 2: Experiment: a) experiment scheme, b) photo of experimental conditions (webcams are marked as red circles,
HFJV was placed on the left side, mechanical ventilator was placed on the right side, bedside monitor stayed on the rack).
Video-based Patient Monitoring System - Application of the System in Intensive Care Unit
135
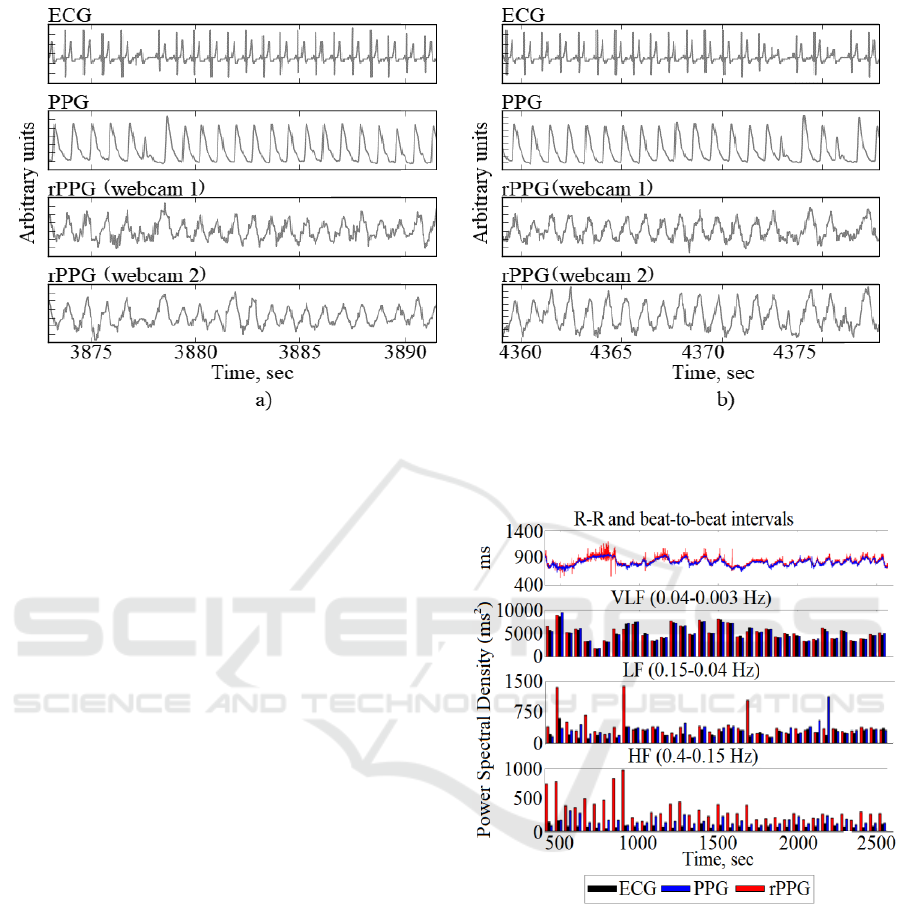
Figure 3: The synchronized ECG, PPG and rPPG signals with examples of a) asystole and b) arrhythmia diseases.
3 RESULTS
The immediate postoperative period is having one of
the most stressful conditions for many patients. For
example, the heart rate and heart rate variability,
respiration rate are significantly greater than in
normal patient state. Moreover, during stress more
heart and other diseases are occurring. Therefore, the
measuring techniques must be sensitive and operate
in difficult conditions.
In our previous works (Kublanov and Purtov,
2015), as well as the work of other researchers (de
Haan and Jeanne, 2013b; Wang et al., 2017), the
possibility of recording the heart rate from rPPG
data was shown with an accuracy of about 2 beats
per minute compared to data recorded by the ECG
and PPG signals. It should be noted that there are a
delay and differences between heart beats measured
by those signals, because of the fact that they are
formed by various technics in different areas of the
patient’s body.
Figure 3 present the examples of heart failures
such as asystole and arrhythmia on the
simultaneously recorded ECG, PPG signals and
rPPG signals obtained independently by two
web-cameras from patient 5. There are the first
examples of cardiac disorders by using the rPPG
technology. It can be noted that rPPG and PPG
signals have a different wave shape, but at the
moments of asystole or arrhythmia both of them
have a cardiac pulse with a much smaller amplitude
than in normal condition.
Figure 4: The example of power spectral density values of
ECG, PPG and rPPG signals during the HFJV.
Earlier, at work (Kublanov et al., 2017) we
showed the possibility of determining the parameters
of heart rate variability under normal patient
conditions. Figure 4 shows examples of power
spectral density for high frequency (HF), low
frequency(LF), and very low frequency (VLF) bands
of heart rate variability signals measured by rPPG,
ECG, and PPG techniques for patient 1 who
underwent the surgical operation less than 10
minutes ago. It can be noted that, as in our earlier
work, the power spectral density values obtained in
BIOIMAGING 2018 - 5th International Conference on Bioimaging
136
the VLF and LF bands are similar between ECG,
PPG and rPPG. At the same time, in the HF band,
the assessments of all of them has a different
quantitative and qualitative values.
rPPG signal in period started from 0 second up to
1000 second contained the noise caused by medical
procedures, which have an influence on the intensity
of patient's face illumination. That is the reason of
significant variations of power spectral density in
HF and LF frequency bands. However, they slightly
affected on the values of power spectral density in
the VLF frequency band.
Our recent abstracts (Kontorovich et al., 2017a,
2017b) firstly presented the results of estimating the
artificial ventilation frequency with an accuracy less
than 1 breath cycle per minute. It is shown that video
monitoring of patient chest wall and abdomen
movements allows to determine spontaneous
breathing during artificial ventilation, as well as
evaluating of muscle tone recovery and adequacy of
spontaneous breathing.
The Figure 5 presents the signals of chest wall
and abdomen movements at the moment of
spontaneous breathing restoration. To determine the
best area for breathing recovery evaluation the left
and right lung regions, left and right lumbar regions
and navel region were selected. Presented
movements were measured in a line from the head
(positive direction) to the navel (negative direction).
It can be noted that in the first period of
breathing recovery the thoracic respiratory
movements are much weaker than diaphragmatic
movements, especially in comparison with the navel
region. The navel region is optimal for determining
first breathing recovery attempts, even in
comparison with other abdominal regions. In our
study this is true for all subjects, regardless of
height, weight and lung diseases.
It can be seen from the presented graphs, that
during spontaneous breathing the abdomen regions
are moving down while the chest wall is moving up.
These movements directions correspond to muscle
physiological activity and can be used as an
additional information to separate the spontaneous
breathing from other movements.
The example of patient wakening assessment is
shown in Figure 6. The figure contains the time
interval with expert and predicted values of patient
state. The black line shows the values obtained by
the expert. The red line shows the automatically
predicted values by our pre-trained model which use
the face changes and patient movements as a
features.
The markup consists of three possible states: the
upper state - in which the patient is awake, the
medium state - at which the patient lies quietly with
closed eyes and it looks like patient is sleeping, the
lower state - when the patient's face is hidden or the
system cannot find it.
The vertical bold black line on the Figure 6
shows the extubation moment, when in general the
patient feels discomfort caused by tracheostomy
tube. That discomfort does not allow him to sleep,
and it can be clearly seen on the graphs. The process
starts from about 2400 seconds, when the patient
wakes up several times and falls asleep. Closer to
2700 seconds the patient attracts the attention of
medical nurse, who determined the adequacy of
spontaneous breathing recovery, and produced the
extubation.
The resulting implementation is based on use of
following features: distances between the eyelids
and lips, the position of the head, head movements
and some other characteristics and their derivatives
with using 1-second-long buffers of features.
To ensure high-speed performance and high
accuracy, we used an algorithm based on decision
trees with a preliminary feature selection and
dimension reduction. In this case, the prediction time
of patient awakening state takes less than 1 ms.
A more detailed description of the results,
algorithms and modules implementation of the
proposed system will be presented in our further
works.
Figure 5: The beginning moment of patient spontaneous
breathing recovery during the HFJV.
Video-based Patient Monitoring System - Application of the System in Intensive Care Unit
137
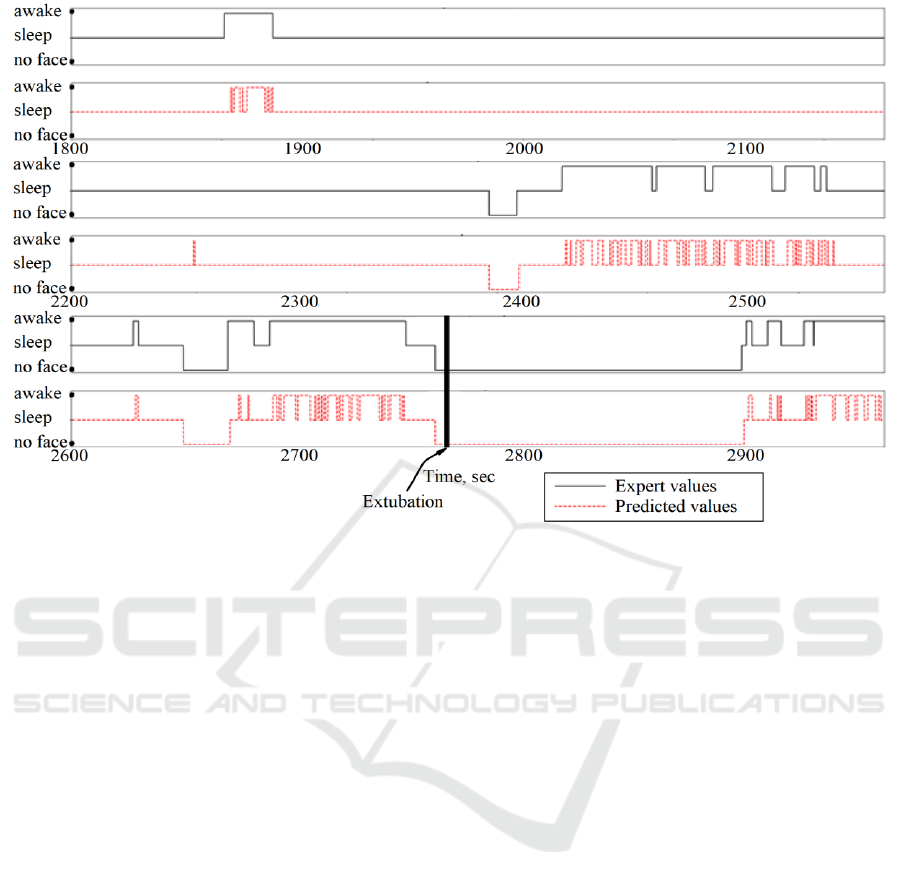
Figure 6: The examples of prediction patient activity by using the expert (black line) and automatic (red line) systems.
4 DISCUSSION AND
CONCLUSIONS
The proposed system is inexpensive, compact,
multifunctional, energy efficient and mobile. It
allows to determine the common physiological
parameters of the patient, and extend it by using
modern video-processing technics. The psycho-
emotional state and physical activity of the patient
can be evaluated by the system. Due to this, it is
possible to introduce it in intensive care unit
equipment not only in large medical centers, but also
in regional offices.
The article firstly showed the possibility of
determining asystole and arrhythmia diseases by
using rPPG technology. It is shown that the most
significant area for determining the spontaneous
breathing recovery moment is the area near to the
navel. The first prediction results of the patients
awakening from the state of anesthesia are shown.
The most promising direction for the system is
integration it into existing medical equipment, such
as a bedside monitor or artificial ventilator.
Data storage integration will allow to perform
further expert analysis and integrate it in the digital
healthcare and telemedicine systems, regardless of
the patient's location.
ACKNOWLEDGMENT
The authors give thanks to the staff from the
department of Anesthesiology and Resuscitation of
the Regional Anti-Tuberculous Dispensary for their
assistance in the research process.
The work was partially supported by Act 211
Government of the Russian Federation, contract
02.A 03.21.0006.
REFERENCES
Aliverti, A., Dellacá, R., Pelosi, P., Chiumello, D., Pedotti,
A., Gattinoni, L., 2000. Optoelectronic
plethysmography in intensive care patients. Am. J.
Respir. Crit. Care Med. 161, 1546–1552.
doi:10.1164/ajrccm.161.5.9903024.
Blazek, V., Rutten, W., Such, O., 1996. A method for
space-resolved, noncontacting and functional
visualization of dermal perfusion.
Brochard, L., Martin, G.S., Blanch, L., Pelosi, P., Belda,
F.J., Jubran, A., Gattinoni, L., Mancebo, J., Ranieri,
V.M., Richard, J.-C.M., Gommers, D., Vieillard-
Baron, A., Pesenti, A., Jaber, S., Stenqvist, O.,
Vincent, J.-L., 2012. Clinical review: Respiratory
monitoring in the ICU - a consensus of 16. Crit. Care
16, 219. doi:10.1186/cc11146.
BIOIMAGING 2018 - 5th International Conference on Bioimaging
138

de Haan, G., Jeanne, V., 2013a. Robust pulse rate from
chrominance-based rPPG. IEEE Trans. Biomed. Eng.
60, 2878–2886. doi:10.1109/TBME.2013.2266196.
de Haan, G., Jeanne, V., 2013b. Robust pulse rate from
chrominance-based rPPG. IEEE Trans. Biomed. Eng.
60, 2878–2886. doi:10.1109/TBME.2013.2266196.
Hess, D.R., Hess, A.D. of R.C.M.G.H.A.P. of
A.H.M.S.E.-I.-C.R.C.D.R., MacIntyre, N.R., Galvin,
W.F., Adams, A.B., CHE, G.D.P., MBA, 2015.
Respiratory Care: Principles and Practice. Jones &
Bartlett Publishers.
Kamshilin, A.A., Nippolainen, E., Sidorov, I.S., Vasilev,
P.V., Erofeev, N.P., Podolian, N.P., Romashko, R.V.,
2015. A new look at the essence of the imaging
photoplethysmography. Sci. Rep. 5, 10494.
doi:10.1038/srep10494.
King, D.E., 2015. Max-Margin Object Detection.
ArXiv150200046 Cs.
Kontorovich, M.B., Purtov, K.S., Kublanov, V.S., 2017a.
Possibilities of using automated video monitoring for
high frequency jet ventilation.
Kontorovich, M.B., Purtov, K.S., Kublanov, V.S., 2017b.
Possibilities of automated video monitoring of
mechanical lung ventilation - A case study.
Kublanov, V.S., Purtov, K.S., 2015. Researching the
possibilities of remote photoplethysmography
application to analysis of time-frequency changes of
human heart rate variability, in: 2015 International
Conference on Biomedical Engineering and
Computational Technologies (SIBIRCON). Presented
at the 2015 International Conference on Biomedical
Engineering and Computational Technologies
(SIBIRCON), pp. 87–92. doi:10.1109/SIBIRCON.
2015.7361857.
Kublanov, V.S., Purtov, K.S., Belkov, D.D., 2017. Remote
Photoplethysmography for the Neuro-
electrostimulation Procedures Monitoring: The
Possibilities of Remote Photoplethysmography
Application for the Analysis of High Frequency
Parameters of Heart Rate Variability 307–314.
Lewandowska, M., Rumiński, J., Kocejko, T., Nowak, J.,
2011. Measuring pulse rate with a webcam #x2014; A
non-contact method for evaluating cardiac activity, in:
2011 Federated Conference on Computer Science and
Information Systems (FedCSIS). Presented at the 2011
Federated Conference on Computer Science and
Information Systems (FedCSIS), pp. 405–410.
Moco, A.V., Stuijk, S., de Haan, G., 2016.
Ballistocardiographic Artifacts in PPG Imaging. IEEE
Trans. Biomed. Eng. 63, 1804–1811.
doi:10.1109/TBME.2015.2502398.
Poh, M.-Z., McDuff, D.J., Picard, R.W., 2010. Non-
contact, automated cardiac pulse measurements using
video imaging and blind source separation. Opt.
Express 18, 10762–10774.
Rubins, U., Miscuks, A., Lange, M., 2017. Simple and
convenient remote photoplethysmography system for
monitoring regional anesthesia effectiveness, in:
EMBEC & NBC 2017, IFMBE Proceedings. Springer,
Singapore, pp. 378–381. doi:10.1007/978-981-10-
5122-7_95.
Sun, Y., Hu, S., Azorin-Peris, V., Kalawsky, R.,
Greenwald, S., 2013. Noncontact imaging
photoplethysmography to effectively access pulse rate
variability. J. Biomed. Opt. 18, 061205.
doi:10.1117/1.JBO.18.6.061205.
Sun, Y., Sebe, N., Lew, M.S., Gevers, T., 2004. Authentic
Emotion Detection in Real-Time Video, in: Computer
Vision in Human-Computer Interaction, Lecture Notes
in Computer Science. Presented at the International
Workshop on Computer Vision in Human-Computer
Interaction, Springer, Berlin, Heidelberg, pp. 94–104.
doi:10.1007/978-3-540-24837-8_10.
Verkruysse, W., Svaasand, L.O., Nelson, J.S., 2008.
Remote plethysmographic imaging using ambient
light. Opt. Express 16, 21434–21445.
Wang, W., Brinker, A.C. den, Stuijk, S., Haan, G. de,
2017. Algorithmic Principles of Remote PPG. IEEE
Trans. Biomed. Eng. 64, 1479–1491.
doi:10.1109/TBME.2016.2609282.
Video-based Patient Monitoring System - Application of the System in Intensive Care Unit
139
