
C4.5 Algorithm Modeling for Decision Tree Classification Process
against Status UKM
Zulham Sitorus
1*
, Kana Saputra S.
2
, and Indri Sulistianingsih
3
1
Faculty of Technology and Vocational Education, Padang State University -Indonesia
2
Faculty of Science and Technology, University of Pembangunan Panca Budi Medan-Indonesia
3
Faculty of Science and Tecnology, University of Pembangunan Panca Budi Medan-Indonesia
Keywords: Classification, Data Mining, UKM
Abstract: Decision Tree is a tree structure, in which each tree node presents the attribute that has been tested. C4.5
Algorithm is an algorithm used to form decision tree. This study was conducted to study the classification of
decision with C4.5 Algorithm which is implemented in analysing the survival of the UKM that recorded in
public Official UKM. Data collected through library and field research. Then the historical data will be
implemented into the data mining classification technique. The result of data mining test using decision tree
classification with C4.5 Algorithm able to describe from root node to tree structure that determine the survive
or not survive of the UKM.
1 INTRODUCTION
This classification technique can be used to
analyse an invisible case, such as knowing or
predicting what is needed or most desired by the
user, computerized operation using data mining
is very important to obtain the information
needed to produce highly efficient and optimal
results, especially in the decision-making about
whether or not the survival of the UKM data in
Bagan Deli-Belawan.
Computing technology and storage media
have enabled humans to collect and store data
from various sources with a very wide range.
This phenomenon occurs in many areas of life,
such as business, banking, marketing,
production and science. Although modern
database technology has resulted in economical
storage media for large data sets, technology to
help analyse, understand, or even visualize data
has unavailable. This is the background of the
development of Data Mining concept. Data
mining is the process of extracting information
or patterns that are important or interesting from
large data sets.
Therefore, we need a way to make the data
available and rich in information can be 'mineed'
to look for 'gold' and 'diamond', which is useful
information for those in need. Explain or
distinguish concepts or data classes in order to
estimate the class of an object whose label is
unknown. The model itself can be an "if-then"
rule, a decision tree, a mathematical formula or
a neural network. The well-known and widely
used classification method is the decision tree.
Another method is C4.5 Algorithm. Thus in the
process of using data mining on the classification
of the UKM status must be more detailed, for the
sake of accuracy problems that occurred in the
assessment.
2 THEORY
2.1 Data Mining
Data Mining is a series of processes to explore
the added value of a data set of knowledge that
has not been known manually. Keep in mind that
the word mining itself means the effort to get a
few valuables from a large number of basic
536
Sitorus, Z., S., K. and Sulistianingsih, I.
C4.5 Algorithm Modeling for Decision Tree Classification Process against Status UKM.
DOI: 10.5220/0010046105360540
In Proceedings of the 3rd International Conference of Computer, Environment, Agriculture, Social Science, Health Science, Engineering and Technology (ICEST 2018), pages 536-540
ISBN: 978-989-758-496-1
Copyright
c
2021 by SCITEPRESS – Science and Technology Publications, Lda. All rights reserved
materials. Therefore Data Mining actually has
long roots from fields such as artificial
intelligent, machine learning, statistics and
databases. Data mining is the process of
applying this method to data with a view to
uncovering hidden patterns. With other
meanings Data mining is the process for
extracting patterns from the data. Data mining
becomes an increasingly important tool for
converting data into information. It is often used
in various profile practices, such as marketing,
surveillance, fraud detection and scientific
discovery. It has been used for years by
businesses, scientists and governments to filter
the volume of data such as flight passenger travel
records, census data and supermarket data
scanners to generate market research reports.
The main reason for using data mining is to assist
in the analysis of behavioural observation
collections. The data is susceptible to
collinearity due to known association.
2.2 Classification and Regression
Methodology
Non-linear these two methodologies consist of a set
of techniques for predicting combinations of input
variables that fit with linear and non-linear
combinations of basic functions (sigmoid, splines,
polynomials). Examples include feed forward neural
networks, adaptive spline methodologies, and pursuit
regression projection. shows the boundary type of
non-linear decisions that may be generated by neural
networks. The non-linear regression
methodology, although sophisticated in its
representation, may be difficult to interpret. If
model space is widened to facilitate more
general expressions (e.g. multivariate hyper
planes at various angles), then this model
becomes
more sophisticated for prediction.
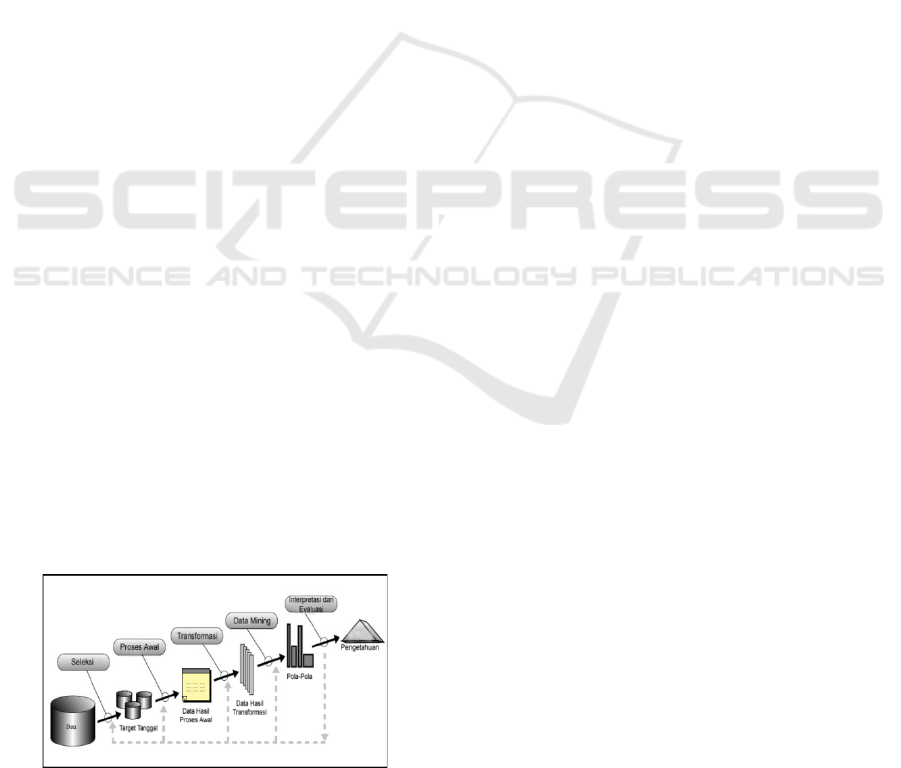
Figure 1. Process Stages of KDD (knowledge discovery in
databases)
Only, it may be more difficult for the user to
understand.
2.3 Decision Tree
The concept of Decision tree is one of the first
techniques of decision analysis. Trie were first
introduced in the 1960s by Fredkin. Trie or
digital tree derived from the word retrieval in
accordance with its function. Etymologically
this word is pronounced as 'tree'. Although
similar to the use of the word 'try' but it aims to
distinguish it from the general tree. In computer
science, the Trie, or prefix tree is a data structure
with an ordered tree representation used to store
an associative array of strings. Unlike a binary
search tree (BST) that does not have a node in
the tree that holds elements associated with the
previous node and, the position of each element
in the tree is crucial. All descendants of a node
have a prefix string containing elements from
that node, with root being an empty string.
Values are usually not contained in every node,
only in leaves and some nodes in the middle that
match certain elements. The Decision Tree uses
the ID3 or C4.5 Algorithm, which was first
introduced and developed by Quinlan which
stands for Iterative Dichotomiser 3 or Induction
of Decision "3" (read: Tree). The ID3 algorithm
forms a decision tree with the divide-and-
conquer data method recursively from top to
bottom. Decision Tree's establishment strategy
with ID3 algorithm is: Tree starts as a single
node (root) that represents all data. After the root
node is formed, the data on the root node will be
measured with the gain information to select
which attribute will be the attribute of the
divisor. A branch is formed from the selected
attribute into a divisor and the data will be
distributed into each branch. (Jianwei Han,
2001).
2.4 Decision Tree Model
One of common data mining used for a decision
tree is a flowchart structure that has a tree, where
each internal node signifies a test on an attribute,
each branch representing a class or class
distribution. The plot in the decision tree is
traced from the root node of the leaf node that
C4.5 Algorithm Modeling for Decision Tree Classification Process against Status UKM
537
holds the class predictions for the example.
Decision tree is easy to convert to classification
rules (classification riles).
Decision tree is a prediction model using
drawing tree structure or hierarchical structure.
An example of a decision tree can be seen from
the following figure:
Figure 2. Decision Tree
2.5 C4.5 Algorithm
C4.5 Algorithm is an algorithm used to form
decision tree. One of the induction algorithms of
the decision tree is ID3 (Iterative Dichotomiser
3). ID3 was developed by J. Ross Quinlan. In the
ID3 algorithm procedure, the inputs are training
samples, training labels and attributes. The
Decision Tree C4.5 algorithm is a development
of ID3. While on WEKA open source software
has its own version of C4.5 known as J48.
To select an attribute as a root, based on the
highest gain value of the attributes. To calculate
the gain used the formula as shown in Formula 1
(Craw, S., ---). With:
S : The set of cases
A : Attribute
N : Number of partition attributes A
|Si| : Number of cases on i partition
|S| : Number of cases in
3 ANALYSIS AND DISCUSSION
The policy or decisions made by the researcher
to determine the surviving SMEs is by collecting
data and some attributes to determine the
surviving SMEs, to overcome the problems in
determining SME survive in village of Bagan
Deli-Belawan, an analytical tool is needed for
the researchers to determine the SMEs who
survive. This analysis can be done by using case-
based reasoning theory, i.e. comparing UKM
that survive with cases that have occurred in
previous years. The analytical tool is a
supporting application of computer-based
decision support application that implements the
decision tree classification algorithm (data
mining). With the availability of abundant UKM
data, data mining can extract buried information
from the UKM data set. This application can be
used to determine which UKM that survive
based on previously collected data
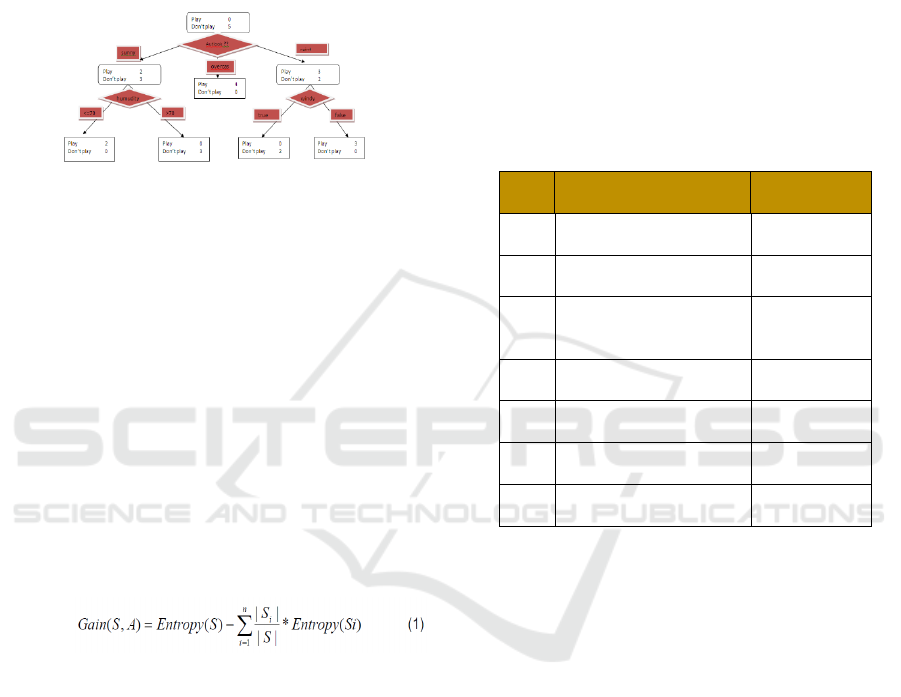
Table 1. UKM Data
NO Nama UKM SURVIVE
1 Berkah Bahari YES
2 Laut Deli NO
3
KaryaNelayan
Sejahtera NO
4 Muara Deli YES
5 Bumi Sejati NO
6 Putri Bahari YA
7 Laut Jaya Belawan YA
3.1 Change the Tree to Rule
By observing the decision tree in Figure 3. it is
known that the decision tree has been formed.
And after the tree finally obtained and then
changed to rule. Here is a tree that is changed to
rule:
R1: if income = low THEN Survive = no
R2: if income = medium ^ management = bad ^
THEN Survive = No
R3: if income = medium ^ management = being
^ THEN Survive = no
R4: if income = medium ^ management = good
^ THEN Survive = yes
R5: if income = high ^ debt = high ^ THEN
Survive = no
ICEST 2018 - 3rd International Conference of Computer, Environment, Agriculture, Social Science, Health Science, Engineering and
Technology
538

R6: if income = high ^ debt = low ^ THEN
Survive = yes
The following is a common form of description
of the rule that has been simplified is as follows:
R1 = If income = medium and management =
bad then survive not
R2 = If income = medium and management =
medium then survive not
R3 = if income = medium and management =
good then survive yes
R4 = if income is low then survive not
R5 = if income = high and debt = high then
survive not
R6 = if income = high and debt = low then
survive.
As for calculating the value of gain information
from the attributes of debt are as follows:
Gain (Debt) = Value Information All Data
Training - Entropy Attribute
Figure 3. Decision Tree Result
4 CONCLUSIONS
After the researcher discussed the existing problems
by paying attention to the theoretical and practical
aspects and processing the collected data then analyse
the influence of decision tree classification
implementation on the UKM data the researcher
concluded as follows:
1. From a pile of the UKM data that survive in
2016, there is a useful knowledge for the agency
itself and to the head of department to analyze the
survival of the UKM.
2. From the results obtained from the analysis of
data mining, especially the decision tree
classification with C4.5 Algorithm agencies can
know clearly the survival of the UKM company.\
3. From the results of data mining is a survival
UKM data that has information from each
company, this is very important for the continuity
of SME loans.
4. While the non-surviving UKM group needs to be
reviewed, it will be very influential in the UKM
loan.
5. The result of the classification decision tree is
done to meet the rules - rules that can be used as
the basis of the decision to survive or not a
company from the data of the UKM.
6. WEKA Data Miner application classification
decision tree used as application of data mining,
will simplify the process of analysis and
minimize human error in the calculation of
determination of UKM that survive.
As for the advice given is expected to have a system
limitations in the delivery of questions and answers
contained images therein. It would be better for future
questions and picture answers can be displayed.
1. Data mining using the decision tree classification
should be used to determine which SMEs survive
for further development, prevent repeatedly
search the value of each attribute so that it takes
a long time.
2. Create their own data mining application
program with decision tree classification to make
it easier and faster to enumerate every attribute
and program devoted only to one method to get
the desired result.
REFERENCES
Kusrini, Emha Taufiq Luthfi, 2007, “Algoritma Data
Mining”, Penerbit Andi.
Sani Susanto, Ph.D., Dedy Suryadi, S.T., M.S.,
2010,“Pengantar Data Mining Menggali Pengetahuan
Dari Bongkahan Data”, Penerbit Andi Yogyakarta.
Prabowo pudjowidodo rahmadya triashandayanto,
herlawati, 2010,” penerapan data mining dengan
matlab” data mining”, penerbit andi.peerbit rekayasa
sains Fajar astuti hermawati, 2010, “
Achmad Basuki, Iwan Syarif (2003), “decision
tree”.http://lecturer.eepisedu/~basuki/lecture/Decision
Tree.pdf.
Http://staff.blog.ui.ac.id/jefri.p/2012/09/studi-ecil-
klasifikasi-bayesian-network-decision-ree-dan-svm-
untuk-machine-learning-pada-weka/i akses pada
september 14/2012
C4.5 Algorithm Modeling for Decision Tree Classification Process against Status UKM
539

Tfa,subianto, “data mining decision tree”.
Http://www.informatika.unsyiah.ac.id/tfa/dm/dmprakti
kum-decision-tree.pdf
Ginting, S.L., Zarman, Wendi,dan Hamidah, Ida, 2014,
Analisis Dan Penerapan Algoritma C4.5 Dalam Data
Mining Untuk Memprediksi Masa Studi Mahasiswa
Berdasarkan Data Nilai Akademik, Prosiding Seminar
Nasional Aplikasi Sains & Teknologi (SNAST) 2014,
Yogyakarta, 15 November 2014, ISSN: 1979-911X,
Hal. A263-A272.
ICEST 2018 - 3rd International Conference of Computer, Environment, Agriculture, Social Science, Health Science, Engineering and
Technology
540
