
Performance Analysis of Entropy Method in Determining Influence
of Self Organizing Map in Classification Process
Victor Tarigan
*
, Poltak Sihombing and Pahala Sirait
Departement of Computer Science and Information Technology, University of Sumatera Utara,
Jl. Dr. T. Mansur No.9, Medan, Indonesia
Keywords: Self Organizing Map, Entropy, Initial Weight, Initialization, Random.
Abstract: Self Organizing Map (SOM) is the method to grouping topography shape of two dimension as a map that to
get easy monitoring the result of grouping distribution. The process of SOM consist of 4 component, there
are : inisialitation, competition, team work, and adaptation. From the fourth component, at the first initialitaion
process, in initialitaion value quality beginning vector is according to randomly. The concequency from
disseminating randomly is to sensitive forward accuration level because of unexacly in choosing quality
beginning with the result that get bad enough of accuration to get better of accuration, we can choose one of
method are entropy method. Entropy method is using for qualities or to get level of criteria importance based
on atribut of dataset. At this research, entropy method is using to get beginning of qualities to algorithm SOM
and to computing the accuration level with qualities of randomly scale. After the test with 3 dataset with total
of class and the difference attribute then mean level of accuration to SOM method with entrophy is 67.8401%
and with randomly is 51.1878%. The result is proving that the beginning quality with entropy is better with
quality method beginning as randomly.
1 INTRODUCTION
Self Organizing Map (SOM) is a grouping method in
the form of two-dimensional topography like a map
making it easier observation of distribution of
groupings results . This method is excellent in
computing the exploration of data mining processes
(Teuvo Kohonen, 2013).
SOM process itself consists of 4 components, the
first is the initialization which means that All weights
are initialized with random values . Next is the
Competition which means is for each pattern, neurons
calculate the value of each function where the
smallest value of the result of the function will be
used as the best value. The third is cooperation ,
whereby the best neurons determine the point of
location so as to provide the basis for cooperation
between neurons. And the last is the adaptation where
the existing neurons decrease the value of each
discriminant function through adjustment according
to the input pattern (Mohd Nasir Mat Amin et al,
2014).
Of the four components already described, in the
first process called the initialization process, in
initializing the initial vector weights are still done by
random or random values. The consequences of
random deployment are very sensitive to the accuracy
level due to inaccuracy in the selection of initial
weights resulting in poor accuracy.
To anticipate such a poor accuracy, a process is
needed to establish the initial weighting vector in the
initialization process in SOM. One alternative that
can be used to determine the initial vector weight is
by using the entropy method.
Based on the study (Jamila,2012) Entropy is used
for weighting or determining the level of importance
of criteria. Entropy method is used for data with high
value variations, in other words there is irregularity in
the data. there is the Entropy method, a criterion that
has a high value variation and low average value, then
the value of the weight is higher. In contrast, for
criteria with low variation values (short range range)
and high grade value, the entropy value is low.
In a subsequent study conducted by (Anggi
Syahadat, 2017) in which the weight searching of the
Learning Vector Quantization ( LVQ ) method
employed the entropy method in which the results
showed that the LVQ model with entropy yielded a
better accuracy rate than the standard weighted LVQ
originally derived from one of the existing datasets.
Tarigan, V., Sihombing, P. and Sirait, P.
Performance Analysis of Entropy Method in Determining Influence of Self Organizing Map in Classification Process.
DOI: 10.5220/0010045404930500
In Proceedings of the 3rd International Conference of Computer, Environment, Agriculture, Social Science, Health Science, Engineering and Technology (ICEST 2018), pages 493-500
ISBN: 978-989-758-496-1
Copyright
c
2021 by SCITEPRESS – Science and Technology Publications, Lda. All rights reserved
493

LVQ method itself is not much different from the
SOM method is a neural network based learning
model that requires early weighting vector in the
learning process..
2 SELF ORGANIZING MAPS
(SOM)
Self Organizing Map (SOM) is a grouping method in
the form of two-dimensional topography like a map
so as to facilitate the observation of the distribution of
grouping results. SOM requires the determination of
the learning rate, the function of the learning, the
number of iterations desired in the grouping process
to provide grouping results (Li Jian & Yang
Ruicheng, 2016).
Self Organizing Map method does not require
objective function such as KMeans and Fuzzy C-
Means so that for optimal condition on an iteration,
SOM will not stop its iteration as long as the specified
number of iterations has not been reached (Larose,
Daniel T, 2005).
Kohonen Network is one of the network used to
divide pattern input into several clusters (clusters),
where all the patterns are located in one group is a
pattern similar to each other (Teuvo Kohonen, 2013).
In the SOM algorithm, the weight vector for each
cluster unit serves as an example of the pattern input
associated with the cluster . During the self-
organizing process , cluster the unit of weight
corresponding to the pattern of the closest input
vector (usually, the square of the minimum Euclidean
distance) is selected as the winner. The winning unit
and its neighboring unit (in terms of the topology of
the cluster unit ) continue to update the brand weight
(Fausett, 1993). While in weighting methods,
Entropy can be applied to weighting attributes, this is
done by (Hwang and Yoon, 1981).
In SOM networks, target neurons are not placed
in a line like any other ANN model. Target neurons
are placed in two dimensions whose form / topology
can be adjusted. Different topologies will produce
neurons around neurons a different winner so that the
weighed weights will also be different. In SOM, the
weight change is not only done on the weight of the
line connected to the winning neuron only, but also
on the line weight to the neurons around it. neurons
around the winning neuron are determined by their
distance from the winning neuron
Here are the steps that need to be done in
applying SOM method in data processing (Teuvo
Kohonen, 2013) :
1. Initialize Weight of Wij weights at random,
determine the adjacent topology parameters,
determine the learning rate parameter, determine
the number of training iterations
2. As long as the maximum number of iterations has
not been reached, perform steps 3 -7.
3. For each input data X (matrix M x N), do step 4
– 6
4. For each j neuron, calculate
𝐷
∑
𝑊
𝑋
, i = 1,. . ., N, N (1)
5. Search Index of a number of neurons, 𝐷
, which
has the smallest value
6. For
neurons j and all neurons that become J
within the radius R, calculate the weight change
wij (old) + ή (𝑋
𝑊
old
(2)
7. Update the rate of learning
3 ENTROPY
Entropy is one of thermodynamic quantities that
measure energy in a system per unit of temperature
that can not be used for business. The general
explanation of entropy is (according to the laws of
thermodynamics), the entropy of a closed system
always rises and under conditions of heat transfer,
heat energy moves from higher temperature
components to lower temperature components. On a
system that is heat insulated (Sun Yan, 2013).
Entropy only goes one way (not reversible / back
and forth). At present entropy is not limited to its use
only in the science of thermodynamics alone, but it
can also be applied in other fields. (Jun Yan et
al.,2008). In statistical thermodynamics, for example,
entropy is declared as the degree of irregularity. The
more irregular the greater the entropy . The more
organized the entropy becomes smaller. In the
system, the degree of irregularity is usually associated
with its temperature. The higher the temperature, the
more random the motion of the molecule. The cold,
the randomness of molecules / atoms decreases
(Xiangxin LI et al, 2011).
The entropy method can be used to determine a
weight. The entropy method can produce criteria with
the highest value variation will get the highest weight
(Rugui Yao et al, 2016). The steps used in the entropy
method are as follows (Xiangxin LI et al, 2011) :
a. Create a performance rating matrix
The performance rating matrix is an alternative
value for each criterion in which each criterion is
independent of each other.
ICEST 2018 - 3rd International Conference of Computer, Environment, Agriculture, Social Science, Health Science, Engineering and
Technology
494

b. Normalize table of criteria data
Normalization is done by first determining the
highest (maximum) value of each alternative on
each criterion.
c. Entropy Calculation
Calculation of entropy for each jth criterion by
first calculating the emax and K values. To find
the emax and K values given in equation 3
K
(3)
The entropy calculation for each of the jth criteria is
shown in equation 4 ..
dj
K
∑
(4)
where :
e(dj) = entropy value on each criterion
di = the value of data that has been normalized.
Dj = number of data values that have been normalized
on each criteria.
after getting e (dj) in equation 4, then calculate the
total entropy (E) for each of the criteria as shown in
equation 5 .
E
∑
e
dj
(5)
d. Entropy weight calculation
After the total entropy has been generated by
referring to equation 5, then calculate the weights
on each criterion by using equations 6 and 7.
λ
1e
dj
(6)
∑
λ
Sign1 (7)
The Entropy method is powerful enough to
compute a criterion weight. The reason is because this
method can be used for various types of data, both
quantitative and qualitative. In addition, this Entropy
Method also does not require that the units and range
of each criterion should be the same . This is possible
because before being processed, all data will be
normalized first so it will be worth between 0-1 (Yuan
Zeng et al, 201 7). Basically, the data that has a large
range of values and has a high value variation for the
each alternative, will gain a high weight. That is, the
criterion is considered capable to distinguish the
performance of each alternative. (Wei Liu, 2008).
In addition, this method does not require that the
units and range of each criterion should be the
same.
This is possible because before being processed, all
data
will be normalized first so it will be worth
between 0-1. Basically, data that has a large range of
values (relative to the criteria itself) and has a high
value variation to differentiate the performance of
each alternative (Mirjana Pejić Bach. et all, 2013).
In addition, using the Entropy Method, the
research can give the initial weight on the criteria. So
even if for example from the calculation, Entropy
Method gives the smallest weight on a criterion, but
if the criterion is considered important by Decision
Maker, then it can give high weight on the criteria .
Both types of these weights will then be calculated
together so as to get the final entropy weight (Wei
Liu, 2008).
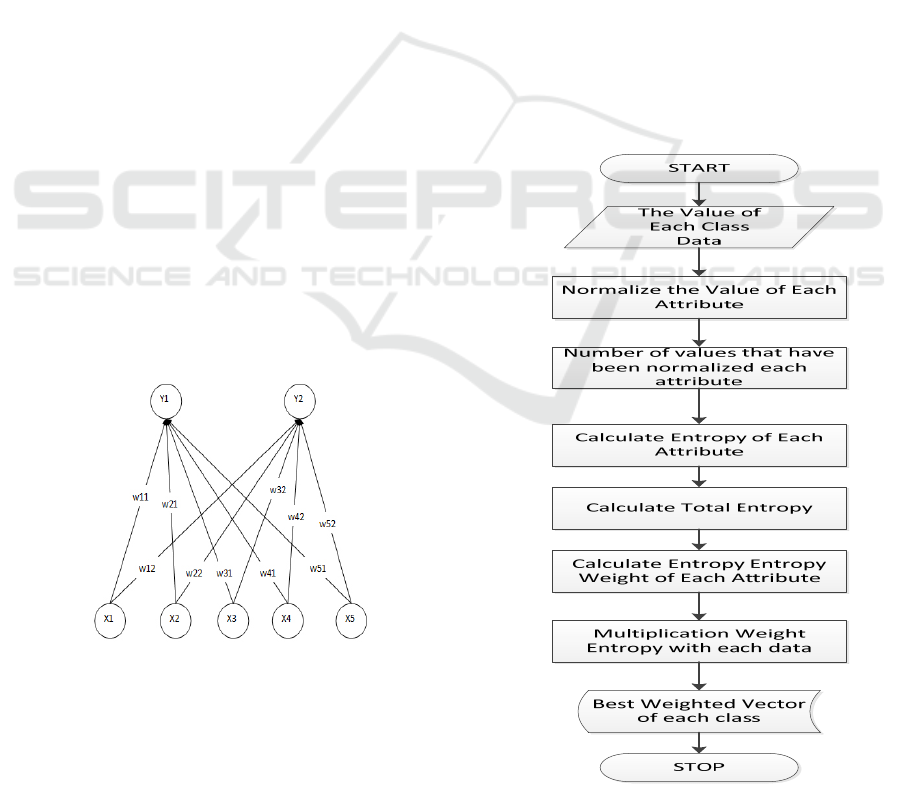
4 RESEARCH METODOLOGY
The methodology of this research is shown in Figure
1
Figure 1: Research Methodology
Figure 1 is an image of the flow of research
methodology in this study. The first step in Figure 1
is to prepare the dataset used. After the dataset is
prepared then illustrates the architecture of the SOM
method in which the SOM architecture described has
two layers: the input layer and the output layer. The
next step is to do the process of weighting with
Entropy and random..
After the weighting results will be done with the
SOM training process and continued SOM testing
process based on the weight of SOM training based
on the number of iterations and learning rate
provided. After the testing process can then be seen
and analyzed the accuracy of both the SOM and
random methods of which the better accuracy in
classifying the data testing provided.
Performance Analysis of Entropy Method in Determining Influence of Self Organizing Map in Classification Process
495
4.1 Used Dataset
Dataset used in this research there are 3 that is:
Occupancy Detection Data Set, Iris Dataset, and
User Knowledge Modeling Datase. Occupancy
Detection Data Set is a dataset containing
experiments used for the classification of occupancy
.This classification is obtained from the time of
shooting in every minute. Data. The attributes used
in this dataset are temperature, relative humidity,
light, CO
2
, Humidity Ratio. This dataset has 2 classes
ie not occupied and occupied.
The dataset Iris contains a collection of data sets
containing 3 classes of 50 iris datasets in which each
class refers to the type of iris plant. One class can be
separated linearly from the other 2 and the last one is
not separated linearly from each other. The predicted
attribute is the iris plant class . These attributes
include sepal length, sepal width, petal length, and
petal width and have class ie, sliced sentosa, iris
versicolor, and virginica slice.
User Knowledge Modeling is dataset to know
the learner's knowledge about the subject of Electrical
DC Machines. This dataset has 5 attributes, namely
STG (The degree of study time for goal object
materials), SCG (The degree of study time of the
object for related objects with goal objects ), and the
PPR (The exam performance of the user for goal
objects) and have 4 classes, namely Very Low, Low,
Middle, and High .
4.2 SOM Architecture
Designing Network Architecture SOM terms on
Artificial can be seen in figure 2
Figure 2: SOM Architecture
Figure 2 is an example of an SOM architecture for an
Occupancy Dataset where the Occupancy Status Data
set has one input layer and one output layer with the
following parameters :
1. Number of Nodes in input layer (Input Layer)
The input layer is a layer that will place input
data which will be processed as learning.
2. Number of Nodes in Output Layer (Output
Layer)
The output layer in SOM is a layer for processing
input data which then finds the distance between the
input data and the initial weight in a competitive
manner which is then used as the output to determine
the class where the input data is located. The number
of nodes in the output layer consists of 2 nodes
because obtained from the target dataset generated
has 2 different classes of Occupied Status and Not
Occupied Status
4.3 Determination of Entropy Start
Weight
In the process of determining the initial weight vector
by Entropy method is done by way of: Multiplication
of Entropy weight with the dataset so that obtained
which data has the highest value in each class it will
be used as initial weight vector. The flow in the initial
weight determination of this way can be shown in
Figure 3
Figure 3 : Determination of Initial Weight
ICEST 2018 - 3rd International Conference of Computer, Environment, Agriculture, Social Science, Health Science, Engineering and
Technology
496

Figure 3 illustrates the flow of the initial vector
weight search process using entropy. The first step
prepares the data for each class. After preparing the
data for each existing class then the data is
normalized. This attribute normalization process
itself, namely by dividing each data at the highest
attribute with a value that is on those attributes..
The next step is to calculate the entropy for each
attribute by first calculating the emax and K values
using equation 3 and equation 4. After getting the
entropy value of each attribute, the next step is to
calculate the total entropy value by using equation 5.
After calculating the total value of entropy then
proceed by finding the weight calculation of each
attribute by using equation 6. Based on the calculation
of the weight of each attribute that has been calculated
by using the equation 6 then multiplied by each
attribute based on the existing classes and then add
the attribute values based on the data instance and
searched for the highest score of each class.
4.4 Determination of Random Start
Weight
Determination of initial weight vector with its own
random use rules where the random value obtained
between the range of the minimum value to the
maximum value of each attribute of each class.
Determination of initial weight vector with its own
random use rules where the random value obtained
between the range of the minimum value to the
maximum value of each attribute of each class (Mia
Louise Westerlund, 2005).
4.5 SOM Training with Entropy
The steps of workmanship with SOM method with
combination of entropy method can be seen in figure
4
Figure 4 : Flowchart Training SOM with Entropy
Figure 4 summarizes the entropy training steps
with som wherein the initial vector of the SOM
training uses entropy weighting. Before doing SOM
training process how many number of iterations will
be processed in training SOM. In addition to the
number of iterations given as input, a jug of learning
rate of 0.5 is obtained with a random learning rate
limit -1 < 𝛼 < 1
4.6 SOM Training with Random
Steps of workmanship with SOM method with
combination of entropy method can be seen in figure
5
Performance Analysis of Entropy Method in Determining Influence of Self Organizing Map in Classification Process
497

Figure 5 : Flowchart Training SOM with Random
In figure 5 is a step of entropy training with som
where the initial vector of SOM training uses random.
Before doing SOM training process how many
number of iterations will be processed in training
SOM.
4.7 Testing SOM
After the training of all training data with the
determination of initial entropy weight vector and
random on SOM training, we will get the final
weights vector (w). The weights will then be used to
perform the simulation or data testing process. SOM
flowchart testing in this study can be seen in Figure 6
Figure 6 : Flowchart Testing Data
Flowchart in figure 6 is a flowchart testing where
the flow of the flowchart is the first prepared there is
data testing along with the target to be obtained and
the final weighted vector during the training process..
This final weighting vector itself is divided into
two final weight vectors that are sourced from the
initial vector weighting with entropy and weighting
of the initial vector by random. After the weight
vector and the testing data are prepared, then find the
shortest distance using Euclidean distance. Based on
the shortest distance search by using Euclidean
distance. it will be determined whether it is on target
or not and will be accumulated how many data are in
accordance with the target and how much data is not
in accordance with the target..
This final weighting vector itself is divided into
two final weight vectors that are sourced from the
initial vector weighting with entropy and weighting
of the initial vector by random. After the weight
vector and the testing data are prepared, then find the
shortest distance by using Euclidean distance. Based
on the shortest distance search by using Euclidean
ICEST 2018 - 3rd International Conference of Computer, Environment, Agriculture, Social Science, Health Science, Engineering and
Technology
498

distance. it will be determined whether it is on target
or not and will be accumulated how many data are in
accordance with the target and how much data is not
in accordance with the target.
5 RESULT DAN DISCUSSION
After the training process and the final weights
obtained either with the initial weight of random or
with entropy it will be tested which is the better level
of accuracy whether with entropy or without entropy
. This testing process itself will involve 3 datasets
according to existing data sources.
To calculate the accuracy of SOM classification
results using the following equation :
accuracy
∗ 100%(9)
Based on equation 9 we get the accuracy of the
test result shown in table 1 for initial weight with
random and table 2 for initial weight with entropy
Table 1: Hasil Pengujian dengan Pembobotan Awal
Entropy
Dataset Percobaan Jumlah
Data
True False Akurasi
(%)
Occupancy
Dataset
Testing 1 2665 1745 920 64.47
Testing 2 9752 7916 1836 81.17
Iris Data
Set
Testing 1 30 25 5 83.33
Dataset
User
Knowlede
Modellin
g
Testing 1
145 60 85
41.37
Rata-Rata
67.5875
Table 2: Hasil Pengujian dengan Pembobotan Awal
Random
Dataset Percobaan Jumlah
Data
True False Akurasi
(%)
Occupancy
Dataset
Testing 1 2665 1693 972 64.47
Testing 2 9752 7260 7260 81.173
Iris Data
Set
Testing 1 30 13 17 83.33
Dataset
User
Knowlede
Modellin
g
Testing 1
145 53 92
36.55
Rata-Rata
54.4617
Based on tables 1 and 2, Having tested using 3
different datasets has different accuracy results. For
the first dataset the Occupancy dataset after tested
with the number 2665 records with 8143 training
data and the number of iterations as much as 10 times
obtained results of different accuracy level where the
entropy accuracy of 65.4784% and the accuracy
without entropy of 63.5272%
For the second dataset testing with 9752 records
as data testing with various training data of 8143
records and the number of iterations as much as 10
times obtained results of different accuracy level
where entropy get different accuracy level where the
initial weighting with entropy get the accuracy level
of 81.173 % and random amounted to 74.446 %.
For the iris dataset, the result of the test with the
data of training as much as 120 data and data testing
as much as 30 data, then got different accuracy level
where the initial weighting with entropy get the
accuracy level equal to 83.33% and random equal to
43.33%.
For Dataset User Knowlede Modeling , test result
with 259 data training and data testing as much as 146
data, then got different accuracy level where the
initial weighting with entropy get accuracy level
equal to 41.379 % and random equal to 36.65%
Based on the results of the fourth trial, we
calculated the average accuracy of both trials
sehinggan average value weighted by the initial
entropy accuracy of 67.5875 % and a random by
54.4617% so that it can be viewed accuracy with
entropy method has an accuracy better than random.
From the results of research and trials that have
been done by using 3 data sets taken from UCI
Learning Repostiory generated accuracy level with
entropy method yields a better accuracy level with
random method . It can be said that the result of
accuracy resulted from this research is very thin this
is caused by the existing data where the proximity
between random vector weight and the result of
entropy vector weight is quite close. because in this
research weights of random vectors are taken between
the range of minimum and maximum values of each
variable in the occupancy dataset.
However, the initial vector determination in the
training process for SOM is essential for obtaining the
best weight and initial vector determination with
entropy successfully used and combined with the
SOM method which initially used the random value
to determine the initial weight vector in the training
data process.
6 CONCLUSION
Based on the research that has been done can be
concluded that the initial weighting of SOM by using
random and initial weighting SOM using entropy that
has been done, from the test results to the data, where
Performance Analysis of Entropy Method in Determining Influence of Self Organizing Map in Classification Process
499

each test data as much as 3 data sets obtained different
accuracy results. Initial weighting by using random
obtained accuracy of 54.4617 %. While the initial
weighting using entropy obtained the results of
recognition accuracy of 67.5875%..
The initial weighting result of SOM using the
entropy method obtained a higher accuracy
percentage increase of 13.1258% compared with the
initial weighting method with random . This proves
that the use of entropy in the determination of the
initial weights affects the increase of classification
accuracy by using SOM method due to investigate the
level of harmony in a set of data and able to adapt to
a set of data plural of plurality which have variation
of value which differ between one data with other
data
REFERENCES
Kohonen, Teuvo, 2013. Essentials Of The Self-Organizing
Map. Volume 37, January 2013, Pages 52-65.
Mohd Nasir Mat Amin. et al, 2014. Trend cluster analysis
using self organizing maps. 2014 4th World Congress
on Information and Communication Technologies,
WICT 2014 Institute of Electrical and Electronics
Engineers Inc. 80-84.
Jamila, 2012, Decision Support System Selection of
Subcontracting Gloves Production Using Entropy And
Topsis Methods. National Seminar on Informatics Issn
: 1979-2328.
Harahap, Anggi Syahadat. 2017. Performance Analysis of
Entropy Method In Early Determination of Learning
Vector Quantization in Classification Process. Thesis.
Tesis: Universitas Sumatera Utara.
Li Jian & Yang Ruicheng, 2016. Self-Organizing Map
Method for Fraudulent Financial Data Detection. 3rd
International Conference on Information Science and
Control Engineering.
Larose, Daniel T, 2005. Discovering Knowledge In Data :
An Introduction To Data Mining. John Willey & Sons,
Inc.
Fausett, Laurenne, 1993. Fundamentals Of Neural
Networks,Architectures, Algorithms, And Application.
Yoon & Hwang, 1981, Multiple Attribute Decision
Making: Metods And Applications, Multi-Criteria
Decision Making: An Application Study Of Electre &
Topsis, 4, Hal.93-124.
Sun Yan. et al, 2013, The application of entropy weight
unascertained model in mine safety evaluation.
Cyberspace Technology (CCT 2013), International
Conference. Online ISBN: 978-1-84919-801-1.
Xiangxin LI. Et Al. 2011, Application of the Entropy
Weight and TOPSIS Method in Safety Evaluation of
Coal Mines. Procedia Engineering 26 (2011) 2085 –
2091.
Wei Liu, 2008. Entropy Coefficient Method to Evaluate the
Level of Sustainable Development of China's Sports.
International Journal of Sports Science and Engineering
Vol. 02 (2008) No. 02, pp. 72-78.
Mirjana Pejić Bach. Et Al, 2013. Business Client
Segmentation In Banking Using Self-Organizing Maps.
South East European Journal Of Economics And
Business Volume 8 (2) 2013, 32-41.
Mia Louise Westerlund, 2005. Classification with Kohonen
Self-Organizing Maps. Soft Computing, Haskoli
Islands, April 24, 2005.
ICEST 2018 - 3rd International Conference of Computer, Environment, Agriculture, Social Science, Health Science, Engineering and
Technology
500
