
Reduction Attributes on K-Nearest Neighbor
Algorithm (KNN) using Genetic Algorithm
M. Arinal Ihsan
*
, Muhammad Zarlis, Pahala Sirait
Departement of Computer Science and Information Technology, University of Sumatera Utara, Medan, Indonesia
Keywords: K-Nearest Neighbor, Classification, Genetics, Selection, Rank, KNN.
Abstract: Diabetes mellitus (DM) is a serious health problem both in Indonesia and in the world. Data mining techniques
have been done to help diagnose diabetes. Attribute selection is a process to identify and remove attributes
with irrelevant or excessive values. In this study, attribute selection was performed using genetic algorithm
implemented at K-Nearest Neighbor (KNN) for classification task. The genetic algorithm aims at sorting
attributes by rank where the greater of an attribute the more significant the attribute for the classification task.
The test was performed on Indians dataset of 768 data. From the test, we got the best combination with 1
attribute selection: 3 and 4 attribute reduction from K-Nearest Neighbor (KNN) accuracy before it was
reduced 76,52%, and after reducing 76.96%. While the selection of 2 attributes is : reduce the attributes 1 and
4. The comparison of the results of K-Nearest Neighbor (KNN) accuracy before it is reduced is 76,52%, and
after attribute reduction is 79,57%. These results prove that the comparison of the results obtained attribute
deduction while maintaining the optimization of results before and after eliminate attributes.
1 INTRODUCTION
Diabetes mellitus is a metabolic disease with
characteristics of hyperglycemia that occurs due to
abnormalities of insulin secretion, insulin work or
both. If you have been exposed to chronic diabetes,
then there will be long-term damage, dysfunction or
failure of some organs of the body especially the
kidneys, eyes, nerves, heart, and blood vessels.
Diabetes mellitus (DM) is a serious health problem
both in Indonesia and in the world. According to a
2005 WHO survey, Indonesia as a lower-income
country ranks fourth with the largest number of
people with diabetes mellitus in the world after India,
China and the United States. Based on Indonesia
Health Profile 2008, diabetes mellitus is the cause of
death rank six for all age in Indonesia with the
proportion of death 5,7%, under stroke, TB,
hypertension, injury, and perinatal. Attribute
selection is a process to identify and remove attributes
with irrelevant or excessive values. In this research,
the selection of attributes using genetic algorithm is
implemented in K-Nearest Neighbor (KNN) for
classification task. Genetic algorithm aims to perform
sorting attributes based on rank (rank) where the
greater of an attribute the more significant the
attribute for prediction task.
This selection process is implemented in the K-
Nearest Neighbor (KNN) Method. KNN Is one of the
most commonly used algorithms in the classification
or prediction of new data. The purpose of the KNN
algorithm is to classify new objects based on
attributes and training samples. and KNN algorithm
is a powerful algorithm for training data that has a lot
of noise (Lestari, 2014). And on other studies
(Nirmala Devi, M. Appavu, S., Swathi, U.V., An
amalgam KNN to predict diabetes mellitus :, IEEE,
2013) This study observed that the KNN algorithm
provides significant performance on various datasets.
Which method used for attribute selection in this
research is Genetic Algorithm with selection of
Roulette wheel selection. Roulette wheel selection
Individuals are mapped in a line segment in order so
that each individual segment has the same size as its
fitness size. A random number is generated and the
individual that has a segment within the random
number region will be selected. This process is
repeated until a certain number of individuals are
expected. The authors conducted this observational
study from the international journal "Diagnosis of
Diabetes Mellitus using K Nearest Neighbor
Algorithm" (Krati Saxena1, Zubair Khan2, Shefali
Ihsan, M., Zarlis, M. and Sirait, P.
Reduction Attributes on K-Nearest Neighbor Algorithm (KNN) using Genetic Algorithm.
DOI: 10.5220/0010043203710378
In Proceedings of the 3rd International Conference of Computer, Environment, Agriculture, Social Science, Health Science, Engineering and Technology (ICEST 2018), pages 371-378
ISBN: 978-989-758-496-1
Copyright
c
2021 by SCITEPRESS – Science and Technology Publications, Lda. All r ights reserved
371

Singh3, July 2014). Before doing data processing this
research will perform the process of normalization of
data by using Min-Max method with the aim of
avoiding the occurrence of various anomalies of data
and not consistency of data, the data in this study has
2 data types namely integer and real data so that the
researcher normalize the data. "Min Max
Normalization Based Data Perturbation Method for
Privacy Protection" (Yogendra kumar Jain, santosh
Kumar Bhandre, 2011).
2 GENETIC ALGORITHM (GA)
The genetic algorithm is a computational algorithm
that inspired Darwin's theory of evolution which
states that the survival of a creature is influenced by
the rule that high fitness-worthy individuals will
survive while low-fitness individuals will die
(Goldberg D. E. 1989). Genetic algorithms are
especially applied as computer simulations where a
population of abstract representation (called
chromosomes) of candidate solutions (called
individual) on an optimization problem will develop
into a better solution. Traditionally, solutions are
represented in binaries as string '0' and '1', although it
is also possible to use different encodings
(encodings).
Genetic algorithms use the mechanisms of
natural selection and genetic science so that the terms
in the Genetic Algorithm will be in line with the terms
of natural selection and genetic science in general. A
solution developed in a genetic algorithm is called a
chromosome, whereas the chromosome is called a
population. A chromosome is formed from the
constituent components called a gene and its value
can be a numeric, binary, symbol or character. It is
seen from the problems to be solved. These
chromosomes will evolve continuously which will
later be called a generation. In each generation the
chromosome evaluated the success rate the value of
the solution to the problem to be solved using a
measure called fitness.
2.1 General Structure of Genetic
Algorithm
In general the structure of a genetic algorithm can
define with the following steps: (John Holland, 1975).
a) Determining the initial population, the genes
that fill each chromosome are generated
randomly with the N chromosome where the
population size depends on the problem and
corresponds to the solution domain.
b) The value of fitness, is the value that states
whether or not a solution (individual). This
fitness value is used as a reference in
achieving the optimal value in Genetic
Algorithm. Genetic Algorithm aims to find
individuals with the highest fitness value. In
general, the fitness function is derived from an
objective function with a non-negative value.
If the objective function has a negative value,
it is necessary to add a constant of C so that
the fitness value is not negative.
c) Selection, Selection is used to select which
individuals will be selected for cross breeding
and mutation. Selection is used to get a good
parent candidate. The higher the fitness value
of an individual the more likely to be elected.
d) Crossover Operator This function aims to
cross two chromosomes, resulting in new
chromosomes that carry different characters
(genes). This process is done many times in
the population. The chromosome to be omitted
is determined randomly. The procedure of
crossing one point as follows 1). Determine
the number of populations that will experience
a cross, based on pc.
2). Select two chromosomes as the parent, ie
p1 and p2.
3). Determine the crossover position by
generating random numbers with the range 1
to (length of chromosome-1).
e) Mutations, which play a role in replacing the
missing genes of the population due to a
selection process that allows the re-emergence
of genes that do not appear in the initial
population. Mutations can be made of all the
genes present with a given mutation
probability. If the random number generated is
less than the probability of the specified
mutation then change the gene to its inverse
value. In simple Genetic Algorithms, mutation
probability values are fixed during evolution.
The mutation (Pm) opportunity is defined as
the percentage of the total number of new
genes that will be raised for evaluation. If the
mutation chance is too small, many possible
useful genes are never evaluated. But if the
chance of this mutation is too great, it will be
too much random noise, so it will lose the
resemblance of the parent. Other mutation
processes can be mutated in genes as much as
the probability of a mutation * the number of
genes, in which the gene position to be carried
out by mutation is randomly selected (John
ICEST 2018 - 3rd International Conference of Computer, Environment, Agriculture, Social Science, Health Science, Engineering and
Technology
372

Holland of the University of Michigan in
1975).
3 K-NEAREST NEIGHBOR (KNN)
The K-Nearest Neighbor (K-NN or KNN) algorithm
is a method for classifying objects based on learning
data closest to the object. Learning data is projected
into many-dimensional space, where each dimension
represents a feature of the data. This space is divided
into sections based on the classification of learning
data. A point in this space is marked as class C if class
C is the most common classification of the nearest
neighbor of the titk. Close or away neighbors are
usually calculated based on Euclidean distance
(Kozma, Lazszlo 2013).
In the learning phase, this algorithm only stores
the features and classification vectors of learning
data. In the classification phase, the same features are
calculated for the test data (the classification is
unknown). The distance from this new vector to all
vectors of learning data is calculated, and a number
of k kits closest are drawn. The new point of
classification is predicted to include the most
classification of the points.
The best value of K for this algorithm depends
on the data; generally, a high k value reduces the
noise effect on the classification, but makes the
boundary between each classification more blurred.
A good K value can be selected with parameter
optimization, for example by using cross-validation.
A special case in which classification is predicted
based on the closest learning data (in other words, K
= 1) is called the nearest neighbor algorithm
(Mohammed J. Islam, 2011).
Steps to calculate KNN algorithm method:
a. Specifies the parameter K (the closest
number of neighbors).
b. Calculates the quadratic distance of Euclid
(query instance) of each object against the
given sample data. With
𝐷
𝑥,𝑦
𝑥
𝑦
(1)
Keterangan:
𝑥𝑖 = Sampel Data
𝑦𝑖 = Data Uji / Testing
𝑖 = Variabel Data
d = Jarak
c. Then sort those objects into groups that have
small Euclid spacing. Incorporate category
Y (Klasifikasi Nearest Neighbor)
The accuracy of the K-NN algorithm is strongly
influenced by the presence or absence of irrelevant
features, or if the weight of the feature is not
equivalent to its relevance to the classification.
Research on this algorithm largely discusses how to
choose and weight the features, so that classification
performance gets better.
Previously there were several related studies on
the use of the KNearest Neighbor method. As
research conducted by Khatib Alkhalit et al with the
title "Stock Prediction Using K-Nearest Neighbor
(KNN) Algorithm". In the study, stock prices are
predicted because the stock market is considered as a
field of trade that provides an easy profit
with a low level of risk and benefits for investors,
management and decision makers in determining
investment decisions.
The K-Nearest Neighbor method is chosen
because it has high accuracy and ratio
small mistake. The dataset used in the research is
data of the stock exchanges of five major companies
listed in the Jordanian stock exchange period of juni
2009 until december 2009. From result of research
done got predicted results with high accuracy and
results close to price actual stock.
There is also research on the use of K-Nearest
method Neighbor is implemented on prediction.
Research by title "Realtime Highway Trafic Accident
Prediction Based on k-Nearest Neighbor Method ".
Problems discussed in the research that is often the
occurrence traffic accidents and obstacles in
identifying traffic accidents in realtime. The purpose
of the research is to predict the potential traffic
accidents by identifying normal traffic conditions and
dangerous traffic conditions with realtime data.
4 DATA REDUCTION
Data reduction is a process of selection, focusing on
simplification, abstraction, rough data transformation
arising from field notes (Miles and Huberman (1992:
16)).
The steps taken are to sharpen the analysis,
classify or categorize into each problem through brief
descriptions, directs, discards unnecessary, and
organizes the data so that it can be withdrawn and
verified. Reduced data include all data on research
problems.
Reduced data will provide a more specific picture
and make it easier for researchers to collect further
data and seek additional data if needed. The longer
the researchers are in the field the more data the more,
the more complex and complicated. Therefore, data
reduction needs to be done so that the data does not
overlap so as not to complicate further analysis.
Reduction Attributes on K-Nearest Neighbor Algorithm (KNN) using Genetic Algorithm
373
4.1 Presentation of Data
After the data is in the reduction, the next step of
analysis is the presentation of the data. Presentation
of data is as a set of arranged information that
provides the possibility of drawing conclusions and
taking action. (Miles and Huberman, 1992).
The presentation of data is directed to reduce the
result data is organized, arranged in a relationship
pattern so that more easily understood. Presentation
of data can be done in the form of narrative
descriptions, charts, relationships between categories
and flowcharts. Presentation of data in such forms
facilitate researchers in understanding what happens.
In this step, the researcher tries to arrange the relevant
data so that the information obtained is concluded and
has a certain meaning to answer the research problem.
The presentation of good data is an important step
towards achieving a valid and reliable qualitative
analysis. In presenting the data not merely describe in
narrative, but accompanied by a process of
continuous analysis until the process of drawing
conclusions. The next step in the process of
qualitative data analysis is to draw conclusions based
on the findings and verify the data.
4.2 Normalization
Normalization (Normalization) is Process to organize
files to remove repetitive element groups ". The
concept and technique of normalization was
introduced by Dr.E.F Codd in his paper in 1970 and
1972. In his paper, E.F. Codd defines a new data
structure called the relationship data structure
(relational data structure). The term relationship data
indicates a data structure that has relationships with
other data elements, either in one or in other files. In
this normalization process there are several methods
that can be used such as: (J. Han, and M. Kamber,
2006,).
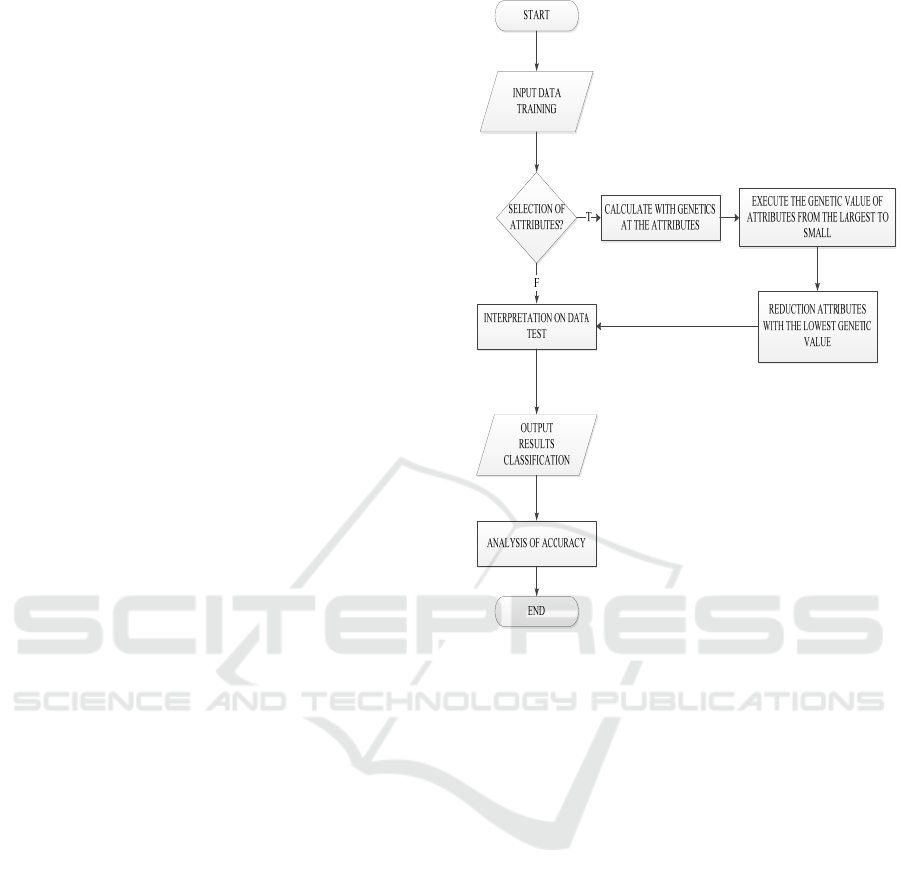
5 RESEARCH METHODOLOGY
The methodology of this research is shown in Figure
1
Figure 1. Flowchart The KNN Process With and Without
Attribute Selection
Figure 1 is an illustration of the flow of the
methodology of this study describing the steps to be
performed in the study, ranging from the dataset used
in performing attribute selection analysis on KNN
algorithm in predicting diabetes and examples of
research calculations.
5.1 Used Dataset
In this study, the secondary data used were taken from
the UCI Indian Pima database repository. The Pima
Indian dataset consists of 768 clinical data.
All patients are female and are at least 21 years of age
living in phoenix, Arizona, USA. This data set
contains two classes that are presented in binary
variables that are either '0' or '1'. The number "1" of
the test results indicates positive for diabetes and "0"
indicates negative diabetes. The dataset contains 768
patients with 9 numerical variables. There were 268
(34.9%) positive cases of diabetes with marked
classes "1" and 500 (65.1%) cases in grade "0". The
dataset does not contain missing values. Five patients
had glucose "0", 11 patients had BMI "0", 28 patients
ICEST 2018 - 3rd International Conference of Computer, Environment, Agriculture, Social Science, Health Science, Engineering and
Technology
374
had blood pressure "0", 192 patients had skin fold
thickness "0", 140 had serum insulin level "0". The
attributes of the pima indian dataset are shown in
table 1.
Table 1: Attribute Dataset Diabetes Mellitus in Indian
Pima
attrib
ute
numb
er
Attribute
Name
Descriptio
n
Type unit
A1
PREGNAN
T
Number of
time
pregnan
t
Numeric
-
A2 GTT
2-hours
OGTT
plasma
glucose
Numeric
mg/dl
A3 BP
Diastilic
blood
preseure
Numeric
mmH
g
A4
SKIN
Triceps
skin fold
thickness
Numeric
mm
A5 INSULIN
2-hours
serum
insulin
Numeric
Mm
U/ml
A6 BMI
Body mass
index
(kg/m)
Numeric
Kg/m
2
A7 DPF
Diabetes
pedigree
function
Numeric
-
A8
AGE
Age of
patient
(years)
Numeric
-
Class DIABETES
Diabetes
onset
within
years (0,1)
Numeric
-
5.2 Pre-processing and Sampling
Stages
This stage is done to get the data clean and ready to
use. The pre-processing data stage includes
identification and attribute identification and
selection, handling missing values, and value
discretization process. Statistical analysis of Indian
Pima diabetes dataset is shown in table 2 and table 3
below. The average value before normalization in
table 2. Furthermore the data is normalized using the
equation:
∗
𝑛𝑒𝑤_𝑚𝑖𝑛 (2)
The equation above to normalize the data.
Normalized results in table 3.
Table 2: Before Normalization
No
Atribut
Mean Standard
Deviation
Atr
_
1 3.84 3.37
Atr
_
2 120.89
31.97
Atr
_
3 69.1
19.35
Atr
_
4 20.53 16.0
Atr
_
5 79.79 115.24
Atr
_
6 31.99 7.88
Atr
_
7 0.47 0.33
Atr
_
8 33.24
11.76
Table 3: After Normalization
No
Atribut
Mean Standard
Deviation
Atr
_
1 0.226 0.19
Atr
_
2 0.608 0.16
Atr
_
3 0.566 0.15
Atr
_
4 0.207 0.16
Atr
_
5 0.094 0.13
Atr
_
6 0.477 0.11
Atr
_
7 0.168 0.14
Atr
_
8 0.204 0.19
6 RESULTS AND DISCUSSION
For this dataset, the results of testing with data
training as much as 538 data and data testing as much
as 230 data. By conducting trials on all attributes then
obtained the correct data as much as 445 of 538 data.
The equation of KNN classification accuracy using
the following equation:
accuracy
∗ 100% 3
Based on equation 2 obtained the accuracy of test
results shown in the table below. By using the above
accuracy equation for k = 10 then obtained the result
of classification calculation accuracy using KNN of
82,71%.
Table 4: Result of KNN Accuracy Testing
The value of
K is used
Data True
Accuracy
Results
k-5 430
79,93%
k
-10 445
82,71%
k-15 408
75,84%
k-20 428
79,55%
Reduction Attributes on K-Nearest Neighbor Algorithm (KNN) using Genetic Algorithm
375
k-25 405
75,28%
k-30 413
76,77%
k-35 404
75,09%
We can conclude from table 4 above k-10 is the
highest accuracy obtained by the accuracy of 82,71%.
So for the next process for taking the accuracy value
will use k = 10.
6.1 Selection Calculation Results 1
Attribute On KNN Classification
Using GA
Then we calculate the value of KNN accuracy that has
been in the reduction by using data testing for testing
as much as 230 Dataset. Of the 8 attributes we have
will do a combination of 8 using the Factorial formula
.
𝐶
!
! !
= 8 combination.
In combination of 8 above attributes by using
K = 10 Obtained the highest fitness result is 76,96%.
As in table 5 below:
Table 5: The result of selection of 1 attribute
No Attribute
Combination
True percentage
C1 1,2,3,4,5,6 &
7
171 74,34%
C2 1,2,3,4,5,6 &
7
171 74,34%
C3 3 & 8 139 60,43%
C4 1,2,3,4,5,7 &
8
176 76,39%
C5 1,2,3 & 7 170 73,91%
C6 1,2,5,6,7& 8 177 76,96%
C7 2,3,4,5,6 & 8 176 76,39%
C8 1,3,4,6,7 & 8 164 71,30%
So it can be concluded from table 5 above the
highest accuracy value on the 6th chromosome that is
equal to 76.96% by reducing attributes 3 and 4.
Next look at the comparison before and after
reducing attributes in table 6 and table 7 below:
Table 6: Accuracy Results Before Reduction
Description Accuracy True Data
Amoun
t
KNN before
reduction
Attributes
76,52% 176
Table 7: Accuracy Result Before Reduction
Description Accaruracy True Data
Amoun
t
KNN after
reduction
Attributes
76,96% 177
Furthermore, for comparison of the correct level
of data similarity between the classification before
and after reducible can be seen in table 8 below:
Table 8: The result of comparison of data similarity
classification
Classification Results
Accuracy
of Data
Similar
KNN before
attribute
reduction
KNN after the
combined
reduction of 1
attribute with
GA
84,78%
the table above shows the result of the similarity
between the classification KNN before and after
reducible obtained 84.78%, obtained the correct data
as much as 195 of 230 data.
6.2 Selection Calculation Results 2
Attribute On KNN Classification
Using GA
Of the 8 attributes we have will do a combination of
8 using the Factorial formula .
𝐶
!
! !
= 28 Kombinasi
In the combination of 28 attributes above by using
K = 10 Obtained fitness results highest ie 79.57%. As
in the table below:
Table 9: The result of the selection of 2 attributes
No Attribute
Combination
True percentage
C1 3,4,5,6,7 & 8 161 70%
C2 3,4,5,6, 7 & 8 161 70%
C3 1,4,,6 & 8 149 64.78%
C4
1,2,3,4,5,6 &
8
168 73.04%
C5 1,2,4,5 & 7 177 76.96%
C6 4,5,6,7 & 8 166 72.17%
ICEST 2018 - 3rd International Conference of Computer, Environment, Agriculture, Social Science, Health Science, Engineering and
Technology
376
C7 2,4,5 & 6, 161 70%
C8 2,3,5 & 7 166 72.17%
C9 1,3 & 7 147 63.91%
C10 2,3,4,6 & 8 176 76.52%
C11 1,3 & 4 152 66.09%
C12 3,4,5 & 7 162 70.43%
C13 1,2,5,7 & 8 182 79.13%
C14 1,2,3,5,7 & 8 172 74.78%
C15 2,3,5,6 & 8 180 78.26%
C16 3,4,6,7 & 8 162 70.43%
C17 3,5,6,7 & 8 167 72.61%
C18 1,2,4,5 & 8 176 76,52%
C19 2,3,5,6,7 & 8 183 79,57%
C20 2,3,4,5 & 7 171 74.35%
C21 1,2 & 4 165 71.74
C22 1,4,6 & 8 149 64.78%
C23 1,4,6,7 & 8 162 70.43%
C24 1,2,3,4 & 6 171 74.35%
C25 3,5,6,7 & 8 167 72.61%
C26 4,5 & 8 156 67.83%
C27 1,3,6,7 & 8 164 71.30%
C28 3,4,6,7 & 8 162 70.43%
So it can be concluded from table 9 above the
highest accuracy value on the 19th Chromosome that
is equal to 79.57% by reducing attributes1 and 4.
Next look at the comparison before and after
reducing attributes in table 10 and table 11 below:
Table 10: Accuracy Results Before Reduction
Information Accuracy
True Data
Amoun
t
KNN before
reduction
Attributes
76,52% 176
Table 11: Accuracy Result After Reduction
Information Accuracy
True Data
Amoun
t
KNN After
reduction
Attributes
79,57% 183
Furthermore, for comparison of the correct level
of data similarity between the classification before
and after reducible can be seen in table 8 below:
Table 12: hasil perbandingan klasifikasi kemiripan data
Classification Results
Accuracy
of Data
Similar
KNN before
attribute
reduction
KNN after the
combined
reduction of 1
attribute with
GA
87,39%
the table above shows the results of similarities
between the classification KNN before and after
reduced 87.39% obtained, obtained true data as much
as 201 of 230 data
7 CONCLUSION
Based on the testing and evaluation of KNN method
in attribute selection using genetic algorithm, the
conclusion obtained by the selection of 1 attribute
accuracy are: 76,52% before attribute reduction and
76,96% after reduction by reducing attribute 3 and 4,
and the result of classification the data likeness rate is
84.78%. While the result of accurate selection of 2
attributes are: 76,52% before reduction and 79,57%
after reduction by reducing attribute 1 and 4, and
result of classification of data likeness level equal to
87,39%.
The result of the accuracy percentage of the
combination of 1 attribute selection increased by
0.44% compared to before the reduction. And the
accuracy of the 2 attribute selection combination rose
by 3.05% before reduction. This proves that the
process of attribute selection has increased the
accuracy in determining the classification. And the
more combinations it performs the better the
optimization results of the genetic algorithm.
REFERENCES
Arwa Al-Rofiyee, Maram Al-Nowiser, Nasebih Al Mufad,
“Integrating Decision Tree and ANN for
Categorization of Diabetics Data” International
Conference on Computer Aided Engineering,
December 13-15, IIT Madras, Chennai, India (Asha
Gowda Karegowda , M.A. Jayaram, A.S. Manjunath
(2012)
Gorunescu, F, “Data Mining Concepts, Models and
Techniques”, Verlah Berlon Heidelberg:Spinger,
2011.)
T. Karthikeyan, “An Analytical Study on Early Diagnosis
and Classification of Diabetes Mellitus” (International
Reduction Attributes on K-Nearest Neighbor Algorithm (KNN) using Genetic Algorithm
377

Journal of Computer Application (2250-1797) Volume
5– No. 5, August 2015, )
Krati Saxena1, Zubair Khan. Diagnosis of Diabetes
Mellitus using K Nearest Neighbor Algorithm”, Shefali
Singh3, July 2014)
Lestari, Mei, 2014. “Penerapan Algoritma Klasifikasi
Nearest Neighbor (K-NN) untuk mendeteksi penyakit
jantung”, Faktor Exacta 7(4): 366-371, ISSN:1979-
276X.
Depkes RI, “Profil Keseheatan Indonesia”, Jakarta:
Depkes RI, 2009.
J. Han, and M. Kamber, “Data Mining: Concepts and
Techniques”, Second edition, 2006, Morgan
Kaufmann, USA.
Miles, B. Mathew dan Michael Huberman. 1992. Analisis
Data Kualitatif Buku Sumber Tentang Metode-metode
Baru. Jakarta: UIP
Min Max. Normalization Based Data Perturbation Method
for Privacy Protection” (Yogendra kumar Jain, santosh
Kumar Bhandre, 2011).
http://www.psu.edu.sa/megdam/sdma/Downloads/Post
ers/Pos ter%2003.pdf, diakses tanggal 16 April 2016)
Penelitian (Nirmala Devi, M.; Appavu, S., Swathi, U.V.,
―An amalgam KNN to predict diabetes mellitus:,
IEEE, 2013)
Setiawan Meddy, “Buku Ajar Endokrin, Malang, FK:UMM
Sitompul, O.S., 2008, Data Warehouse dan Data Mining
untuk Sistem Pendukung manajemen, Pidato
Pengukuhan Jabatan Guru Besar Tetap dalam Bidang
kecerdasan Buatan, Fakultas MIPA USU, Medan.
Bennett K, Henman M trinity College Dublin, Dublin,
Ireland 2015. The Impact of Self-Monitoring Of Blood
glucose (SMBg) On Prescription Costs In newly
Treated Type 2 Diabetes Melitus (T2DM): a
retrospective Cohort Analysis Grimes RT.
Z. Zukhri, Algoritma Genetika Metode Komputasi
Evolusioner untuk Menyelesaikan Masalah Optimasi,
Yogyakarta: ANDI, 2014.
ICEST 2018 - 3rd International Conference of Computer, Environment, Agriculture, Social Science, Health Science, Engineering and
Technology
378
