
Analysis of Raw Water Availability for Downstream Needs
in Geunang Uyat Small Dam Panton Reu
Sub-district West Aceh District
Muhammad Ikhsan
1*
, Lissa Opirina
1
and Zairi Ulul Azmi
2
1
Civil Engineering Department, Teuku Umar University, Alue Peunyareng, Meulaboh, Indonesia
2
Department of Civil Engineering, Teuku Umar University, Meulaboh, Indonesia
Keywords: Irrigation, Small Dam, Downstream Needs, Geunang Uyat.
Abstract: Panton Reu Sub-district is one of area in Aceh province located in West Aceh district, which has potential
of lack of raw water if the dry season or drought comes . The number of residents of Panton Reu sub-district
in 2015 according to Central Bureau of Statistics (BPS) of West Aceh is 6,146 people with an area of 83.04
km2. the majority of local people are farmers. Total rice field in this area is ± 515 hectares with a level of
water needs large enough. Geunang Uyat small dam can be utilized for clean water and irrigation needs in
Panton Reu. The purpose of this research to analyze the amount of downstream requirement ie for irrigation
and domestic and non domestic needs. The result of this research is the total discharge of Geunang Uyat small
dam is 0,174 m
3
, The maximum requirement for plants is 1.33l /s/ ha and the irrigation water requirement is
2.04 l/s/ha. Domestic and non-domestic water requirements planned for this Geunang Uyat embung can not
be met due to very limited discharge. So the existing discharge capacity in Geunang Uyat small dam only able
to fulfill the needs of rice fields water.
1 BACKGROUND
Water as a basic necessity for living will always
increase as the population grows. Increasing water
demand is often not accompanied by adequate water
supply. Limitations of raw water, both surface, rain
and ground water caused by lack of development in
water resources sector for example in water resources
Indonesia located in the tropics is a country that
has a sufficient level of water availability. However,
Indonesia has a real constraint in meeting the needs
of water due to distribution and coupled with uneven
distribution patterns of the population, so that the
available water does not always meet the needs of the
community, both in terms of quantity and quality. The
Earth has a huge potential that is about 1.454 million
km, with a composition of 97.5% of sea water and
2.5% of fresh water, water in the form of surface
water (rivers and lakes) and 0.4% of ground water
(wells and springs).
Panton Reu Sub-district is one of area in Aceh
province located in West Aceh district, which has
potential of lack of raw water if the dry season or
drought comes . The number of residents of Panton
Reu sub-district in 2015 according to Central Bureau
of Statistics (BPS) of West Aceh is 6,146 people with
an area of 83.04 km2. the majority of local people are
farmers. Total rice field in this area is ± 515 hectares
with a level of water needs large enough. Geunang
Uyat small dam can be utilized for clean water and
irrigation needs in this area.
2 LITERATURE REVIEW
2.1 Irrigation Water Requirement
The irrigation water requirement is the amount of
water volume required to meet evaporation needs,
water loss, water requirements for plants with respect
to the amount of water provided by nature through
rainfall and ground water contributions. Rice water
requirement for rice is determined by the following
factors: land preparation, consumptive use,
percolation and seepage, effective change of water
layer and rainfall.
Ikhsan, M., Opirina, L. and Azmi, Z.
Analysis of Raw Water Availability for Downstream Needs in Geunang Uyat Small Dam Panton Reu Sub-district West Aceh District.
DOI: 10.5220/0010041202450250
In Proceedings of the 3rd International Conference of Computer, Environment, Agriculture, Social Science, Health Science, Engineering and Technology (ICEST 2018), pages 245-250
ISBN: 978-989-758-496-1
Copyright
c
2021 by SCITEPRESS – Science and Technology Publications, Lda. All rights reserved
245

2.2 Hydrological Analysis
The calculation of the rainfall plan used to predict the
amount of rain with a certain repeat period. Based on
the rainfall the plan is then searched for the intensity
of rain used to look for flood discharge plans. To
predict the rainfall plan is done by frequency analysis
of rain data.
Log Type III method when described on
logarithmic probability paper will form a straight line
equation, so it can be expressed as mathematical
model with the following equation :
Y = Y + k .S (1)
2.2.1 Chi-Square Test Alignment
To determine the pattern of distribution of the most
appropriate average rainfall data from several
statistical distribution methods that have been done,
the alignment test is conducted. The chi-square
alignment test uses the formula:
(2)
2.2.2 Potential Evapotranspiration
Evapotranspiration is evaporation of the land surface
overgrown with plants. related to the plant, evapo-
transpiration is consumptive water requirement
defined as the total evaporation of the land and water
required by the plant..
da
eeufWRnWcET
..1.
0
(3)
1
1 RnRsRn
(4)
)/5,025,0( NnRaRs
(5)
)/(.)(.)(
1
NnfefTfRn
d
(6)
100
127,0)(
U
uf
(2.13)
100
RH
ee
ad
(7)
2.2.3 Effective Rainfall
Effective rainfall is the rainfall that plummets in area
and used for crops to growth. Determination of
effective rainfall is based on every half monthly, that
is 70% rain from rainy chance fulfilled 80% or chance
to fail 20% :
R
ef
=
%70
15
)(
%80
x
bulansetengahR
(8)
P
r
=
%100
1
n
m
(9)
2.2.4 Affiliations
The equations used to determine the net field
requirment (NFR) and irrigation water needs (DR) are
as follows (Yulianur, 2005):
WLRRPETNFR
ec
(10)
(11)
2.3 Projection of Population Growth
Predicted population can be obtained by population
projection. Population projection based on population
census. Here the population projection is not only a
few years after the census but may be several decades
after the census. Taking into account the rate of
development of the population of the past, the
statistical method is the closest approach to
estimating the number of people in the future.
There are several methods that can be used to
analyze future population growth.
2.3.1 Arithmetic Method
This method is usually referred to as an average loss.
This method used when the data periodically shows
the same number of additions each year. This occurs
in cities with small area, low economic growth rate
and city development is not too fast.
P
n
= P
0
+{ P
0
.Ka(r.n)} (12)
2.3.2 Geometric Method
For the purposes of population projection, this
method is used when data shows a rapid increase over
time. Thus population growth where growth rates are
the same or constant for each year.
Pn = Po ( 1 + r )
n
(13)
𝑋
2
𝑂𝑖 𝐸𝑖
2
𝐸𝑖
𝑛
𝑖0
DR =
64,8e
NFR
ICEST 2018 - 3rd International Conference of Computer, Environment, Agriculture, Social Science, Health Science, Engineering and
Technology
246
2.4 Raw Water
Raw water is water used as a source for water
treatment. Raw water can come from a variety of
water resources. Understanding clean water is water
that is free from substances dissolved and have
qualified quality so that can be consumed as drinking
water. But not always clean water can be interpreted
as water that can be directly consumed or drunk,
because the water used to support activities such as
bathing, washing, irrigation, livestock, industry, and
fisheries need clean water whose water quality is not
necessary such as drinking water. Sources of raw
water that can be used for the provision of clean water
that is rain water, surface water, and ground water.
The need for clean water is an unlimited and
sustainable need. While the need for water supply and
service from time to time is increasing, which is
sometimes not matched by service capability. This
increase in demand is due to the increase of
population, the increasing of citizen life status and the
development of city/service area or things related to
the improvement of socio-economic condition of the
people.
2.4.1 Domestic Water Requirement
The clean water needed for daily activities is referred
to as domestic demand in this case including water for
drinking, cooking, cleaning the toilets and so on.
The basic needs of the domestic is the need for
clean water for the residents of the housing
environment are limited to household necessities such
as bathing, drinking, cooking, and others (Ministry of
Public Works, "Maximum Water Requirements
Day").
To estimate the current and future amount of
domestic water demand is calculated based on
population, population growth rate and per capita
water requirement. The per capita water requirement
is influenced by physical activity and habit or welfare
level. Therefore, in estimating the amount of
domestic water needs to distinguish between the
needs of water for urban residents (urban areas) and
rural areas (rural). The differentiation of water
demand is done with the consideration that people in
urban areas tend to use more water than the
population in the rural area. The amount of water
consumption can refer to the various standards that
have been published.
2.4.2 Non Domestic Water Requirement
The non-domestic basic water requirement is a water
requirement for residents outside the housing
environment (Ministry of Public Works, "Maximum
Water Requirements Day"). The need for non
domestic water is often also called urban water needs
(municipal). The need for clean water is determined
by the number of non-domestic consumers that
include office facilities (government and private),
places of worship (mosque, church, etc.), education
(schools), commercial (shop, hotel), public (market,
terminals) and Industry (Ikhsan, 2013).
Non-domestic sector analysis is conducted by
holding on to the latest growth data analysis of
existing socio-economic facilities in the planning
area. Non-domestic water requirements for cities can
be divided into several categories:
1. City Category I (Metro)
2. Category City II (Big City)
3. City Category III (Medium City)
4. City Category IV (Small Town)
5. Cities Category V (Village)
The amount of urban water demand can be
obtained by a percentage of the total household needs,
ranging from 25-40% of household water needs. The
40% rate applies specifically to metropolitan cities
with very high population density such as Jakarta.
Meanwhile, to obtain the amount of water demand
in a region, the equation is used to multiply the
number of users with the standard water requirement
for each type of use (Ikhsan, 2013).
Qy = dy x Py (13)
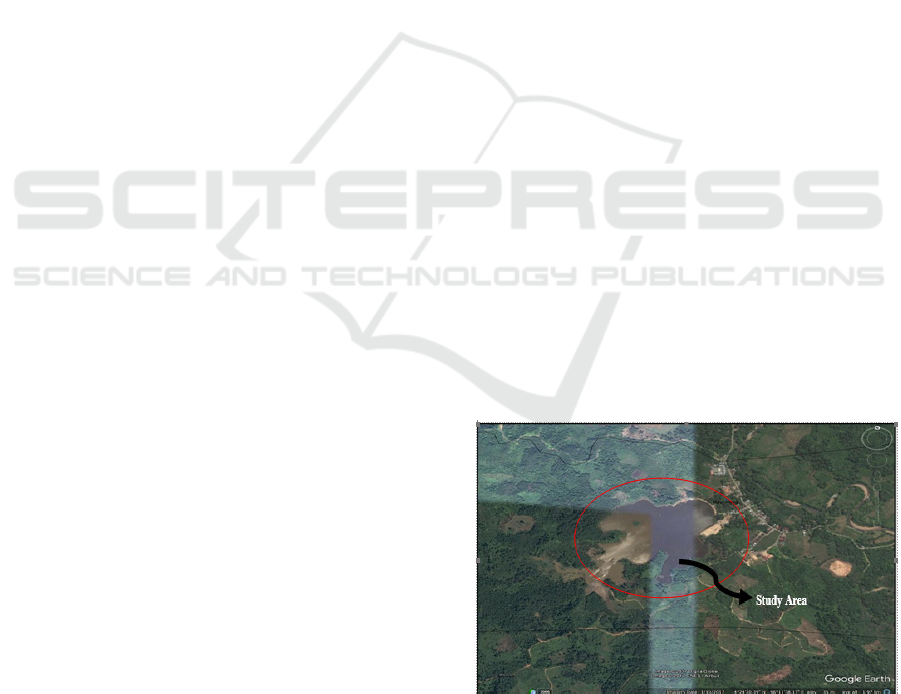
2.5 Study Area
This study was conducted at the location of
development of small dam Geunang Uyat District
Panton Reu Sub district West Aceh district, as shown
in Figure 1.
Figure 1: Study area
Analysis of Raw Water Availability for Downstream Needs in Geunang Uyat Small Dam Panton Reu Sub-district West Aceh District
247
3 RESULT AND DISCUSION
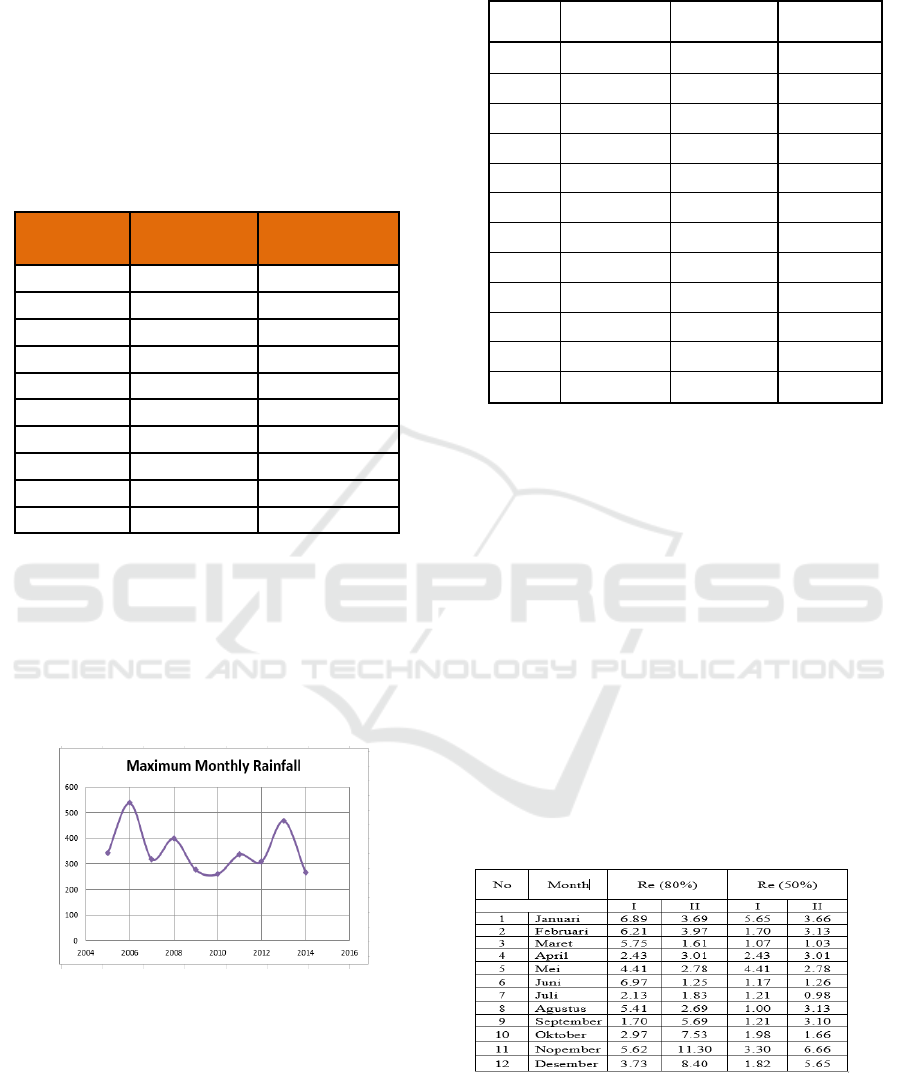
3.1 Maximum Monthly Rainfall
The rainfall data used is the maximum monthly
rainfall data each year from the rain gauge station.
The maximum monthly rainfall for 10 years is from
2005-2014.
Table 1: Maximum monthly rainfall
No Year
Max
1
2005
343
2
2006
538
3
2007
318.3
4
2008
398
5
2009
276
6
2010
260
7
2011
336.4
8
2012
309
9
2013
468
10
2014
265
For the mutual benefit and protection of
Authorsand Publishers, it is necessary that Authors
provide formal written Consent to Publish and
Transfer of Copyright before publication of the Book.
The signed Consent ensures that the publisher has the
Author’s authorization to publish the Contribution.
The copyright form is located on the authors’
reserved area.
Figure 1: Maximum monthly rainfall
3.2 Potential Evapotranspiration
This calculation is done by using climatology data,
result of calculation can be seen in table 2
.
Table 2. Potential Evapotranspiration
No Mounth mm/day mm/month
1 Janua
r
y 3.937 115.338
2Februa
r
y 4.119 115.338
3Ma
r
ch 4.804 148.927
4 April 4.111 123.321
5 Mei 3.667 113.671
6 June 3.638 109.136
7 July 3.718 115.265
8 Augus
t
4.158 128.892
9Septembe
r
4.289 128.660
10 Octobe
r
4.450 137.962
11 Novembe
r
3.716 111.470
12 Decembe
r
3.466 107.453
We can see the magnitude of potential
evapotranspiration (ETo) that occurred in the District
of Panton Reu, West Aceh regency. Maximum
evapotranspiration value (ETo) occurs in March,
reaching 4,804 mm/day or 148,927 mm/ month.
Evapotranspiration occurs when there is enough
water (from participation or irrigation) to meet
optimum growth. The greater the area of watered
agriculture the greater the need for water for
evapotranspiration.
3.3 Effective Rainfall
Determination of effective rainfall is based on every
half monthly, that is 70% rain from rainy chance
fulfilled 80% or 20% chance of failure. For that can
be seen in table 3
Table 3. Effective rainfall
3.4 Rice and Irrigation Water
Requirement
Irrigation water demand is the amount of water
volume required to meet evaporation needs, water
ICEST 2018 - 3rd International Conference of Computer, Environment, Agriculture, Social Science, Health Science, Engineering and
Technology
248
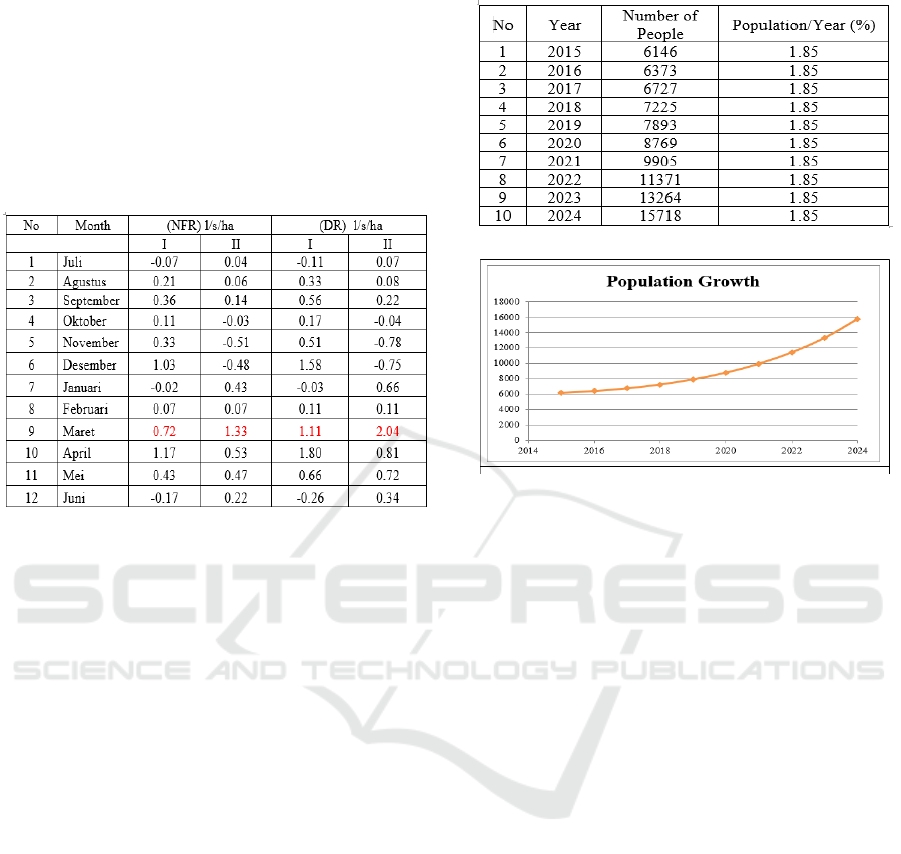
loss, water requirements for crops with respect to the
amount of water provided by nature through rainfall
and groundwater contribution. In this study the water
source used to meet the needs of water irrigation
water that is in embung Geunang To meet the needs
of irrigation water in the District of Panton Reu West
Aceh district. The calculation of irrigation water
demand can be seen in Table 4.
Table 4. Rice and irrigation water requirement
Irrigation water demand is the amount of water
volume required to meet evaporation needs, water
loss, water requirements for crops with respect to the
amount of water provided by nature through rainfall
and groundwater contribution.
3.5 Population Projection
Population projection based on population census,
here population projection not only a few years after
census but maybe until several decades after census.
With regard to the rate of population growth in the
past, the statistical method is the closest method to
estimate the population in the future. In research
conducted in this Panton Reu dikecamatan this
population projection will calculated using arithmetic
method with 10 year scale. The available data is the
number of population in 2015 which amounted to
6146 people, This data is taken from the West Aceh
District Statistics Agency. Next will look for the
number of residents in the future from 2016 - 2024.
Table 5: projected number of people of 10 years
Figure 2. graph of population increase each year
explains the graph of population increase each
year in the District of Panton Reu, West Aceh regency
for a 10-year period from 2015 to 2024. Panton Reu
district has a population density of 1.85% every year.
This number continues to increase in the next few
years as time goes by.
3.6 Domestic Water Demand
The basic needs of the domestic is the need for clean
water for residents of the housing environment is
limited to household needs such as bathing, drinking,
cooking, and others. To estimate the current and
future amount of domestic water demand is calculated
based on population, population growth rate and per
capita water requirement. The per capita water
requirement is influenced by physical activity and
habit or welfare level. Therefore, in estimating the
amount of domestic water needs to distinguish
between the needs of water for urban residents (urban
areas) and rural areas (rural). The existence of
different water needs was done with the consideration
that people in urban areas tend to use more water than
the population in the rural area.
Analysis of Raw Water Availability for Downstream Needs in Geunang Uyat Small Dam Panton Reu Sub-district West Aceh District
249
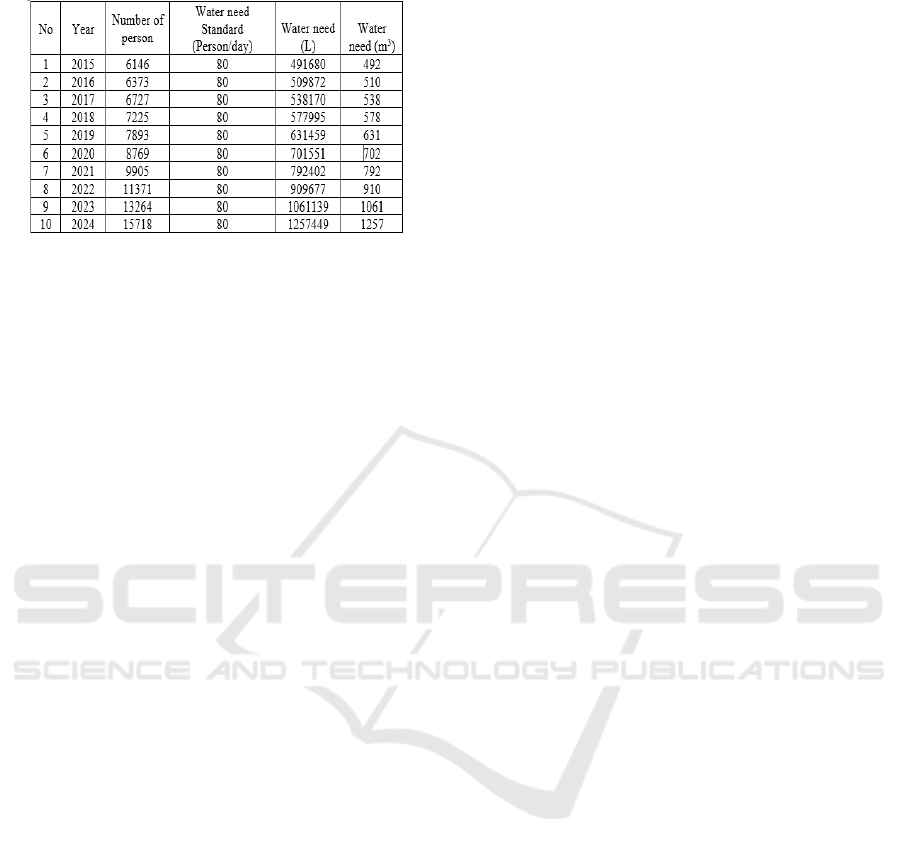
Table 4. Domestic Water Requirement of 10 year
large discharge needed to meet domestic water needs
every year. While the remaining debit that existed in
Geunang Uyat Embung after meeting the needs of
rice and irrigation water is only 0.159 m3. While the
debit that must be met to meet the needs of domestic
water for one year alone for example in 2015
amounted to 429 m3. The huge amount of domestic
water demand in each year, it can be concluded that
the Geunang Uyat embungs are unable to meet
domestic and non-domestic water needs due to the
insufficient capacity of the planned capacity.
4 CONCLUSION
1. From the analysis of the frequency of rain data with
some distribution of gumbel, normal, normal log
and log person III then obtained the suitable
distribution used was the distribution of log person
III with Cs ≠ 0 and the calculation Cs = 0.7884 for
this distribution log person III is eligible.
2. The planned cropping pattern in Panton Reu area is
Palawija - Padi - Rice with planting planning July
1st. This planning is based on the needs of wetland
water and the requirement for maximum irrigation
water occurs in July with NFR = 1.33 l/ s/h and DR
= 2.04 l /s/ h.
3. The number of residents in Kecamatan Panton Reu
if it is predicted in the 10 year period from 2015-
2024 amounted to 93392,43 people with a growth
rate of 1.85% / year.
4. Domestic water needs are planned by utilizing
Geunang Uyat embungs can not be realized
because the debit that must be met to meet the
domestic water needs for one year only in 2015
amounted to 429 m3 while the residual debit
existing in Geunang Uyat embung only 0.166 m3.
So the existing water capacity in Geunang Uyat
small dam only can fulfill the needs of field rice
water.
ACKNOWLEDGEMENTS
On this occasion the author would like to say thank
God to Allah SWT who has given health so that can
finish this research. thanks to all those who have
assisted in this research, Dean of Faculty of
Engineering Teuku Umar University Dr. Ir. H.
Komala Pontas, chairman of the Department of Civil
Engineering Mrs. Lissa Opirina, S.T., M.T. to the
students who have helped the author also thank you
very much. Hopefully this research is useful. Amen.
REFERENCES
BSN Raju, Water Supply and Wastewater Engineering,
Tata McGraw-Hill Publishing Company Limited,
New Delhi, 1995
Direktorat Jendral Cipta Karya, Departemen Pekerjaan
Umum, 1996.
Ikhsan.,J, 2013. Analisis Kebutuhan Air Irigasi Pada
Daerah Irigasi Bendung Mirican 1, Program Study
Teknik Sipil, Universitas Muhammadiyah Yogyakarta.
Priyantoro.,G, 2007. Analisa Ketersediaan dan Kebutuhan
Air Pada DAS Sampean, Program Study Teknik Sipil,
Fakultas Teknik, Universitas Bengkulu.
Somantri, G.Y., 2014. Analisis Kapasitas Sungai
Dalam Mengendalikan Banjir Dengan Integrasi
Antara Metode Rasional Dengan Program Win-Tr
kasus DAS Bengkulu, Program Study Teknik Sipil,
Fakultas Teknik, Universitas Bengkulu.
Soedjono
., H, 2011.
Penyediaan Air Bersih Pulau Banggai,
Kabupaten Banggai Kepulauan – Propinsi Sulawesi
Tengah
,
Program Study Teknik Sipil, Fakultas Teknik,
Universitas Gajah Mada.
Suprihandto, N.T., 2014. Studi Pemenuhan Kebutuhan Air
Bersih Dengan Sistem Penampungan Air Hujan Di
Pulau Panggang, Program Studi Magister Pengelolaan
Sumber Daya Air, Institut Teknologi Bandung.
Suripin., 2003.
Pelestarian Sumber Daya Tanah dan Air
,
ANDI, Yogyakarta.
Triatmodjo., B, 2009. Hidrologi Terapan. Penerbit Beta
Offset, Yogyakarta.
Wilson, E.M, Hidrologi Teknik, Penerbit ITB, Bandung,
1993.
Yulianur, N., 2005. Perencanaan Irigasi dan Bangunan
Air, Program Study Teknik Sipil, Fakultas Teknik,
Universitas Sumatera Utara.
ICEST 2018 - 3rd International Conference of Computer, Environment, Agriculture, Social Science, Health Science, Engineering and
Technology
250
