
Levenberg-Marquardt Algorithm Combined with Bipolar Sigmoid
Function to Measure Open Unemployment Rate in Indonesia
Anjar Wanto, Irfan Sudahri Damanik, Indra Gunawan, Eka Irawan, Heru Satria Tambunan, Sumarno,
Zulaini Masruro Nasution
Tunas Bangsa College of Computer Science, Sudirman street Blok A Number 1, 2,
3 Pematangsiantar, North Sumatra - Indonesia
eka.irawan@amiktunasbangsa.ac.id, heru@amiktunasbangsa.ac.id, sumarno@amiktunasbangsa.ac.id,
zulaini@amiktunasbangsa.ac.id
Keywords: Levenberg-Marquardt, Combined, Sigmoid, Bipolar, Unemployment.
Abstract: The purpose of this research is to see how much open unemployment rate according to the highest education
completed in the country of Indonesia for subsequent years through predictions used on the basis of existing
data, which later as input for the government so that the government can make better policies to suppress the
unemployment rate. This research uses artificial neural network application using a combination of
Levenberg-Marquardt Algorithm with bipolar sigmoid function. Open unemployment data according to the
highest education is sourced from the National Labor Force Survey of the Republic of Indonesia, 2013-2017
in each semester. The data processing consists of two stages where the first phase of pattern recognition and
the second stage is predicted. Pattern recognition and prediction use different data from the same process that
uses data training and data testing. Data Training year 2013-2015 with target of 2016, while data testing year
2014-2016 with target year 2017. Architectural model used there are five, among others 6-2-5-2, 6-5-6-2, 6-
5-8-2, 6-5-10-2 and 6-8-12-2. From the 5 models it can be concluded that the best model is 6-5-10-2 with
epoch of 13 iterations, MSE in February 0.0109696004, MSE in August 0.0233797200. While the accuracy
rate in February and August is the same, that is equal to 88%.
1 INTRODUCTION
Unemployment is a term for people who do not work
at all, looking for work, working less than two days a
week or someone trying to get a decent job.
Unemployment is largely due to the fact that the
number of the labor force or job seekers is not
proportional to the amount of available employment
that is able to absorb it. Unemployment is often a
problem in the economy, because, with
unemployment, people's productivity and income will
be reduced so that it can cause poverty and other
social problems. Open Unemployment Rate is the
percentage of unemployment to the total labor force.
Unemployment in Indonesia includes issues that
are still difficult to overcome by the government.
Many factors affect the unemployment rate, one of
which is inflation, financial crisis to low levels of
community education (Tesfaselassie and Wolters
2017) (Carrillo-Tudela, Graber, and Waelde 2017).
Therefore, the role of government is needed in
tackling the problem of unemployment. Open
unemployment data in Indonesia according to the
highest education completed can be seen in the
following table:
Table 1: Open Unemployment According to Completed
Higher Education
Nu
Highest
Education
Completed
2013 2017
February August February August
1
Never
School
112.435 81.432 92.331 62.984
2
Hasn't
finished
primary
school
523.400 489.152 546.897 404.435
3
Primary
school
1.421.873 1.347.555 1.292.234 904.561
4
Junior
high
school
1.821.429 1.689.643 1.281.240 1.274.417
5
Senior
High
School
General
1.874.799 1.925.660
1.552.894 1.910.829
22
Wanto, A., Damanik, I., Gunawan, I., Irawan, E., Tambunan, H., Sumarno, . and Nasution, Z.
Levenberg-Marquardt Algorithm Combined with Bipolar Sigmoid Function to Measure Open Unemployment Rate in Indonesia.
DOI: 10.5220/0010037200220028
In Proceedings of the 3rd International Conference of Computer, Environment, Agriculture, Social Science, Health Science, Engineering and Technology (ICEST 2018), pages 22-28
ISBN: 978-989-758-496-1
Copyright
c
2021 by SCITEPRESS – Science and Technology Publications, Lda. All rights reserved
6
SHS /
Vocational
School
864.64
9
1.258.20
1
1.383.02
2
1.621.40
2
7
Academy /
Diploma
197.27
0
185.10
3
249.70
5
242.93
7
8 University 425.04
2
434.18
5
606.93
9
618.75
8
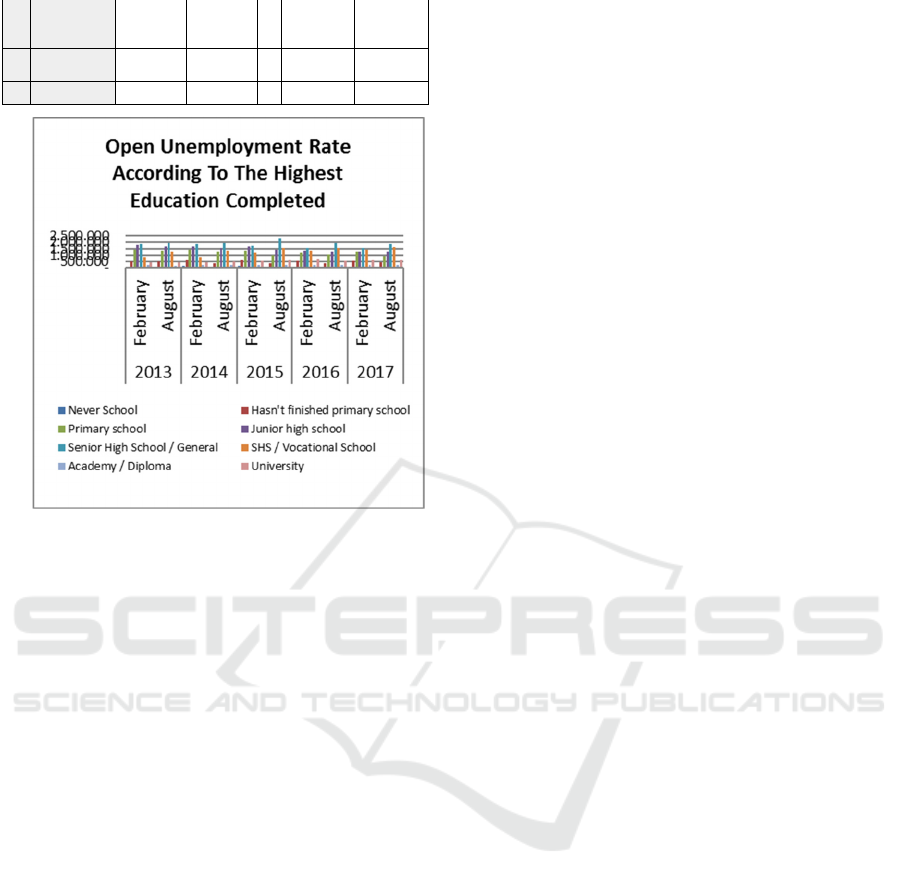
Figure 1: Open Unemployment According to Completed
Higher Education
One way to suppress open unemployment by the
highest education completed is to forecast the
unemployment rate for subsequent years. Forecasting
results will be used as a barometer for the
Government to determine the policy as early as
possible, by applying appropriate measures
considered in overcoming unemployment. However,
the forecasting process is not easy, it takes the basic
model and time series data of those problems, which
is generally complicated by the estimation of
inaccurate accuracy, requiring more advanced
techniques (Hrasko, Pacheco, and Krohling 2015).
Therefore, forecasting techniques using the
Levenberg-Marquardt Algorithm combined with
bipolar sigmoid function. The Levenberg-Marquardt
algorithm is closer to the matrix that usually exists in
the optimization method. This reduces algorithm
complexity significantly (Sarabakha et al. 2017). This
algorithm is a powerful algorithm capable of
approaching and simplifying problems resulting in
faster and less complex convergence than standard
gradient descent or even backpropagation JST
methods. The Levenberg-Marquardt algorithm is
widely favored as a forecasting algorithm, because of
its superior performance with the use of more
consequent parameters (Castillo et al. 2013)
(Salimifard and Safavi 2013), and has many
successful implementations (Khanesar and Kayacan
2013).
In this research, the Levenberg-Marquardt
algorithm will be combined with bipolar sigmoid
function. The bipolar sigmoid function is almost the
same as the binary sigmoid function, only the output
of this function has a range between 1 to -1. The
bipolar sigmoid function is often used to predict time
series data whose value is up and down (unstable),
therefore we could readily analyze the situation of
using bipolar sigmoid activation function (Yunong
Zhang and Ke Chen 2008) (Zhang, Zhang, and Im
2017).
2 RUDIMENTARY
2.1 Artificial Intelligence
Artificial Intelligence is one area that is quite reliable
in solving problems such as prediction
(forecasting) (A. Wanto et al. 2017). AI is a very
important discipline and it includes a number of well
recognized and mature areas including Neural
Network (Chiroma et al. 2014) (Hakim, Sari, and
Herawan 2014) (Lasisi, Ghazali, and Herawan 2014).
Artificial Intelligence (AI) is a general term that
implies the use of a computer to model intelligent
behavior with minimal human intervention. AI is
generally accepted as having started with the
invention of robots. The term derives from the Czech
word robota, meaning biosynthetic machines used as
forced labor (Hamet and Tremblay 2017). AI is a field
of research based on the premise that intelligent
thought can be regarded as a form of computation -
one that can be formalized and ultimately
mechanized. To achieve this, however, two major
issues need to be addressed. The first issue is
knowledge representation, and the second is
knowledge manipulation (Sumijan et al. 2016).
2.2 Artificial Neural Networks (ANN)
Artificial Neural Network (ANN) is one of the studies
of Artificial Intelligence and is a new computing
technology in the field of computer science
research. Neural networks mostly used for problem-
solving in pattern recognition, data analysis, control
and clustering (Adnan et al. 2017). Initially ANN
were developed in the field of artificial intelligence
and were first introduced for image recognition. The
central concept was inspired by knowledge of the
nervous system, especially the human brain with its
closely connected neurons (Ehret et al. 2015).
Artificial neural network (ANN) is one of the
methods that is suitable to deal with the internal
relations of complex model because of its highly
Levenberg-Marquardt Algorithm Combined with Bipolar Sigmoid Function to Measure Open Unemployment Rate in Indonesia
23

nonlinear, large amounts of data parallel processing,
high robustness, and fault tolerance (Wang et al.
2017) (Anjar Wanto et al. 2017).
Figure 2: Artificial Neural Networks
The schematic representation of artificial neural
network. It consists of: (1) input layer (independent
variables), (2) hidden layers and, (3) the output layer
(dependent variable) (Parveen, Zaidi, and Danish
2017) (Putra Siregar and Wanto 2017).
2.3 Levenberg Marquardt Algorithm
In engineering and scientific computing, the
Levenberg-Marquardt algorithm (LMA or just LM) is
used to solve non-linear least squares problems. The
algorithm was first published in 1944 by Kenneth
Levenberg (Levenberg 1944) and in 1963 by Donald
Marquardt (Marquardt 1963). It is well known that
the LM method has quadratic convergence as the
Newton method if the Jacobian is Lipschitz
continuous and nonsingular at some solutions.
However, the condition on the non-singularity of the
Jacobian is very strong. (Yamashita and Fukushima
2001) (Fan and Pan 2009) (Fan and Yuan 2005)
Showed that if the LM parameter is chosen properly,
then the LM method preserves the quadratic
convergence under the local error bound condition,
which is weaker than non-singularity.
In this paper, we propose an LM algorithm to
predict the time series data to be combined with the
bipolar sigmoid activation function, to see how well
the accuracy and quality of these algorithms are in
forecasting the times series data
2.4 Fungsi Sigmoid Bipolar
The activation function is used to build training
networks on artificial neural networks. Determining
the optimal activation function of artificial neural
networks is important because it is directly related to
the success rate obtained. But, unfortunately, there is
no way to determine it analytically, the optimal
activation function is generally determined by testing
or adjustment. This paper discusses a simpler and
more effective approach for optimal activation
functionality. In this approach, which can be referred
to as a trained activation function, the activation
function is trained for each particular neuron. The
training process is based on the training dataset,
which consists of the number of inputs of each neuron
in the hidden layer and the desired output. In this way,
different activation functions are generated for each
neuron in the hidden layer (Ertugrul 2018).
In artificial neural networks, the activation
function used must meet several conditions, namely:
continuous, can be derived and is a function that does
not go down. One of the activation functions that
meet the characteristics of artificial neural networks
is the function of bipolar sigmoid function. The
derivative of this activation function is required by
the update weight rule, due to the condition of the
differentialization that requires the requirements
(Mishra et al. 2017). This paper uses bipolar sigmoid
Function because time series data to be processed up
and down value (unstable), therefore we could readily
analyze the situation of using bipolar sigmoid
activation function.
3 RESULT AND DISCUSSION
3.1 Data Collection
Data to be processed is unemployment data in
Indonesia according to the highest the education year
2013-2017. Data source from the National Labor
Force Survey and Indonesian Central Bureau of
Statistics. The data can be seen in table 1 in the
previous discussion.
3.2 Data Training and Testing
The dataset year 2013-2015 is used as training with
target 2016. While the dataset year 2014-2016 used
as testing with a target of 2017.
3.3 Normalization Data
The data will be normalized using the following
formula.
(1)
0.8( )
'0.1
xa
x
ba
ICEST 2018 - 3rd International Conference of Computer, Environment, Agriculture, Social Science, Health Science, Engineering and
Technology
24
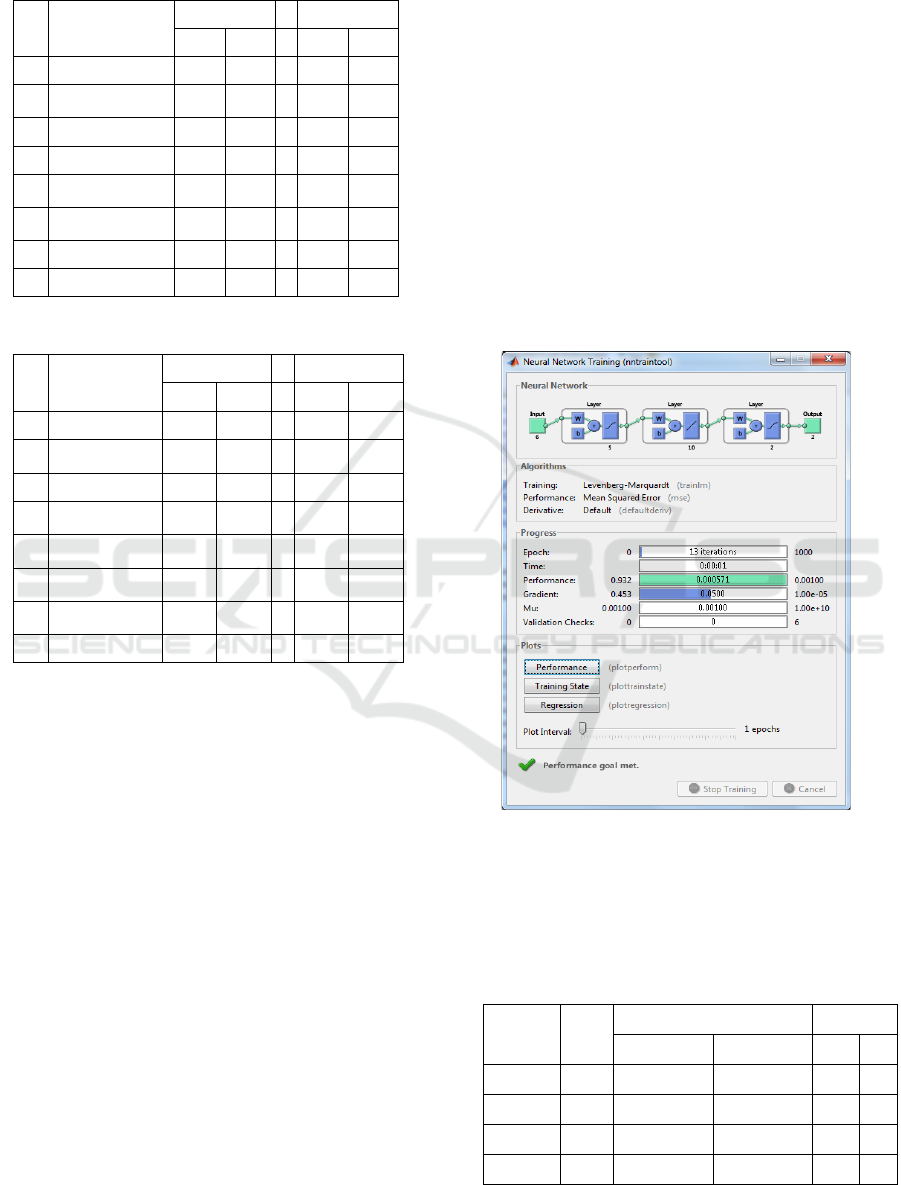
Table 2: Normalization of training data
Nu.
Highest Education
Completed
2013 ... 2017
Feb Aug ... Feb Aug
1 Never School 0,1205 0,1093 ... 0,1139 0,1014
2
Hasn't finished
primary school
0,2683 0,2559 ... 0,2805 0,2181
3 Primary school 0,5914 0,5646 ... 0,5184 0,4525
4 Junior high school 0,7351 0,6877 ... 0,5525 0,5456
5
Senior High School
/ General
0,7543 0,7726 ... 0,6363 0,7815
6
SHS / Vocational
School
0,3910 0,5325 ... 0,5649 0,6269
7 Academy / Diploma 0,1510 0,1466 ... 0,1697 0,1590
8 University 0,2329 0,2362 ... 0,3301 0,2840
Table 3: Normalization of testing data
Nu.
Highest
Education
Completed
2013 ... 2017
Feb Aug ... Feb Aug
1 Never School
0,1282 0,1070 ... 0,1132 0,1027
2
Hasn't finished
primary school
0,2996 0,2201 ... 0,2767 0,2255
3 Primary school
0,5745 0,5222 ... 0,5448 0,4053
4
Junior high
school
0,6890 0,6435 ... 0,5408 0,5383
5
Senior High
School / General
0,7610 0,7859 ... 0,6385 0,7672
6
SHS / Vocational
School
0,3848 0,5592 ... 0,5774 0,6631
7
Academy /
Diploma
0,1502 0,1496 ... 0,1698 0,1674
8 University
0,2233 0,2581 ... 0,2983 0,3025
3.4 Analysis and Results
3.4.1 Analysis
This research uses 5 architectural models with 2
hidden and 2 outputs, among others: 6-2-5-2, 6-5-6-
2, 6-5-8-2, 6-5-10-2 and 6- 8-12-2. Training and test
parameters using Target Minimum Error = 0.001 -
0.05, Maximum Epoch = 1000, and Learning Rate =
0.001. The Levenberg-Marquardt (trainlm) algorithm
will be combined with the bipolar sigmoid activation
function (tansig). Broadly speaking, the analysis of
this combination will be applied using Matlab 2011.
The program listing can be seen as follows:
>>net=newff(minmax(P),[Hidden,Target],{'tansig','pureli
n','tansig'},'trainlm');
>> net.IW{1,1};
>> net.b{1};
>> net.LW{2,1};
>> net.b{2};
>> net.LW{3,2};
>> net.trainparam.epochs=1000;
>> net.trainparam.LR=0.001;
>> net.trainParam.goal = 0.001;
>> net.trainParam.show = 1000;
>> net.b{3};
>> net=train(net,P,T)
3.4.2 Results
Overall, the best results of the 5 network architecture
models used are 6-5-10-2, with the accuracy of output
in semester 1 (February) at 88% and in the 2nd
semester (August) also equal 88%. Actually, the
architecture model 6-5-8-2 produces 100% accuracy
in semester 1 (February), but in the 2nd semester
(August) its accuracy is low ie 75%. So we chose 6-
5-10-2 as the best model, with consideration of stable
accuracy.
For more details can be seen in the following
picture:
Figure 3: Training with architecture 6-5-10-2
Comparison of standard gradient descent training
functions with gradient descent with momentum and
adaptive LR can be seen in the following table:
Table 4: Results Levenberg-Marquardt + Bipolar
Arsitektur Epoch
MSE Akurasi
Feb Agu Feb Agu
6-2-5-2 14 0,0022588499 0,0065650062 63% 75%
6-5-6-2 6 0,0126063807 0,0680858800 75% 63%
6-5-8-2 6 0,0004848094 0,0043782187 100% 75%
6-5-10-2 13 0,0109696004 0,0233797200 88% 88%
Levenberg-Marquardt Algorithm Combined with Bipolar Sigmoid Function to Measure Open Unemployment Rate in Indonesia
25
Arsitektur Epoch
MSE Akurasi
Feb Agu Feb Agu
6-8-12-2 9 0,1704704039 0,1267147790 75% 75%
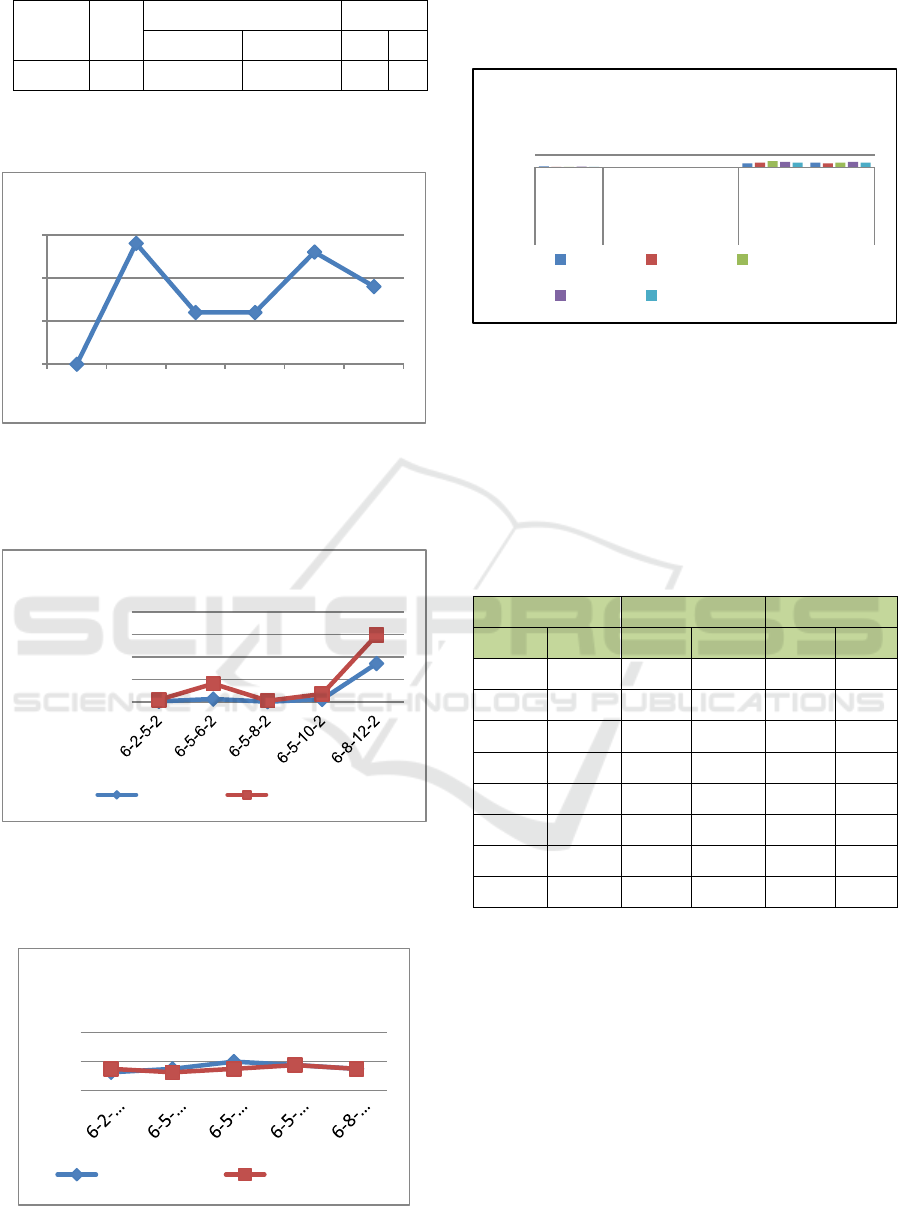
Comparison of each Epoch from the 5 architecture
models can be seen in the following figure:
Figure 4: Comparison of Epoch
Comparison of MSE from the 5 architectural
models can be seen in the following figure:
Figure 5: Comparison of MSE
Perbandingan tingkat akurasi dari ke 5 model
arsitektur dapat dilihat pada gambar berikut:
Figure 6: Comparison of Accuracy
The overall comparison (Epoch, MSE, and
Accuracy) of the 5 architectural models can be seen
in the following figure:
Figure 7: Comparison of Epoch, MSE, and Accuracy
From forecasting calculations using the
Levenberg-Marquardt algorithm combined with the
bipolar sigmoid activation function, it will show the
results of open unemployment forecasting in
Indonesia according to the highest education
completed as follows (2018-2020):
Table 5: Results of Open unemployment forecast by highest
education completed (2018-2020)
2018 2019 2020
February August February August February August
119.343 68.989 117.641 97.529 138.002 125.775
449.646 353.327 311.097 183.148 179.698 145.338
1.181.392 771.864 787.267 597.450 418.745 374.848
1.185.781 1.079.299 810.060 783.436 416.299 398.325
1.173.308 1.601.315 727.889 1.075.727 394.290 537.841
141.894 1.363.174 741.489 881.314 403.950 458.484
232.986 218.665 203.260 169.740 157.444 141.670
521.019 532.568 392.693 421.999 296.837 276.906
4 CONCLUSIONS
From the previous explanation, it can be concluded as
follows:
1. The accuracy, MSE and Epoch levels of the
Levenberg-Marquardt Algorithm combined
with bipolar sigmoid depend on the
architectural model used.
2. Determination of the parameters of optimum
network can only be done based on the
learning process and the determination of the
0
5
10
15
6-2-5-2 6-5-6-2 6-5-8-2 6-5-10-
2
6-8-12-
2
Epoch
0,0000000000
0,1000000000
0,2000000000
0,3000000000
0,4000000000
MSE
MSE Feb MSE Aug
0
100
200
LevelofAccuracy
AccuracyFeb AccuracyAug
0
200
Feb Aug Feb Aug
Epoch MSE Accuracy
Levenberg-Marquardt + Sigmoid
Bipolar
6‐2‐5‐2 6‐5‐6‐2 6‐5‐8‐2
6‐5‐10‐2 6‐8‐12‐2
ICEST 2018 - 3rd International Conference of Computer, Environment, Agriculture, Social Science, Health Science, Engineering and
Technology
26

error so that the length of research time can’t
be determined with certainty.
3. The number of iterations can’t be determined
by the size of the desired pattern recognition
accuracy but is determined by the parameters
of the network used, the initial conditions of
the network and the characteristics of the input
data.
REFERENCES
Adnan, J. et al. 2017. “Multilayer Perceptron Based
Activation Function On Heart Abnormality Activity.”
Journal of Fundamental and Applied Sciences ISSN
9(3S):417–32.
Carrillo-Tudela, Carlos, Michael Graber, and Klaus
Waelde. 2017. “Unemployment and Vacancy Dynamics
with Imperfect Financial Markets.” Labour Economics
1–33. Retrieved
(http://dx.doi.org/10.1016/j.labeco.2017.04.005).
Castillo, Oscar, Juan R. Castro, Patricia Melin, and Antonio
Rodriguez-diaz. 2013. “Universal Approximation of a
Class of Interval Type-2 Fuzzy Neural Networks in
Nonlinear Identification.” Advances in Fuzzy Systems
1–16. Retrieved
(http://www.ncbi.nlm.nih.gov/pubmed/21383839).
Chiroma, Haruna, Sameem Abdulkareem, Adamu I.
Abubakar, and Tutut Herawan. 2014. “Kernel
Functions for the Support Vector Machine: Comparing
Performances on Crude Oil Price Data.” Advances in
Intelligent Systems and Computing 287:273–81.
Ehret, Anita, David Hochstuhl, Daniel Gianola, and Georg
Thaller. 2015. “Application of Neural Networks with
Nack-Propagation to Genome-Enabled Prediction of
Complex Traits in Holstein-Friesian and German
Fleckvieh Cattle.” Genetics Selection Evolution
47(22):1–9. Retrieved
(http://www.gsejournal.org/content/47/1/22).
Ertugrul, Omer Faruk. 2018. “A Novel Type of Activation
Function in Artificial Neural Networks: Trained
Activation Function.” Neural Networks 99:1–22.
Retrieved
(https://doi.org/10.1016/j.neunet.2018.01.007).
Fan, Jin Yan and Ya Xiang Yuan. 2005. “On the Quadratic
Convergence of the Levenberg-Marquardt Method
without Nonsingularity Assumption.” Computing
(Vienna/New York) 74(1):23–39.
Fan, Jinyan and Jianyu Pan. 2009. “A Note on the
Levenberg – Marquardt Parameter Q.” Applied
Mathematics and Computation 207(2):351–59.
Retrieved
(http://dx.doi.org/10.1016/j.amc.2008.10.056).
Hakim, R. B.Fajriya, Eka Novita Sari, and Tutut Herawan.
2014. “Soft Solution of Soft Set Theory for
Recommendation in Decision Making.” Advances in
Intelligent Systems and Computing 287:313–24.
Hamet, Pavel and Johanne Tremblay. 2017. “Artificial
Intelligence in Medicine.” Metabolism: Clinical and
Experimental 1–14. Retrieved
(http://dx.doi.org/10.1016/j.metabol.2017.01.011).
Hrasko, Rafael, André G. C. Pacheco, and Renato A.
Krohling. 2015. “Time Series Prediction Using
Restricted Boltzmann Machines and
Backpropagation.” Procedia Computer Science
55:990–99. Retrieved
(http://linkinghub.elsevier.com/retrieve/pii/S18770509
15015793).
Khanesar, Mojtaba Ahmadieh and Erdal Kayacan. 2013.
“Levenberg-Marquardt Training Method for Type-2
Fuzzy Neural Networks and Its Stability Analysis.”
IEEE International Conference on Fuzzy Systems 1–7.
Lasisi, Ayodele, Rozaida Ghazali, and Tutut Herawan.
2014. “Comparative Performance Analysis of Negative
Selection Algorithm with Immune and Classification
Algorithms.”
Advances in Intelligent Systems and
Computing 287:441–52. Retrieved
(http://link.springer.com/10.1007/978-3-319-07692-
8_42).
Levenberg, Kenneth. 1944. “A Method for the Solution of
Certain Non-Linear Problems in Least.” Quarterly of
Applied Mathematics 2(278):164–68. Retrieved
(http://www.ams.org/qam/1944-02-02/S0033-569X-
1944-10666-
0/%0Ahttp://www.ams.org/journals/qam/1944-02-
02/S0033-569X-1944-10666-0/S0033-569X-1944-
10666-0.pdf).
Marquardt, Donald W. 1963. “An Algorithm for Least-
Squares Estimation of Nonlinear Parameters.” Journal
of the Society for Industrial and Applied Mathematics
11(2):431–41. Retrieved
(http://epubs.siam.org/doi/10.1137/0111030).
Mishra, Akash, Pravin Chandra, Udayan Ghose, and Sartaj
Singh Sodhi. 2017. “Bi-Modal Derivative Adaptive
Activation Function Sigmoidal Feedforward Artificial
Neural Networks.” Applied Soft Computing Journal
61:1–27. Retrieved
(http://dx.doi.org/10.1016/j.asoc.2017.09.002).
Parveen, Nusrat, Sadaf Zaidi, and Mohammad Danish.
2017. “Development of SVR-Based Model and
Comparative Analysis with MLR and ANN Models for
Predicting The Sorption Capacity of Cr(VI).” Process
Safety and Environmental Protection 107(6):428–37.
Retrieved
(http://dx.doi.org/10.1016/j.psep.2017.03.007).
Putra Siregar, Sandy and Anjar Wanto. 2017. “Analysis
Accuracy of Artificial Neural Network Using
Backpropagation Algorithm In Predicting Process
(Forecasting).” International Journal Of Information
System & Technology 1(1):34–42.
Salimifard, Maryam and Ali Akbar Safavi. 2013.
“Nonlinear System Identification Based on a Novel
Adaptive Fuzzy Wavelet Neural Network.” Conference:
Electrical Engineering (ICEE) 1–5.
Sarabakha, Andriy, Nursultan Imanberdiyev, Erdal
Kayacan, Mojtaba Ahmadieh Khanesar, and Hani
Hagras. 2017. “Novel Levenberg–Marquardt Based
Levenberg-Marquardt Algorithm Combined with Bipolar Sigmoid Function to Measure Open Unemployment Rate in Indonesia
27

Learning Algorithm for Unmanned Aerial Vehicles.”
Information Sciences 1–32. Retrieved
(http://dx.doi.org/10.1016/j.ins.2017.07.020).
Sumijan, Agus Perdana Windarto, Abulwafa Muhammad,
and Budiharjo. 2016. “Implementation of Neural
Networks in Predicting the Understanding Level of
Students Subject.” International Journal of Software
Engineering and Its Applications 10(10):189–204.
Retrieved
(http://dx.doi.org/10.14257/ijseia.2016.10.10.18).
Tesfaselassie, Mewael F. and Maik H. Wolters. 2017. “The
Impact of Growth on Unemployment in a Low vs. a
High Inflation Environment.” Review of Economic
Dynamics (July):1–33. Retrieved
(http://dx.doi.org/10.1016/j.red.2017.07.005).
Wang, Zhen-Hua, Dian-Yao Gong, Xu Li, Guang-Tao Li,
and Dian-Hua Zhang. 2017. “Prediction of Bending
Force in The Hot Strip Rolling Process Using Artificial
Neural Network and Genetic Algorithm (ANN-GA).”
The International Journal of Advanced Manufacturing
Technology 1–14.
Wanto, A., M. Zarlis, Sawaluddin, and D. Hartama. 2017.
“Analysis of Artificial Neural Network
Backpropagation Using Conjugate Gradient Fletcher
Reeves in the Predicting Process.” Journal of Physics:
Conference Series 930(1):1–7.
Wanto, Anjar, Agus Perdana Windarto, Dedy Hartama, and
Iin Parlina. 2017. “Use of Binary Sigmoid Function
And Linear Identity In Artificial Neural Networks For
Forecasting Population Density.” International Journal
Of Information System & Technology 1(1):43–54.
Yamashita, N. and M. Fukushima. 2001. “On the Rate of
Convergence of Levenberg-Marquardt Method.”
Computing Supplementa 15:239–49.
Yunong Zhang and Ke Chen. 2008. “Comparison on Zhang
Neural Network and Gradient Neural Network for
Time-VaryingLinear Matrix Equation AXB = C
Solving.” 2008 IEEE International Conference on
Industrial Technology 1–6. Retrieved
(http://ieeexplore.ieee.org/lpdocs/epic03/wrapper.htm?
arnumber=4608579).
Zhang, Qiang, Xian ku Zhang, and Nam kyun Im. 2017.
“Ship Nonlinear-Feedback Course Keeping Algorithm
Based on MMG Model Driven by Bipolar Sigmoid
Function for Berthing.” International Journal of Naval
Architecture and Ocean Engineering 9(5):525–36.
Retrieved
(http://dx.doi.org/10.1016/j.ijnaoe.2017.01.004).
ICEST 2018 - 3rd International Conference of Computer, Environment, Agriculture, Social Science, Health Science, Engineering and
Technology
28
