
A Bio-inspired Auto-velocity Detection Algorithm for
Autonomous Robots
Erhard Gwerder and Hans Dermot Doran
Institute of Embedded Systems, Zürich University of Applied Science, Technikumstrasse 9, 8401 Winterthur, Switzerland
Keywords: Robotics, Photoreceptors, Visualization, Robot Vision, Biological System Modeling, Optical Sensors,
Autonomous Robots, Speed Sensor.
Abstract: As examples of computationally cheap and robust sensors the eyes of a fly are well known in literature.
Attempts to replicate the function of the eye in electronic technology has resulted in several algorithms and
implementations based on those algorithms. These implementations are either impractical for industrial use
or use costly Application Specific Integrated Circuits. In an attempt to use a low-cost Commercial off the
Shelf camera as a sensor in a real-world robot navigation use-case we investigate two commonly used
algorithms and find them unsuitable. We develop a new algorithm – the Distance of Travel algorithm – show
its suitability and investigate its properties in both simulation and practical experiments.
1 INTRODUCTION
A Motivation
Mobile robots working in semi-structured
environments co-habited with humans will need to
travel at variable speeds and trajectories and perform
collision avoidance including subsequent re-routing
should the chose path be blocked. In other words they
must be capable of (micro-) autonomous activity
within the scope of a defined mission (macro-activity)
within set deadlines. The body of work presented here
belongs firmly in the domain of bio-inspired
engineering where we seek to achieve lower
computational cost and higher robustness by the
emulation of biological examples as opposed to more
traditional state-space oriented engineering. We do
this in the knowledge that the performance of the robot
may not be as efficient as a state-space based design
and that work is required to make robot behaviour
predictable so that humans know when and how to
respond to an approaching robot.
The motivation for this body of work was to
explore the practical ramifications of using biological
precedence, the eye of a fly, in autonomous robots
designed for practical purposes – in this case delivery
along an office corridor. The fly eye has been well-
studied over the last sixty years and can boast multiple
implementations is thus well-understood and hence a
good example of a bio-inspired algorithm.
Much of the implementation work replicates the
fly eye in a low-pixel count ASIC (Application
Specific Integrated Circuit) and often in the context of
drones. Our understanding of the use-case includes
recognition of the fact that mobile robots will use a
camera not only to perform low level navigational
duties but also for high-level image processing tasks,
a scenario precluded by single-function ASIC-based
sensors. We are unaware of any fly-eye
implementations on low-cost COTS (Commercial off
the Shelf) camera so the novelty of our paper is
therefore to analyse and implement a fly-eye
algorithm on this class of platform.
Fly-eye algorithms can be categorised into four
general types which we analysed and found wanting
in various aspects. Response linearity at higher (robot)
velocities is a common factor so we developed,
simulated and implemented a new algorithm which we
called the Distance of Travel Algorithm. It can be
shown that the algorithm functions with better
linearity of response at lower sampling rates that the
reference algorithms and is better suited for use in the
use-case we are working towards.
This paper is structured accordingly. We finish this
section by discussing the related work, methodology
and algorithms. The next section describes the
simulation of standard algorithms we chose to
implement. Section III discusses the Distance of
56
Gwerder, E. and Doran, H.
A Bio-inspired Auto-velocity Detection Algorithm for Autonomous Robots.
DOI: 10.5220/0006430200560065
In Proceedings of the 14th International Conference on Informatics in Control, Automation and Robotics (ICINCO 2017) - Volume 2, pages 56-65
ISBN: Not Available
Copyright © 2017 by SCITEPRESS – Science and Technology Publications, Lda. All rights reserved
Travel (DoT) algorithm and simulations on it. Section
IV discusses the practical implementation of the DoT
algorithm and the final section draws conclusions and
proposes future work.
B Related Work
Scientists have been examining the perception and
navigation of insects in general and the fly in
particular, for some 60 years and this has led to much
work in replicating capabilities in technology. There
is a substantial body of literature, including summaries
to be found in this area of which Franceschini
(Franceschini, 2014) is a leading example. Literature
summarises the algorithms used in replicating the
vision system in technology (Sirnivasan, 1999) and
summaries of published work detailing future trends /
Orchard, 2014.) The field is divided into several
distinct strands of research. Biological research
generating replicable models was notably achieved by
Hassenstein and Reichardt (Hassenstein, 1961) with
their description of the Elementary Motion Detector
(EMD - Figure 1) and continued with various
elaborations or contrasting models such as the Barlow
and Levick model (1965) or the Watson and Ahumada
model (1985.) Engineering research has replicated
these models using a variety of algorithms, largely
using an analogue electronics approach. Initial work
in this area (Tanner, 1986) set the tone for a largely
analogue replication of the biological models
(Harrison, 1999), (Pant, 2004), and (Roubieu, 2013.)
However engineering research has been by and
large unable to look past the EMD and the attempt to
optimally replicate it has resulted in the attempt to
build neurological detectors (Higgins, 2000.) In
contrast there has been little work done to explicitly
apply the principles to CMOS detectors. Arreguit
(1996) builds of a pointing device on a CMOS chip
whereas Basch (2010, 2011) use of standard imagers
to build Hassenstein-Reichardt based collision
detectors stand out in an otherwise sparsely occupied
literature canon.
C Methodology
Current published (research) solutions use anywhere
from 8 to 254 pixels to build EMDs and it is perfectly
acceptable to predict that these devices are capable of
being industrialised at prices amenable to them
becoming a standard low-cost, low-complexity sensor
used in robot-construction.
Given that robot vision is still research-in-
progress, especially in the higher strata beyond object
recognition towards perception, it is also reasonable to
expect that CMOS-based vision systems will be
expected to provide the data to perform several tasks,
quite probably in parallel and possibly hardware off-
loaded to ASIC or Field Programmable Gate Arrays
(FPGA) devices. Auto-speed detection using a fly-eye
algorithm of low computational cost and promising
high robustness is a low-level task that can intuitively
be mapped to a CMOS camera. This idea is
strengthened by the fact that a CMOS camera can
deliver the data for 3D speed detection, something we
have not yet seen in ASICs produced by research.
From this background an appropriate methodology
would be to choose an algorithm to implement, prove
the use-case in software and measure the real-time
properties of the solution to decide whether hardware
offloading is necessary or beneficial.
D Algorithms
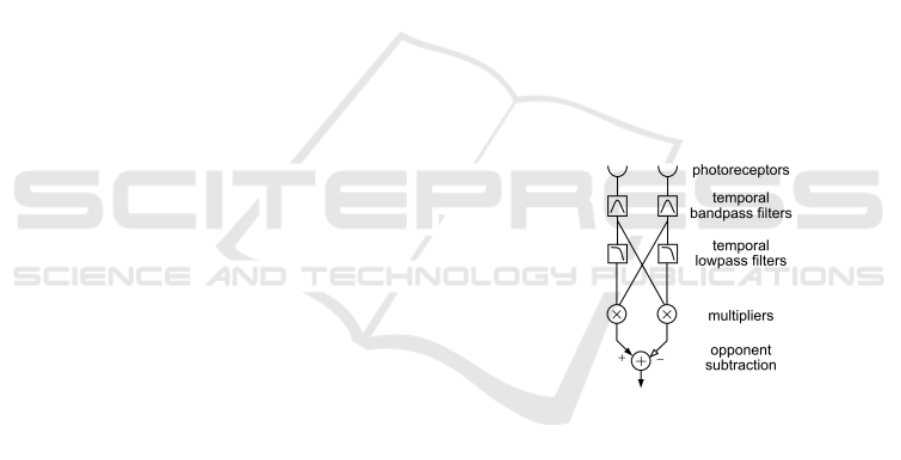
The EMD is a unidirectional unit that measures the
time taken from the detection of an intensity-
recognised feature by the first receptor to its detection
by the second receptor. This time represents a metric
for the speed of movement.
Figure 1: Elementary Motion Detector (EMD) according to
Harrison (Basch et al., 2011).
The mechanisms whereby this is achieved in flies
and modelled for replication in technology have been
extensively researched to the extent that the technical
implementations (Floreano, 2009) have been divided
into two methodologies of each two categories (Figure
2.) The methodologies are intensity based and token
based and subdivided into categories of gradient and
correlation methodologies and the correlation and
time-of-travel based methodologies respectively.
We place value on low computational and resource
expense and used this as the primary criteria
A Bio-inspired Auto-velocity Detection Algorithm for Autonomous Robots
57
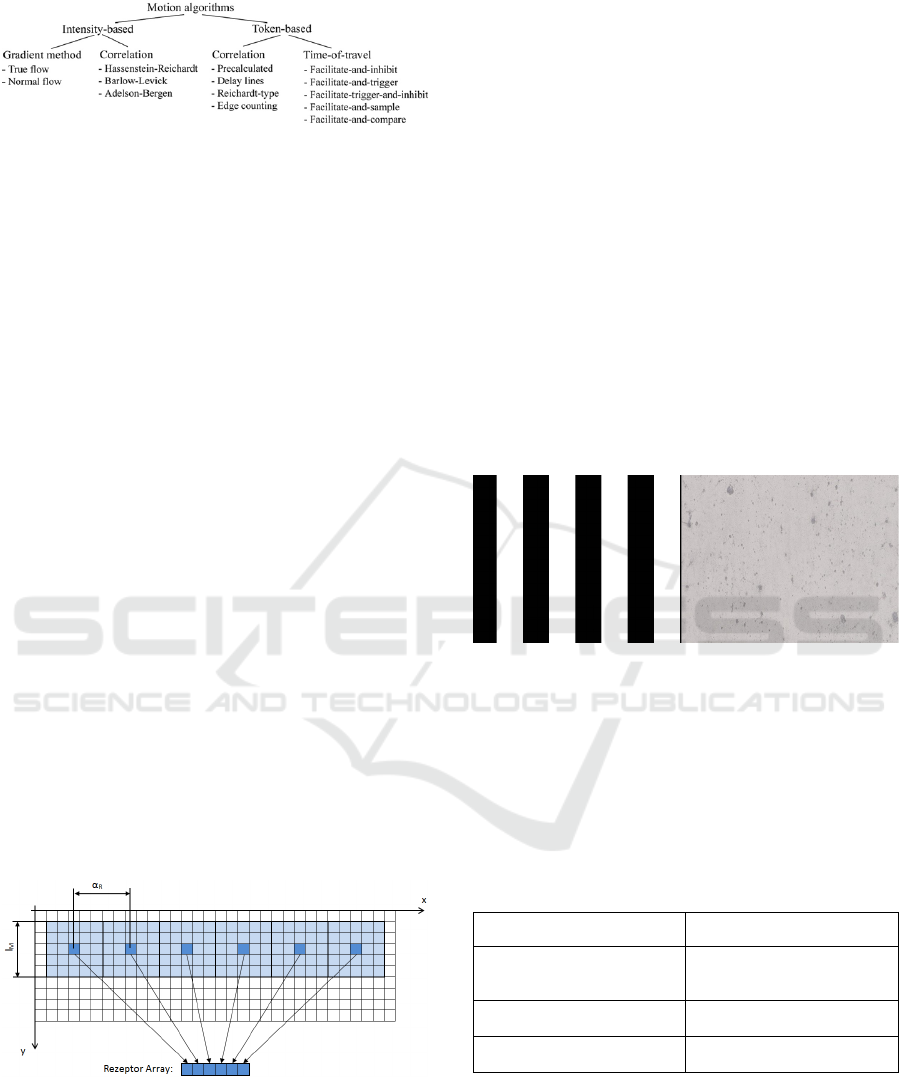
Figure 2: Categorisation of fly-eye based navigation
algorithms (Barlow and Levick, 1965).
for examining the different algorithms. The gradient
methodology was deemed to be computationally
expensive whereas the published correlation/token-
based methodologies require substantial memory
resources and so were also excluded from further
consideration. We chose the publications from
Harrison and Koch (1999) who applied intensity based
correlation using the Hassenstein-Reichardt principle
and from Roubieu et al., (2013) who applied token
based methods, as the most promising role-models and
used them in further evaluation.
2 SIMULATION OF KNOWN
ALGORITHMS
Further evaluation consisted of implementing and
performing tests on these two algorithms in Matlab.
We applied the general motion detection model, the
EMD defined as two photoreceptors, as the input
source. The outputs of the algorithms are based on the
response measured between two photoreceptors –
with a preferred direction. The optical space covered
by a single photoreceptor is generally quite large so
in the simulations these receptors are assembled from
a number of pixels of the image/camera as shown in
Figure 3 where a receptor was made up of an averaged
5*5 array of pixels.
Figure 3: Assembling receptors from camera pixels.
Testing real-time response of vision-algorithms is
difficult at the best of times and generally achieved
by using patterns of some sort. Regular patterns such
as square waves (black and white bars) and sinusoidal
(white to black via a grey scale) are commonly used
and are useful for matching actual to predicted
behaviour. For our use-case the material used for
walls must also be considered so several different
patterns were used. Results shown in this paper are
generally derived from black-white vertical bars
(square wave) and a randomly chosen concrete
pattern (Figure 4,) which represents a stochastic
signal.
We tested the algorithms by passing the patterns
in front of the receptors at a number of constant
velocities. To achieve this a script was programmed
to produce 500 copies of a test pattern with each copy
differing from the previous by a shift equivalent to the
velocity the receptor is intended to be subjected to. By
passing these pattern sequences at discrete intervals
in front of the receptors – and allowing the algorithm
to perform after being exposed to one shifted image –
the speed of passing a pattern could be precisely
simulated free of any real-time and computing-time
restraints imposed by the test platform.
Figure 4: Black and white (left) and concrete (right) patterns
for simulation of tokens.
A Hassenstein – Reichardt Detection
For the Hassenstein-Reichardt detector the
configuration of the fly-eye assembled from camera
pixels was determined as follows:
Table 1: Fly-Eye Parameters for the Hassenstein-Reichardt
detector.
Parameter Value
Distance between
receptors (α
r
)
4°
Mask Size
43 Pixels
Number of receptors
12 Receptors
After implementation in Matlab the first
simulation was carried through with a sample time of
20 ms and it can be seen that good linear response of
estimated velocity can be achieved up to an actual
velocity of about 3 rad/s when the measured and
actual velocities diverge (Figure 5.) This simulation
was repeated at the faster sampling rate of 5 ms
ICINCO 2017 - 14th International Conference on Informatics in Control, Automation and Robotics
58
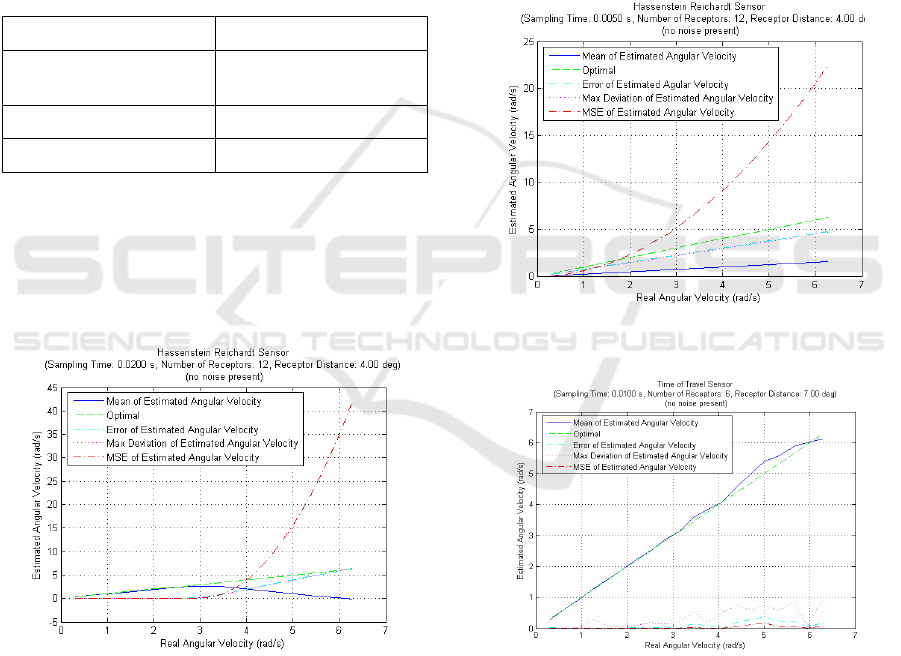
(Figure 6) and the linearity of the response to the
actual velocity is considerably better. Low cost
cameras generally deliver images at frame rates of up
to 60 fps, equivalent to a sampling rate of 16 ms, so
we surmise the Hassenstein-Richardt does not appear
to be suited for implementation on such a camera.
B Time of Travel Algorithm
The same procedure was repeated for the time of
travel algorithm (ToT) proposed by Roubieu (2013.)
The parameters for this simulation were set at the
values given in Table 2.
Table 2: Fly-Eye Parameters for the Time of Travel
detector.
Parameter Value
Distance between
receptors (α
r
)
7°
Mask Size
77 Pixels
Number of receptors
6 Receptors
In (Figure 7) and (Figure 8) the results of
sampling rate of 10 and 20 ms are shown. As with the
Hassenstein-Richardt algorithm the linearity of the
response of the algorithm to the actual velocity
suffers at higher velocities, dramatically so at
velocities over ~3 rad/s and sampling rates of 20 m/s.
Figure 5: Performance of the Hassenstein-Richardt
algorithm simulation at sampling rates of 50 Hz.
C Conclusion
Clearly the linearity is unsatisfying for low sampling
rates at higher velocities which convinced us that
investigation of a new algorithm better suited to the
use case of a low-cost camera would be justified.
3 DISTANCE OF TRAVEL
ALGORITHM AND
SIMULATION RESULTS
A Distance of Travel Algorithm
We therefore propose a new algorithm which we call
Distance of Travel (DoT) which bears close
relationship to the time of travel algorithm. We
actually break the concept of the EMD by extending
the detection of tokens across the entire line of
photoreceptors, and in principle across the entire line-
width of the camera and treat the camera pixels as a
coherent array.
Figure 6: Performance of the Hassenstein-Richardt
algorithm simulation at sampling rates of 200 Hz.
Figure 7: Performance of the Time of Travel Algorithm at
sampling rates of 100 Hz.
The sampling time can be reduced by decreasing
the distance between receptors but simultaneously
retaining the precision of measurement as the
algorithm measures the number of receptors the token
traverses during a set sample time. The
algorithm’s principle of operation is shown in Figure
9 below.
A Bio-inspired Auto-velocity Detection Algorithm for Autonomous Robots
59
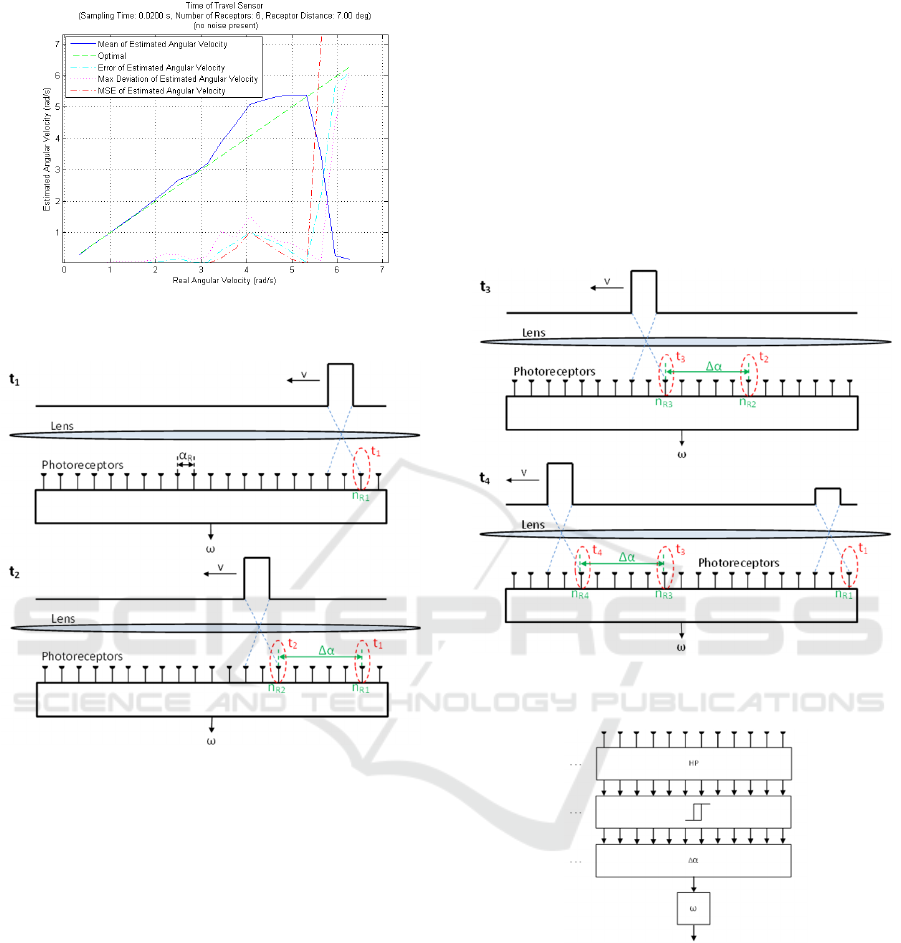
Figure 8: Performance of the Time of Travel algorithm at
sampling rates of 50 Hz.
Figure 9: Principle of operation: Distance of Travel
Algorithm.
From right to left, at t
1
a token is detected at the
second receptor, at t
2
the seventh receptor detects the
same token. From the travelled distance the angular
velocity can be calculated using (1.)
ω = Δα/Δt = (η
R2
- η
R1
) • α
R
/ (t
2
– t
1
) (1)
The measured value may be refined by repeated
detections of the (same) token across the
pixels/receptors. Once the token reaches near the end
of the pixel/receptor array the algorithm stops seeking
another detection and returns to the beginning of the
pixel/receptor array to search for a new token. If there
is a new token the algorithm will be able to produce a
stream of measurement values (Figure 10.)
The receptor’s macro-construction is similar to
classical elementary motion detectors and function as
shown in Figure 11: A high pass filter (HP) eliminates
offset components and heightens contrast. The next
block applies an intensity hysteresis. The
determination of this hysteresis level was not without
difficulty. If the value is too high a value then low
contrast tokens won’t be detected. If the level is too
low the SNR degrades. For this reason we propose a
method adaptive to the signal strength of the
receptors. If a new token has been detected then,
using the first 2/3 of the receptors (r), a minimum and
maximum value is found and from this a high and low
threshold value (T
min
, T
max
) calculated according to
(2) and (3.)
Figure 10: Principle of operation: Distance of Travel
Algorithm - case of token leaving field of vision.
Figure 11: Architecture of threshold detection.
T
min
= min(r
si-
j
) + min(r
si-
j
) / 5 (2)
T
max
= max(r
si-
j
) + max(r
si-
j
) / 5 (3)
B Simulation Results
The Distance of Travel implementation was exposed
to the same simulation benchmarks as the other
algorithms. In this case the receptors were built from
an empirically determined 5x5 pixel mask with one
overlapping column of pixels with the neighbouring
ICINCO 2017 - 14th International Conference on Informatics in Control, Automation and Robotics
60
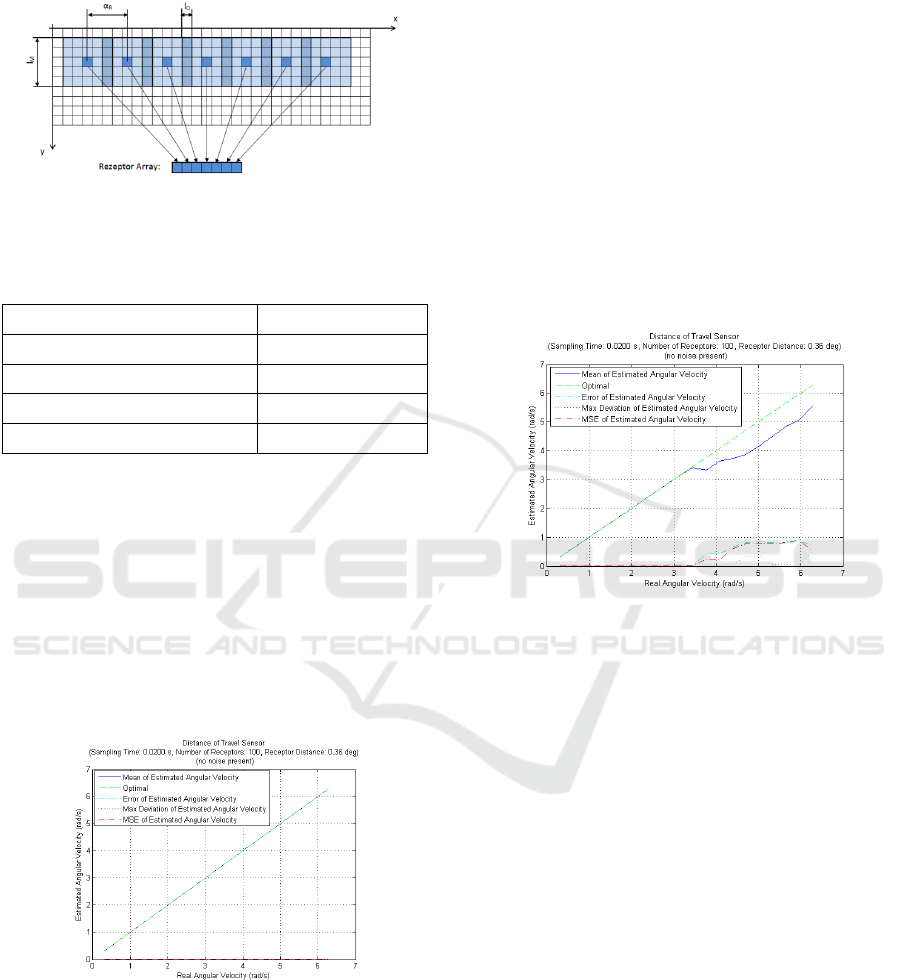
receptor (Figure 12.) Table 3 shows the parameters
which were used for the simulations.
Figure 12 Assembling receptors from camera pixels for the
Distance of Travel Algorithm.
Table 3: Fly-Eye Parameters for the Distance of Travel
detector.
Parameter Value
Distance between receptors (α
r
) 0.36 °
Receptor size 5 * 5
Receptor Overlap 1 * 5
Number of Receptors 100
The first test was to trigger the algorithm with a
simulation pattern at a constant angular velocity of
0.63 rad/s. and the results proved encouraging. Unlike
the Hassenstein-Reichardt or ToT detectors the
measured velocity exhibited no oscillations. The
velocity was then varied to produce a set of
measurements, analogous to Figure 5– Figure 8, the
results of which are replicated in Figure 13. The
linearity is far better across the entire test range, at
sampling times of 20 ms, than both the Hassenstein-
Richardt and time of travel algorithms.
Figure 13: Performance of the Distance of Travel
Algorithm simulation at sampling rates of 50 Hz.
The algorithm was further examined, also using
different test patterns, specifically wood, brick and
concrete (Figure 4.) Good results were achieved with
the first two only on the concrete pattern did the
linearity of the detector degrade at angular velocity
above 3.5 rad/s (Figure 14).
4 DISTANCE OF TRAVEL
ALGORITHM
IMPLEMENTATION AND
TESTS
A Implementation
We considered the principle of the algorithm to be
confirmed by these simulations and implemented the
algorithm on the low-cost, COTS, leanXcam from
SCS. This camera, is based on a 1/3” CMOS colour
sensor and features a 500MHz Blackfin under
uClinux, Unfortunately camera production has now
been discontinued but the data sheet is still available
(SCS 2016.)
Figure 14: Performance of the Distance of Travel algorithm
simulation at sampling rates of 50 Hz. and using the
concrete pattern.
The implementation top-level code runs in an
endless loop with both the run time of the software
and the image capturing/transfer time determining the
(real-time) timing characteristics. This allowed us to
measure the run-time of the tasks and algorithms and
determine whether further optimisations were
necessary to ensure the system was capable of
processing an adequate frame rate. The code flow is
shown in Figure 15.
The camera chip is polled, using code supplied as
libraries with the camera, in order to detect whether a
new image is available and proceeds to further
processing if this is the case. Set-up of parameters is
achieved via an implemented web-interface, exposure
time and max/min speeds for the search window are,
amongst others, parameters that can be set. The
velocity value output is via a simple printf on the
camera’s Ethernet console output.
The image processing (block “Processing Image”
in Figure 15) is depicted in Figure 16.
The implementation, in contrast to the Matlab
simulations, performs an intensity check exiting with
A Bio-inspired Auto-velocity Detection Algorithm for Autonomous Robots
61
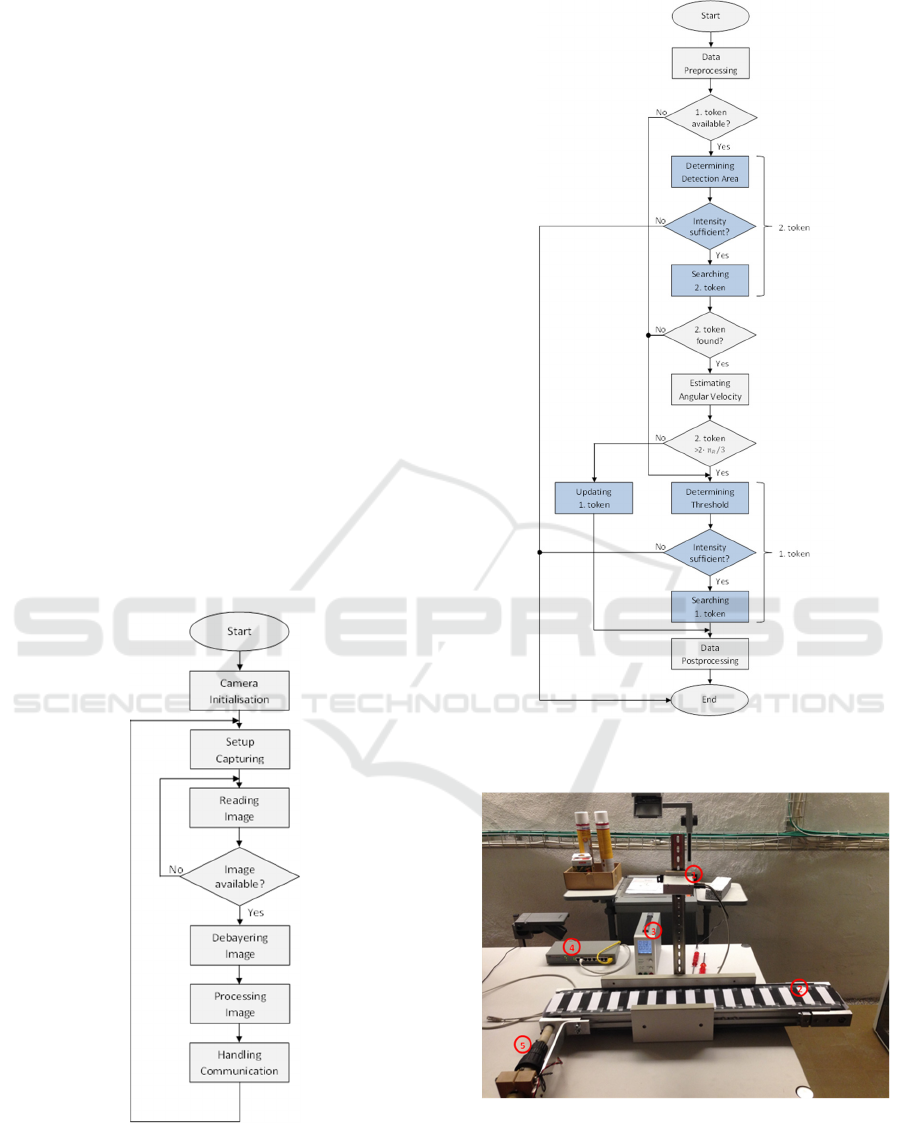
an appropriate return value if the intensity is not
sufficient to detect a token. If there is sufficient
intensity then the code searches for a second instance
of the token under the assumption that a first instance
is already available. If this is found then the angular
velocity can be calculated. Should a first instance not
be available, then it branches and searches for a first
token – which will be the case when f.i. the system
comes out of reset.
B Measurements
In order to get a direct correlation between the
simulation and the implementation it was desirable to
use exactly the same patterns in both environments. It
might have been possible to run the test images on a
computer screen but the PC screen generates light as
opposed to reflecting it and it is difficult to ensure that
a standard PC adheres to the real-time constraints
necessary to ensure a constant streaming of images at
the required rate/velocity. For this reason a test-jig
based around a conveyer belt was built (Figure 17.)
The images previously generated were printed and
stuck onto the conveyer belt (black and white image
on the conveyer belt in Figure 17) and the speed of
the conveyer belt could be adjusted.
Figure 15: Flow Chart for the General Operation of the Fly-
Eye Camera.
Figure 16: Flow Chart for the operation of the Distance of
Travel Algorithm Implementation on the LeanXCam.
Figure 17: Picture of test-jig.
The schematic in Figure 18 shows the jig
parameters used in the tests and in most of the tests
the parameters noted in Table 4 were used.
ICINCO 2017 - 14th International Conference on Informatics in Control, Automation and Robotics
62
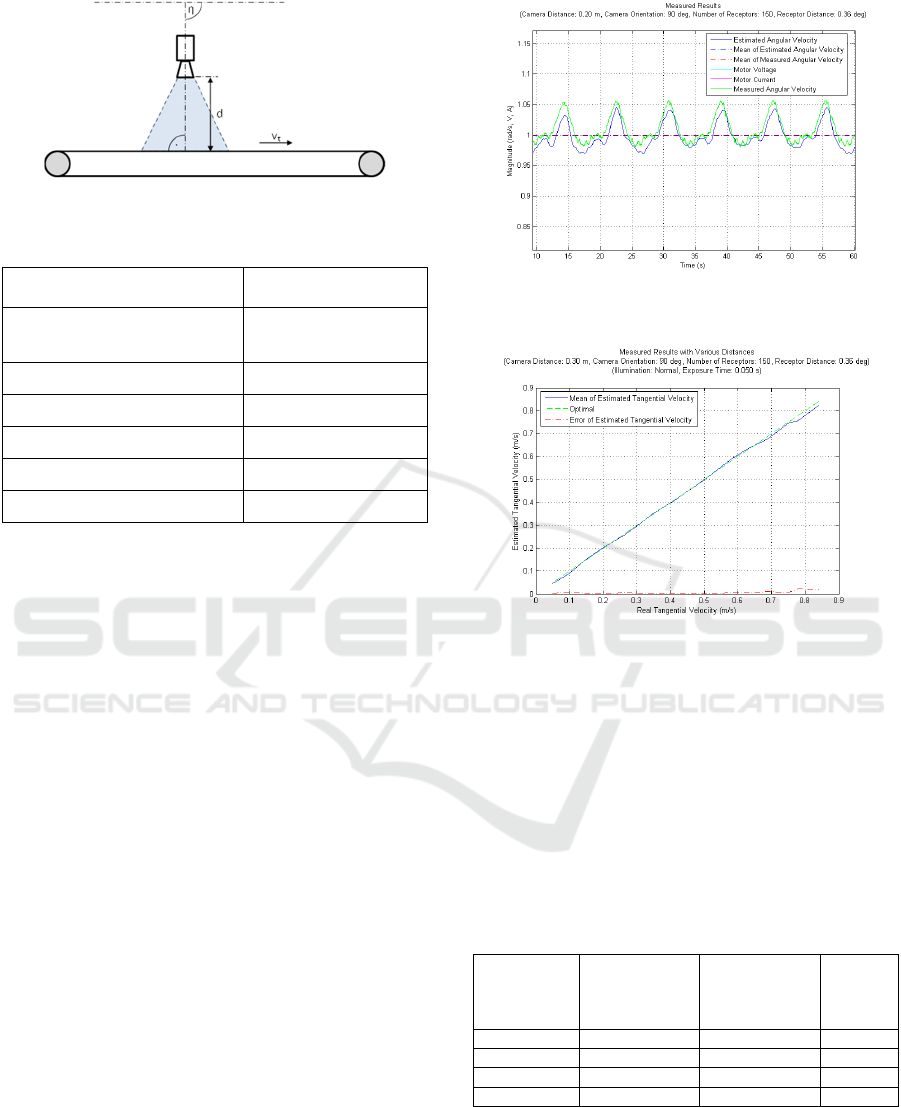
Figure 18: Schematic of test jig.
Table 4: Parameter Settings of Test-Jig.
Parameter Value
Distance camera to the belt
(d)
0.2 m
Angle of Camera to belt (η)
90°
Velocity of belt (vt)
0.2 – 0.8 m/s
Illumination
room
Illumination time
0.05 s
Test pattern
black/white stripe
The first results received a mixed reception.
Encouraging was the closeness of velocity
measurement to that of the belt but substantial
oscillations were also visible in the output of the DoT
sensor. Further investigation resulted in an attempt to
provide the motor with better gears as it appeared that
the motor wasn’t rotating at constant speed. That
brought no resolution but it was noticed that the motor
was periodically sticking. A test run where the motor
current and voltage were also measured, albeit not
synchronised with the conveyer-belt or DoT/camera
sensor, was made. The motor voltage and current
subsequently graphed against the velocity measured
by the DoT implementation is shown in Figure 19.
The estimated angular velocity tracks the “stickiness”
of the motor/belt, as measured by motor
voltage/current, very well and we consider this to be
a sign of the quality of the DoT algorithm and its
implementation.
Evidenced by further test runs with the belt
moving at different velocities and the camera
mounted at distance of 0.3 meters from the belt, the
DoT algorithm shows an excellent correlation
between expected and measured velocity albeit, there
is a deviation observable at speeds greater 0.75 m/s
which requires further investigation. Unfortunately a
different test-jig is required as the maximum velocity
of the conveyer belt is 0.85 m/s.
Figure 19: Correlation of Distance of Travel algorithm with
motor current.
Figure 20: Performance of the Distance of Travel algorithm
implementation at sampling rates of 50 Hz. and using the
stripes pattern.
1) Wall Pattern
The DoT algorithm depends on contrast changes in its
line of sight to determine velocity. As in the
simulations several other patterns were taped onto the
conveyer belt and the velocity measured, the results
being shown in Table 5.
Table 5: Measurement error of Distance of Travel
implementation using various test patterns.
Test Pattern Average
measured
angular
velocity (rad/s)
Average
estimated
angular
velocity (rad/s)
Error %
Stripes 0.67 0.66 1.5
Brick 0.67 0.73 9.0
Concrete 0.67 0.72 7.5
Wood 0.67 0.74 10.5
2) Camera Orientation
The use case is a mobile robot moving in a straight
line down a corridor under closed loop control with
the output of this algorithm/sensor as an input value.
A Bio-inspired Auto-velocity Detection Algorithm for Autonomous Robots
63
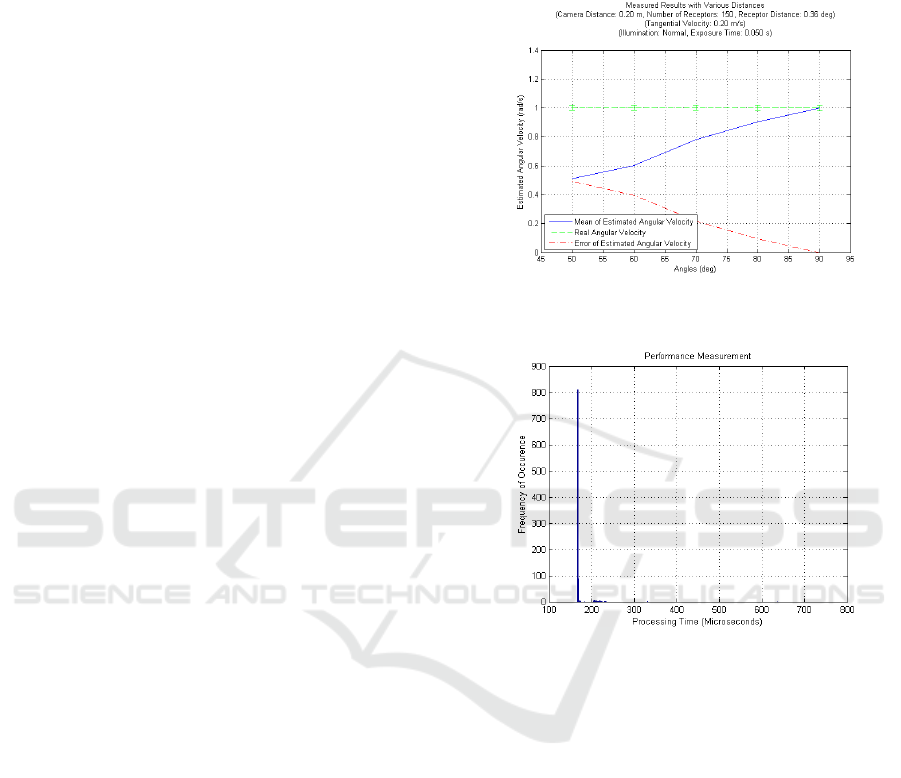
The robot is bound to turn appreciably towards and
from the wall so the angle of the camera to the wall
will change and thus the measured angular velocity.
The effect of camera rotation on the measured
velocity can be seen in Figure 21.
3) Real-Time Constraints
We assume that images will be streamed at a constant
rate from the CPTS camera so algorithm code must
adhere to real-time deadlines. We measured the time
for the algorithm to determine velocity on a per
captured frame basis over a time period of 60 seconds
for which an average CPU time of 171 μs was
determined (Figure 22.) The operating system
interfering with the execution of the tasks is
responsible for the peaks seen > 200 μs. The
measurement was repeated for the de-Bayering
algorithm and an average of 514 μs was determined
for the execution time.
5 CONCLUSION, DISCUSSION
AND FURTHER WORK
A Conclusion
We have shown by simulation that current
implementations of the fly-eye algorithm for auto-
velocity detection are unsuitable for implementation on
low-cost commercially available cameras. This is
largely due to the fact that the usual technical
construction of the elementary motion detector is such
that sampling times higher than that deliverable by
these cameras are required for accurate measurement.
We have proposed a new algorithm, called the
Distance of Travel algorithm, which is suitable for
implementation on low-cost commercial cameras
operating at low sampling rates. We showed that the
algorithm exhibits better linearity at high angular
velocities than two well-established algorithms and has
potential for real-world application. We implemented
this algorithm and showed through tests that the
promise shown through simulation is reflected in real-
world measurements. The real-time characteristics of
the implementation are also attractive.
B Discussion
The Distance of Travel algorithm was also examined
with the explicit aim of enabling a robot to orientate
and navigate down a corridor and hence both regular
(square wave) and irregular real-world patterns, brick
and concrete, were used during tests.
Whilst the results are good, as the figures for the
square-wave patterns show, some of the simulation
results can not be reproduced in the real-world.
Figure 21: Performance of the Distance of Travel algorithm
implementation at different camera angles.
Figure 22: Processing time distribution Distance of Travel
implementation.
In the case of concrete up to 7.5% error can be
observed in the velocity range tested. Further work is
required to understand and evaluate these
discrepancies. In the real-world it cannot be expected
that regular patterns will be painted on walls to help
mobile robots with their orientation so the algorithms
used need to be robust to variations in wall patterns.
We don’t expect a bio-inspired robot, or one using
bio-inspired sensors, to drive a perfectly parallel to a
corridor wall so we must get some feeling for how
much the robot will oscillate around the line of
direction and, of course, whether this is acceptable in
a real-world environment.
In the case of the concrete pattern, a stochastic
pattern that we can find in our own institutional
buildings, we observe an error of ~7.5%, we don’t
know whether this is acceptable in a real world case.
Neither do we know what the minimum pattern is
necessary for a wall to have so that an acceptable
ICINCO 2017 - 14th International Conference on Informatics in Control, Automation and Robotics
64

robot trajectory emerges. These are all issues for
further research.
C Further Work
The first focus for further research is mounting the
camera(s) on a mobile robot and allowing it to drive
semi-autonomously down a corridor at speeds of up
to 1 m/s. The final aim is for the robot to liaise with
“pheromone” carrying RFID tags placed at discrete
and longer intervals in the corridor as described by
Doran (2011.) This body of work will include
investigating an extension of the algorithm for the 2D
case and whether and how the robot should be
allowed to move in reverse. General robustness is also
an issue.
The suitability for offloading the algorithm into an
FPGA is also to be examined as we believe that the
combination camera, CPU and FPGA – as opposed to
the use of GPUs - to be the most cost efficient for
mobile robotics. This idea is supported by the
increasing number of SoC FPGA devices with multi-
(hard) cores being offered on the market. A second
reason is that Lichtensteiger (2004) showed that an
optimal fly-eye facet pattern (i.e physical
arrangement and size of photoreceptors) could be
derived for specific tasks. By using a learning
algorithm Lichtensteiger generated one pattern for
navigation along a wall and a second one for
optimised obstacle detection, both in the direction of
travel. By streaming images through an FPGA it is
possible to apply the facet principle multiple times,
like a filter, on different physical locations of the
image. It should therefore be possible to generate
hybrid fly-eyes that achieve different aims at very low
computation expense. Work is needed to show the
viability of this approach.
ACKNOWLEDGMENTS
Thanks are due to Erich Ruff of InES for his kind
support in building the measurement and test systems.
REFERENCES
X. Arreguit, F. A. Van Schaik, F. V. Bauduin, M. Bidiville,
and E. Raeber, 1996 ‘‘A CMOS motion detector system
for pointing devices,’’ IEEE J. Solid-State Circuits, vol.
31, no. 12, pp. 1916–1921, Dec. 1996.
H. B. Barlow and W. R. Levick, 1965 ‘‘The mechanism of
directionally selective units in rabbit’s retina,’’ J.
Physiol., vol. 178, no. 3, p. 477, 1965.
M. E. Basch, D.G. Cristea, V. Tiponuţ, and T. Slavici. 2010
“Elaborated motion detector based on Hassenstein-
Reichardt correlator model”. In Proceedings of the 14th
WSEAS international conference on Systems:Vol. I.
(WSEAS), Stevens Point, Wisconsin, USA, 192-195.
2010.
M. H. Basch, D.G. Cristea, R.I. Lõrincz, and V. Tiponut.
2011 “A bio-inspired obstacle avoidance system
concept for visually impaired people”. Proceedings of
the 15th WSEAS international conference on Systems,
World Scientific and Engineering Academy and Society
(WSEAS), Stevens Point, Wisconsin, USA, 288-297.
2011
H. Doran, 2011 “Towards A Common Understanding Of
The Digital Pheromone.” In Proceedings of the 8th
International Conference on Informatics in Control,
Automation and Robotics, pages 176-181, July 2011.
D. Floreano et al., 2009 Flying Insects and Robots. Berlin,
Heidelberg: Springer-Verlag, pp. 101 -114, 2009.
N. Franceschini, 2014 "Small Brains, Smart Machines:
From Fly Vision to Robot Vision and Back Again," in
Proceedings of the IEEE, vol. 102, no. 5, pp. 751-781,
May 2014.
R. R. Harrison and C. Koch, 1999 ”A Robust Analog VLSI
Motion Sensor Based on the Visual System of the Fly,”
Autonomous Robots 7, pp. 211 - 224, 1999.
C. M. Higgins and C. Koch, 2000 ‘‘A modular multi-chip
neuromorphic architecture for real-time visual motion
processing,’’ Analog Integr. Circuits Signal Process.,
vol. 24, no. 3, pp. 195–211, 2000.
L. Lichtsteiger, 2004 ”Bodies That Think Quickly and
Learn Fast: On the Interdependence of Morphology and
Control for Intelligent Behavior,” PhD Thesis,
University of Zurich, Switzerland, 2004
G. Orchard and R. Etienne-Cummings, 2014 "Bioinspired
Visual Motion Estimation," in Proceedings of the
IEEE, vol. 102, no. 10, pp. 1520-1536, Oct. 2014.
V. Pant and C. M. Higgins, 2004 ‘‘A biomimetic VLSI
architecture for small target tracking. In Circuits and
Systems,’’ in Proc. Int. Symp. Circuits Syst., May 2004,
vol. 3, pp. 5–8.
W. Reichardt, 1961 ‘‘Autocorrelation, a principle for the
evaluation of sensory information by the central
nervous system,’’ Sensory Communication.
Cambridge, MA, USA: MIT Press, 1961, pp. 303-317.
F. L. Roubieu et al., 2013 ”Two-Directional 1-g Visual
Motion Sensor Inspired by the Fly’s Eye,” IEEE
Sensors Journal, Vol. 13, Issue 3, pp. 1025 - 1035,
2013.
SCS, 2016 https://www.scs.ch/fileadmin/images/leanX
cam/SCS_leanXcam_Datasheet_D.pdf, Last accessed
01.03.2016
M. V. Sirnivasan et al., 1999 ”Motion detection in insect
orientation and navigation,” Vision Research 39, pp.
2749–2766, 1999.
J. E. Tanner, 1986 ‘‘Integrated optical motion detection, ’’
Ph.D. dissertation, Eng. Appl. Sci., California Inst.
Technol., Pasadena, CA, USA, 1986.
A. B. Watson and A. J. Ahumada, Jr., 1985 ‘‘Model of
human visual-motion sensing,’’ J. Opt. Soc. Amer. A,
vol. 2, no. 2, pp. 322–341, 1985.
A Bio-inspired Auto-velocity Detection Algorithm for Autonomous Robots
65
