
Learning Analytics: A Way to Monitoring and Improving Students'
Learning
Jose Manuel Azevedo
1
, Cristina Torres
2
, Ana Paula Lopes
1
and Lurdes Babo
2
1
Polytechnic of Porto (P.PORTO) / ISCAP (PORTUGAL) and CEOS.PP, Rua Jaime Lopes de Amorim, Porto, Portugal
2
Polytechnic of Porto (P.PORTO) / ISCAP (PORTUGAL), Rua Jaime Lopes de Amorim, Porto, Portugal
Keywords: Learning Analytics, Google Analytics, Moodle, Mathematics, Higher Education, Student Engagement,
Course Dedication.
Abstract: This paper focus on the potential contributes of Learning Analytics in the improvement students learning. The
analysis of student’s data collected from Virtual Learning Environments is important to ascertain student’s
engagement. This paper presents the analysis of data collected in the ambit of MatActiva project. Data was
analysed with Google Analytics, Course Dedication and Moodle Reports. Promising results were obtained.
1 INTRODUCTION
Virtual Learning Environments (VLE) are widely
used in all degrees of teaching. A huge number of
educators find that VLE can improve the teaching
process. Especially in large universities courses VLE
can reach a great amount of students in different
geographical areas. It is undeniable that the number
of resources increased sharply but, as pointed out
Dyckhoff et al. (2012), the use of VLE by itself does
not improve the teaching process and today the
challenge is to create more motivating and engaging
learning materials and activities.
After preparing and providing online materials, it
is crucial to assess changing student’s behaviours and
performances.
The enormous quantity of data produced
surrounding the interactions in VLE provides the
basis material to a new research field, called Learning
Analytics, that has emerged in the last years. The
focus of interest is how this data can be used to
improve teaching and learning (Greller and Ebner,
2014).
In this paper it is intended to analyse the
MatActiva Moodle site, in order to check students’
engagement in several courses, since this is a relevant
issue in the project.
This paper is structured in the following way: in
section 2 we define Learning Analytics concept and
some tools used in this paper are summarized.
Section 3 describes the profile of MatActiva site,
in section 4 we present some questions driving the
research focus in this paper. Data collection is
exhibited and data analysed throughout section 5.
Section 6 draws conclusions based on the research,
and in the 7 and last section, we try to pull together
some of the key points made in previous sections.
2 LEARNING ANALYTICS
In any new research area many new terms introduced
must be clarified in order to achieve greater
understanding and therefore a better
contextualization of the problem.
In the literature there is some confusion between
the concepts of Learning Analytics (LA) and
Academic Analytics (AA) (Sclater, Peasgood and
Mullan, 2016). These terms are commonly used but
without clarity as to what the words are intended to
mean. LA focus on the learning process whereas AA
reflects the role of data analysis at an institutional
level (Long and Siemens, 2014). To better clarify this
difference, Siemens and Long (2011) present some
details and a comprehensive list comparing LA and
AA (Table 1).
According to the Society for Learning Analytics
Research (SoLAR - www.solaresearch.org),
“learning analytics is the measurement, collection,
analysis, and reporting of data about learners and their
contexts, for the purpose of understanding and
Azevedo, J., Torres, C., Lopes, A. and Babo, L.
Learning Analytics: A Way to Monitoring and Improving Students’ Learning.
DOI: 10.5220/0006390106410648
In Proceedings of the 9th International Conference on Computer Supported Education (CSEDU 2017) - Volume 1, pages 641-648
ISBN: 978-989-758-239-4
Copyright © 2017 by SCITEPRESS – Science and Technology Publications, Lda. All rights reserved
641
optimizing learning and the environments in which it
occurs”. This definition appeared in 2011 in the 1
st
International Conference on Learning Analytics &
Knowledge (LAK). Similarly Harmelen and
Workman (2012, p. 34) define Learning Analytics as
”the application of analytic techniques to analyse
educational data, including data about learner and
teacher activities, to identify patterns of behaviour
and provide actionable information to improve
learning and learning-related activities”. According
to these authors the first use of analytics in education
goes back to 1995 in a study that examined student
retention and performance. However, it appears that
widespread interest in analytics has only been
increasing since 2007 (Harmelen and Workman,
2012).
Table 1: Differences between Learning Analytics and
Academic Analytics and the respective beneficiaries
(Siemens and Long (2011)).
TYPE OF
ANALYTICS
LEVEL OR OBJECT
OF ANALYSIS
WHO
BENEFITS?
Learning
Analytics
Course-level: social
networks, conceptual
development,
discourse analysis,
"intelligent
curriculum"
Learners,
faculty
Departmental:
predictive modelling,
patterns of
success/failure
Learners,
faculty
Academic
Analytics
Institutional: learner
profiles, performance
of academics,
Knowledge flow
Administrators,
funders,
marketing
Regional
(state/provincial):
comparisons between
systems
Funders,
administrators
National and
International
National
governments,
educational
authorities
Siemens (2012) highlights the potential of LA to
dramatically impact the existing models of education
and to generate new insights into what works and
what does not work in teaching and learning.
ECAR (2015) strengthens this idea saying that LA
allows to move into an era where we can predict
student learning outcomes leading us to the concept
of predictive learning analytics. In US there are
several published results supporting the educational
success, in quite a lot of Higher Education Institutions
(HEI), either private or public. This source first
presented in a Panel by Norris and Baer (2012) and
after in EDUCAUSE online (2013) with a complete
report about 58 pages by the same authors.
With LA we can see which resources are more
often used and if offering documents/tests and other
related topics could be interesting for students
(Recker, Walker and Lawless, 2003; Bourkoukou et
al., 2016). We also could provide courses that match
the learning style of learners and “Several educational
theories and studies agree that learners learn easier
when their learning styles match with the teaching
style” (Graf et al., 2009, p. 1280).
Beside the above information, it is important to
know what the goals are, when using LA. Davenport,
Harris and Morison (2010) suggest that we have to
answer some questions, presented in Table 2.
Table 2: Questions that the research using Analytics would
answer.
Past Present Future
Information
What
happened?
What is
happening
now?
What will
happen?
Insight
How and
why did it
happen?
What’s the
next best
action?
What’s the
best/worst that
can happen?
2.1 Google Analytics
Google Analytics (GA) is a tracking application
offered by Google that tracks and reports website’s
traffic. It started in 2005 (Hasan, Morris and Probets,
2009) and the first studies that used is focused on the
analysis of e-commerce sites. This application
generates statistics about the visits and the user
interactions and allows users to export report data in
to MS Excel© format. Most of the data in GA, that
we analyse, are number of sessions and Average
Sessions. A “session” is a group of interactions that
take place on your website within a given time frame
and an “Average session duration” is the total
duration of all sessions (in seconds) divided by the
number of sessions (support.google.com/analytics/).
In GA and with some adaptions for an Educational
Website, there are some questions suggested to
explore such us: “Which pages do people visit?”,
“How does this change with date and time?”, “Where
do visitors come from geographically?” and “Is my
site user-friendly?”
A2E 2017 - Special Session on Analytics in Educational Environments
642

2.2 Moodle Reports
Moodle, especially in the last versions, has a lot of
reports and statistics that can substitute in some
aspects Google Analytics. There are many reports
that could be obtained, but in this work we emphasise
the following topics: Activity report, Course
participation and logs.
In Siemens (2011) opinion a learning
management system like Moodle or Desire2Learn
captures a significant amount of data, including time
spent on a resource, frequency of posting, number of
logins, etc. This data is fairly similar to the data that
we get from the Google Analytics. However, GA
gives some results that it is not necessary to reanalyse
or to do extra effort to extract knowledge.
2.3 Course Dedication
This is a Moodle plugin that allows us to see and
analyse the estimate dedication time of the students
for each topic and activity included in Moodle
Courses. More detail information can be found here:
https://moodle.org/plugins/block_dedication or in the
authors site: http://www.cicei.com.
3 MatActiva PROFILE
The MatActiva site has been developed in
ISCAP/P.PORTO in order to improve learning and
increase the levels of success in the mathematics
subject areas. Initially, this site covered two
programmes namely Accounting and International
Commerce but it is still been extended to others.
The project was started in 2007 to help students,
especially in first year (home students, distance
students, ERASMUS students, Lifelong Learners)
who have weak Math preparation, poor consolidated
basis on the subject and different backgrounds,
wanting to improve their performance and success
(Azevedo et al., 2009).
The general objective of this project is to increase
student’s Mathematics literacy and their rate of
success in Mathematics, taking into account that this
subject is an important component in all educational
systems. The project attends a large number of
students by helping them developing transversal
skills that could be useful in their active life.
The challenge was innovating the teaching and
learning process, exploring VLE as a pedagogical
resource to create more motivating and engaging
learning materials and activities.
Engaging materials and temporal flexibility
supporting the individual and collaborative study of
students, has been of great importance. The
development of this project was crucial, especially for
working students and for students in geographical
areas away from school, who cannot always attend
classes and timely access to the support materials. In
addition, for students with a weak preparation and
without consolidated basis this project was
determinant to encourage and give them more self-
confidence. Communication abilities among fellow
students and among students and teachers increased.
The MatActiva project is intuitive and provides a
set of useful functionalities according to the subjects
taught in mathematics department, such as Algebra,
Calculus, Statistics, Financial Mathematics, etc...
offering support materials and promoting
self-learning.
In the initial menu we can find eight topics:
About us – Information about the project.
Mathematics Zero – An area supporting students
who have difficulties and gaps in basic
mathematics. Video lectures followed by a set
of proposed exercises related with the issue
presented in the video are available in this topic.
They can also find and solve online diagnostic
tests to validate prerequisites skills necessary for
different subjects.
Learning – In this topic students can find
interactive eBooks, tables of formulae, working
sheets about topics related with contents taught
in several mathematic courses. They can find as
well links to pages about mathematical subjects.
Tests – Here students can find and solve online
diagnostic tests, evaluation tests with multiple
choice or true/false questions. A large bank of
questions originates a series of self-evaluation
tests, which the student can solve and submit,
taking conscience of their level of knowledge.
Doubts – A forum where students can put their
doubts online and receive answers giving by a
teacher. More students are willing to participate
in an asynchronous forum than are willing to
speak up in class because forums are
asynchronous and students can take their time
composing a reply.
MathChallenge – One-year competition open to
all ISCAP/P.PORTO community with a set of 6-
7 challenges/problems to stimulate the students’
interest in mathematic problems. Learning
mathematics should also be done through
activities research and discovery. The
challenges reinforce the motivation, thinking
and communication.
Learning Analytics: A Way to Monitoring and Improving Students’ Learning
643
ERASMUS – Multiple choice tests in English to
support ERASMUS students.
ETC – Provides curiosities, cartoons, contests
and games to test math skills.
A question bank of more than 1 100 questions
divided into categories according to the four subjects
– Algebra, Calculus, Statistics and Financial
Mathematics – support the multiple choices tests
available in this topic. These tests were constructed
according to the guidelines proposed in Torres et al
(2011) and Haladyna (2004). Furthermore, feedback
is provided for each question, allowing students to see
the proposed solution, step by step.
It is important to find out levels of students’
engagement in the several materials provided.
4 METHOD
In this study, we analyse the students’ data using new
instruments installed in the project web site. Those
instruments were Google Analytics, Moodle reports
and Course Dedication, which were installed in
Moodle platform. Data was collected from the topics
described in section 3. We use Google Analytics to
retrieve data related to the number of sessions and
average time of sessions of the students. Dynamic
Table by Excel© was used to generate the graphs.
We also used Moodle Reports and Course
Dedication to generate some of the results.
The data was extracted and analysed to better help
our students at ISCAP/P.PORTO. We did
quantitative analyses of the data.
The research questions were the following: i) how
deep do visitors navigate in the website pages? ii) are
some of the contents more interesting than others? iii)
it is important the day of the week when we want to
propose problems/tasks to be solved in a limited time
period? iv) have the goals been reached? v) are the
materials available enough for the purpose for which
they were created?
All those questions guided a reflection around
students’ engagement and behaviour and intend to
answer to a broader question about the effectiveness
of the project.
5 MONITORING STUDENTS'
LEARNING
First, we started by characterize the students. In
Figure 1 we can see that majority of students access
our Project in our area, Porto, followed by a
considerable number of students whose geographical
area cannot be identified. The next city is Vila Nova
de Gaia, which borders Porto. In fourth, appears
Lisbon which is at a distance of 300 km from Porto.
This seems a little strange to us, and it can be related
with the IP (Internet Protocol) assignment made by
the Internet Service Provider (ISP). The following
cities are within a radius of 50/70 Km away fro
m
Porto. The remaining cities are apart from more than
100 Km from Porto, but the number is residual.
Figure 1: Accesses to MatActiva from major cities.
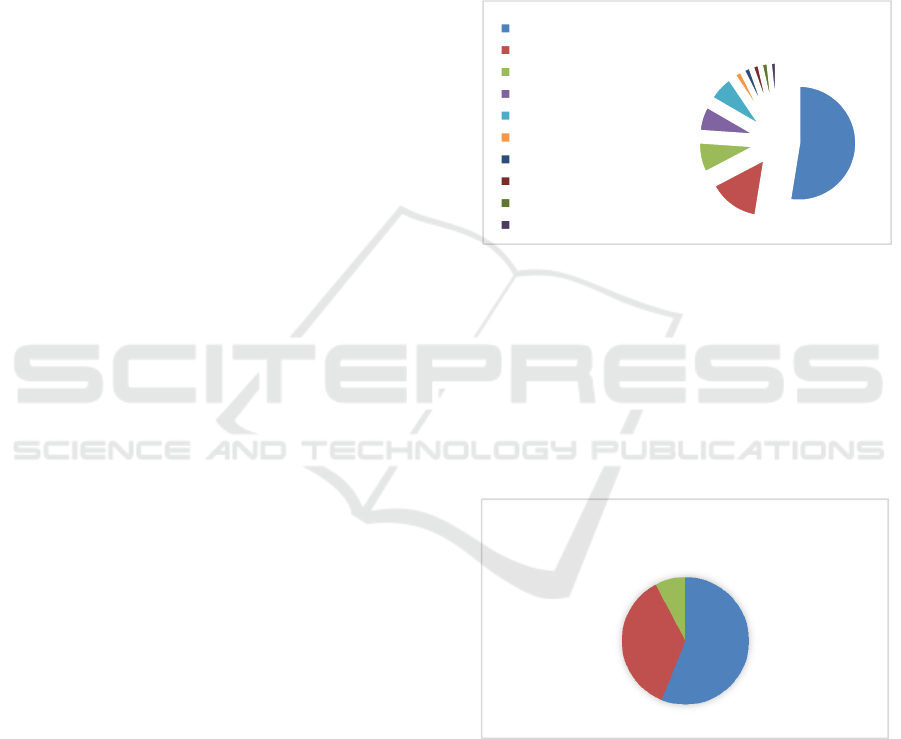
The age of most of the students that access ou
r
site is between 18 and 24, as we can see in
Figure 2
. I
t
is possible to verify that there are many “older”
students. The main reason for this happen is that in
our School there are several programmes for adult
students, in special students that work during the day
and study during the night (from 18h30 to 23h).
Figure 2: Percentage of sessions in site by age.
Interestingly we observe that although the
students in range 35 to 44 only have 8% of sessions
(
Figure 2
) they spend 25% of the time in each session
(Figure 3). The older students
p
erhaps have more
difficult in some areas, thus they need more time in
each session to solve some quiz or understand some
concepts.
Geographical
areas
Porto
(notset)
VilaNovadeGaia
Lisbon
Maia
SaoJoaodaMadeira
Matosinhos
Felgueiras
Espinho
SaoCosme
18‐24
56%
25‐34
36%
35‐44
8%
Sessions by ages
A2E 2017 - Special Session on Analytics in Educational Environments
644
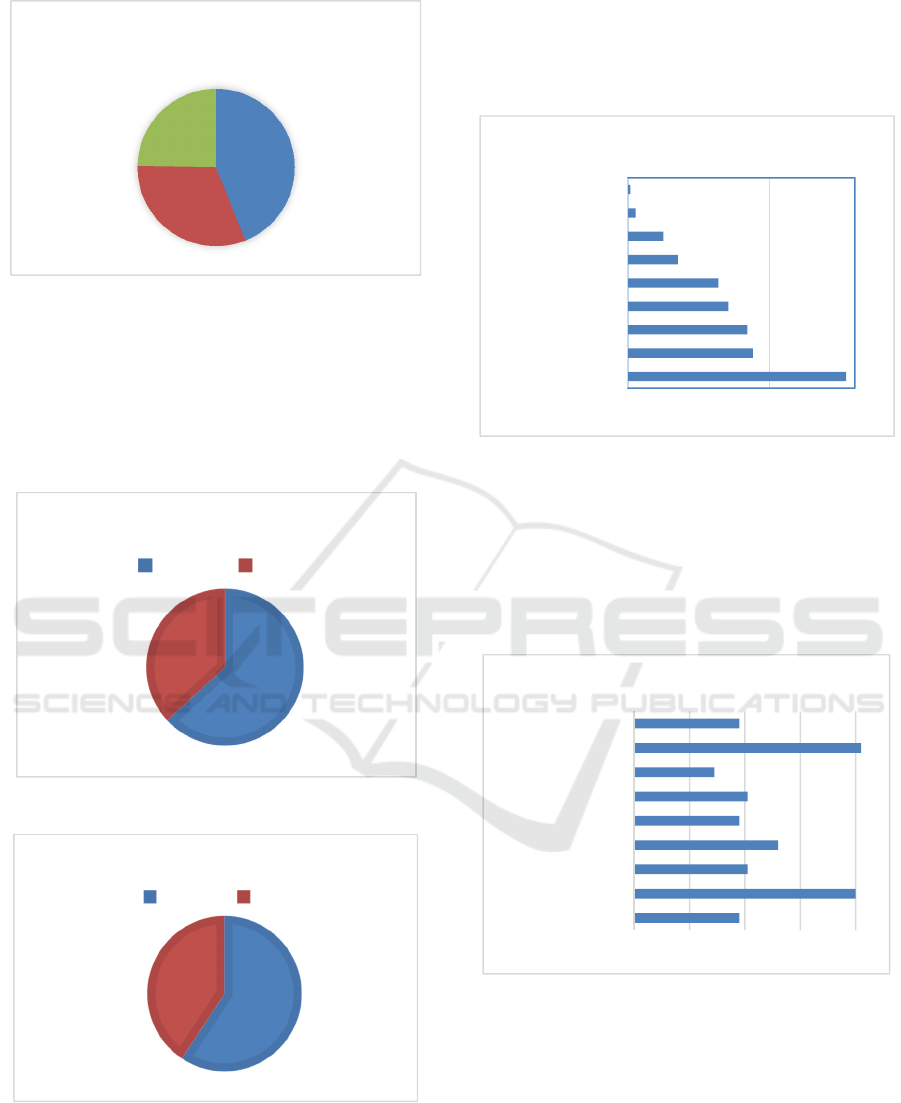
Figure 3: Percentage of average sessions duration by
students age.
When we consider the gender, 63% of the
sessions are from females and 37% are from males.
The average session duration is 59% for females an
d
41% for males, which indicate that females spend
a
little bit more time in each of the sessions.
Figure 4: Percentage of sessions in site by gender.
Figure 5: Percentage of average sessions duration by
student’s gender.
Figure 6
p
resents the allocation of the sessions b
y
topics available in MatActiva. It should be noted tha
t
the numbers appearing in the graph are the sum o
f
various activities included in each of the topics, as
described in Section 3. GA shows the number o
f
sessions by topic. We can observe that “Learning” is
the most accessed topic.
Figure 6: Number of sessions by topics.
Despite that Learning is the topic with the bigges
t
number of sessions, we can see that the topics Etc an
d
Mathematics Zero are the ones with more average
time by session. This fact is not surprising and can be
j
ustified by the type of contents available in each
topic.
Figure 7: Average sessions (in seconds) by topics.
In Figure 8 we can see the number of students’
sessions by month of the year. We can observe tha
t
January and November are the months with more
students’ accesses to the platform. Surprisingly we
still have accesses during July and August which are
traditionally holidays.
18‐24
44%
25‐34
31%
35‐44
25%
Average session duration
63%
37%
Sessions by gender
female male
59%
41%
Average session duration
female male
05000
Learning
Mathematics Zero
Calculus
MathChallenge
Algebra
Statistics
Doubts
Etc
Erasmus
Sessions by topics
020406080
Learning
Mathematics Zero
Calculus
MathChallenge
Algebra
Statistics
Doubts
Etc
Erasmus
Average session duration by
topics
Learning Analytics: A Way to Monitoring and Improving Students’ Learning
645
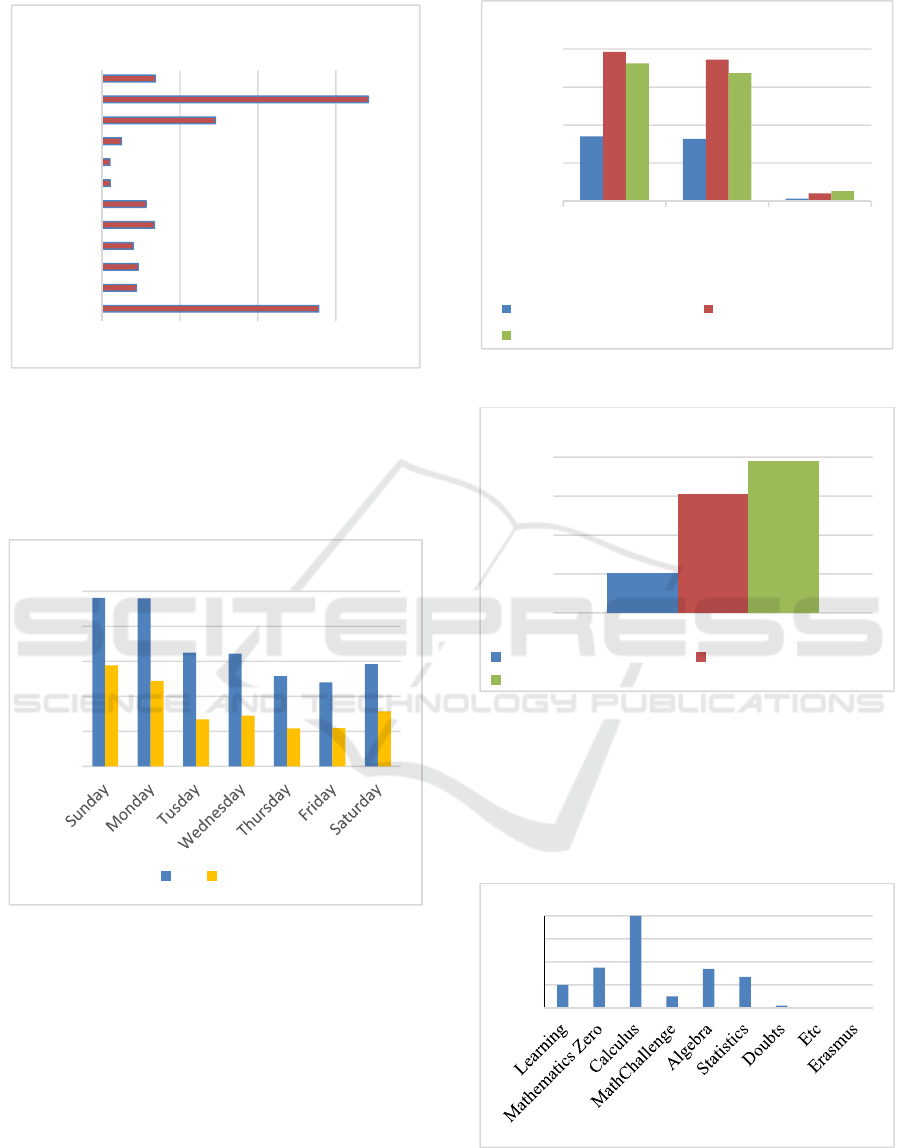
Figure 8: Sum of the sessions by month of the year.
In Figure 9, the number of students’ sessions b
y
day of the week is presented. We can observe tha
t
students use the platform mostly on weekends an
d
Mondays.
Figure 9: Sum of the number of sessions by day of the wee
k
compared with sessions quizzes.
It is possible to see (Figure 10) that in the last three
academic years the number of accesses has grown up.
Other finding (Figure 11) is that in the last years
the accesses to the website by phones and similar
devices also increased. Note that the last academic
year presented in the graph is not complete, since a
t
moment we write this paper we were only at the
beginning of the summer semester.
Figure 10: Sessions in last 3 academic years.
Figure 11: Traffic by mobile devices.
In Figure 12, the total dedication time (in hours)
for each of the topics is
p
resented. We can find tha
t
the Calculus, surpasses with a big difference all the
other topics that we have in MatActiva. Note that in
this graph, the data is from last 4 years.
Figure 12: Dedication time in hours for each topic.
In Table 3 we
p
resent the number of students tha
t
accessed each of the materials available in
0
10000
20000
30000
40000
50000
Sessions by day of the week
All Quizzes
0
30000
60000
90000
120000
Allusers Tabletsand
Computer
traffic
Mobile
Devices
traffic
Number of sessions in last 3 years
1/09/2014‐31/08/2015 1/09/2015‐31/08/2016
1/09/2016‐6/02/2017
0
2000
4000
6000
8000
Traffic in last 3 years by mobile
1/09/2014‐31/08/2015 1/09/2015‐31/08/2016
1/09/2016‐6/02/2017
0
500
1000
1500
2000
Total Dedication (h)
0 20000 40000 60000
1
3
5
7
9
11
Month
Sessions by month
A2E 2017 - Special Session on Analytics in Educational Environments
646
M
atActiva, considering only the eleven ones with the
highest number of accesses. We can verify tha
t
quizzes (random tests) are the ones most used with
large advantage.
Table 3: The MatActiva activities most accessed.
Materials most viewed in MatActiva
Mathematics Zero Accesses
Video classes and Diagnostic Test 6651
Learning
Support Forms, Lesson Plans and Practice
Problems 4385
Calculus
Random Test - Multiple Choice (Functions) 16784
Random Test - Multiple Choice (Integrals) 19448
Random Test - Multiple Choice (Series) 6854
Statistics
Random Test - Multiple Choice
(Permutations and Combinations) 10806
Random Test - Multiple Choice (Discrete
and Continuous Distributions) 5568
Algebra
Random Test - Multiple Choice (Matrix and
Systems) 7571
Doubts
Algebra 430
MathChallenge
MathChallenge 2014/2015 3177
Erasmus
Tests 55
6 DISCUSSION AND
CONCLUSION
The students that access MatActiva are similar to the
ones of the school where the project was
implemented, being that we have more students in the
ages from 18 to 24 years and more female students. A
bigger proportion of sessions and the average session
duration in this range of students’ age and gender
confirm this statement. It is interesting to verify that,
despite the percentage of the number of sessions in
the platform is only 8% for students aged 35 to 44, the
proportion of average session duration increases
significantly to 25% in this range of years. This can
lead us to the conclusion that they spend more time in
each of the resources than younger students. We
think that this could be done to the fact that these
older students do not study for a long time and have
got more difficulties. Considering gender, the
differences are not so pronounced, however females
spend more time in each of the sessions than males.
Most of the students’ accesses are from cities very
close to Porto, which is also accordingly to the type
of students in the school.
When we look at the students’ preferences, the
topic “Learning” presents the highest number of
sessions, but they spend more time, in average, with
the topics “Mathematics Zero” and “Etc”. This can
be due to the fact that the topic “Mathematics Zero”
is more intended to promote study and it requires a
more detailed and careful approach. This is a very
important topic to support students with more
learning disabilities leading to longer sessions.
The “Learning” topic has got several support forms
and working sheets in pdf format, that can be
downloaded and does not require longer session’s
duration.
We can also verify that students have bigger
dedication time (total hours spended) to the
subject “Calculus”, which is a subject that includes a
lot of quizzes with multiple choice questions. We
consider that this can be the reason for the students
spend a big amount of time in this subject, since this
is a way to preparing the assessment. We consider
that the other materials can be very important in the
students’ learning process, and were very hard to
develop. Thus, we must develop strategies to increase
the use of other types of resources by the students.
Concerning the analyses of the number of session
by month it was interesting to verify that we still have
accesses during the traditional holydays period. This
was a motivation for the teachers that are involved in
the project. The months with the biggest number of
accesses are November and January. With regard
November, after one month of classes, the students
start feeling difficulties and search for these tools that
can help them with their learning process. As for
January, students have exams at the end of that
month, and thus they can also be searching for tools
to help them with their study.
Considering the number of sessions by day of the
week, it was surprising verify that the students use the
platform during weekends. This can be due to the fact
that the students live near Porto but have long voyage
periods during the weeks, thus in the weekends they
stay at home and can have more available time to
dedicate to their study. This suggests that making
quizzes and homeworks available during weekend
may have better acceptance by students.
It was very stimulating to verify that the number
of students using the platform is steadily increasing in
Learning Analytics: A Way to Monitoring and Improving Students’ Learning
647

the last years. The increase in the use of mobile
devices, puts some more challenges, since the site is
not prepared to those types of accesses. Thus, we
should consider adapting the platform. We hope that
this can increase the participation of the students.
7 FINAL REMARKS
Learning Analytics have become popular in the
literature. In this work, we present some instruments,
such as Google Analytics, Course Dedication, and
Moodle Reports, that can help to improve the students
learning, based in this concept.
We described the project that we intended to
improve and that is going on for some years in
ISCAP/P.PORTO.
This paper constitutes an important reflexion for
the members of the project. It was verified that many
of the materials available are not used, and that the
students prefer to access the quizzes.
In the future we are planning to inquiry the
students about the reason for accessing mostly this
type of resources. We also intend to define strategies
to promote the other resources, since we consider that
these are important tools to improve students’
learning. Also, we are planning to implement
predictive analytics, and other analytics resources that
can improve the success of the students.
REFERENCES
Azevedo, J., Torres, C., Lopes, A. P. and Babo, L. (2009)
‘Enhancing Math Skills With Moodle’, in Proceedings
of ICERI 2009 - International Conference of Education,
Research and Innovation, pp. 2367–2377.
Bourkoukou, O., El, E., Mohamed, B. and Adnani, E.
(2016) ‘A Recommender Model in E-learning
Environment’. doi: 10.1007/s13369-016-2292-2.
Davenport, T. H., Harris, J. G. and Morison, R. (2010)
Analytics at Work: Smarter Decisions, Better Results,
Harvard Business School Press Books. Boston, MA:
Harvard Business Press.
Dyckhoff, A. L., Zielke, D., Bültmann, M., Chatti, M. A.
and Schroeder, U. (2012) ‘Design and implementation
of a learning analytics toolkit for teachers’, Educational
Technology & Society, 15(3), pp. 58–76.
ECAR (2015) ‘The Predictive Learning Analytics
Revolution: Leveraging Learning Data for Student
Success’, ECAR working group paper., pp. 1–23.
Graf, S., Liu, T. C., Kinshuk, Chen, N. S. and Yang, S. J.
H. (2009) ‘Learning styles and cognitive traits - Their
relationship and its benefits in web-based educational
systems’, Computers in Human Behavior. Elsevier Ltd,
25(6), pp. 1280–1289. doi: 10.1016/j.chb.2009.06.005.
Greller, W. and Ebner, M. (2014) ‘Learning Analytics:
From Theory to Practice’, Communications in
Computer and Information Science, 439(June). doi:
10.1007/978-3-319-08657-6.
Haladyna, T. M. (2004) Developing and validating
multiple-choice test items - third edition. 3rd edn.
Mahwah, New Jersey: Lawrence Erlbaum Associates.
doi: 10.1177/0146621605280143.
Harmelen, M. van and Workman, D. (2012) ‘Analytics for
Learning and Teaching’, CETIS Analytics Series, 1(3),
pp. 1–40.
Hasan, L., Morris, A. and Probets, S. (2009) ‘Using Google
Analytics to Evaluate the Usability of E- Commerce
Sites’, Lecture Notes in Computer Science (including
subseries Lecture Notes in Artificial Intelligence and
Lecture Notes in Bioinformatics), 5619 LNCS, pp.
697–706. doi: 10.1007/978-3-642-02806-9_81.
Long, P. D. and Siemens, G. (2014) ‘Penetrating the fog:
analytics in learning and education’, Italian Journal of
Educational Technology, pp. 132–137. doi:
10.17471/2499-4324/195.
Norris, D. M. and Baer, L. (2012) ‘Building organizational
capacity for analytics: panel proposal’, Proceedings of
the 2nd International Conference on Learning Analytics
and Knowledge, (February), pp. 18–19. doi:
10.1145/2330601.2330612.
Norris, D. M. and Baer, L. (2013) Building organizational
capacity for analytics. EDUCAUSE Publications.
Available at:
https://library.educause.edu/resources/2013/2/building
-organizational-capacity-for-analytics.
Recker, M. M., Walker, A. and Lawless, K. (2003) ‘What
do you recommend? Implementation and analyses of
collaborative information filtering of web resources for
education’, Instructional Science, 31(4–5), pp. 299–
316. doi: 10.1023/A:1024686010318.
Sclater, N., Peasgood, A. and Mullan, J. (2016) ‘Learning
analytics in higher education’, (April).
Siemens, G. (2011) How data and analytics can improve
education, Oreilly Radar. Available at:
https://www.oreilly.com/ideas/education-data-
analytics-learning (Accessed: 1 March 2017).
Siemens, G. (2012) ‘Learning Analytics : Envisioning a
Research Discipline and a Domain of Practice’, 2nd
International Conference on Learning Analytics &
Knowledge, (May), pp. 4–8. doi:
10.1145/2330601.2330605.
Siemens, G. and Long, P. (2011) ‘Penetrating the Fog:
Analytics in Learning and Education’, EDUCAUSE
Review, 46, pp. 30–32. doi:
10.1145/2330601.2330605.
Torres, C., Lopes, A. P., Babo, L. and Azevedo, J. (2011)
‘Improving Multiple-Choice Questions’, US-China
Education Review B. David Publishing, B(6b), pp. 1–
11. Available at:
http://www.davidpublisher.org/Article/index?id=1170
9.html.
A2E 2017 - Special Session on Analytics in Educational Environments
648
