
Energy Flexibility Potential of Industrial Processes in the Regulating
Power Market
Zheng Ma, Henrik Tønder Aabjerg Friis,
Christopher Gravers Mostrup and Bo Nørregaard Jørgensen
SDU Center for Energy Informatics, University of Southern Denmark, Campusvej 55, 5230, Odense, Denmark
Keywords: Energy Flexibility, Electricity Flexibility, Regulating Power Market, Industrial Processes.
Abstract: Demand response is generally considered necessary for efficiently upholding grid balance with the increased
intermittent production from renewable energy sources. Demand response is acknowledged to enhance the
use of more renewable energy friendly technologies, such as heat pumps, electric vehicles, and electric heating
in replacement of conventional technologies. To enable the use of demand response, the consumers must have
economical and practical incentives without loss of convenience. This study aims to investigate the demand-
response market potential of a flexible industrial process in the current electricity market structure. The Danish
West regulating power market is selected in this study with an ideal process simulation of an industrial roller
press. By analysing market data, the value of flexible electricity consumption by the roller press in the
regulating power market is demonstrated by an ideal process simulation.
1 INTRODUCTION
Denmark has established ambitious goals for
independence of fossil fuels towards 2050 (Danish
Government, 2011; DK Energy Agreement, 2012)
These goals imply a 12% reduction of gross energy
consumption in 2020 in comparison to 2006; a share
of 35% renewable energy in 2020; and 50% wind
energy in Danish electricity consumption in 2020.
This means that wind energy will cover more than 50
% of the total electricity consumption in 2020. A goal
that is almost reached, since wind power in 2015
covered around 42% of the total electricity
consumption (Energinet, 2017). Furthermore,
electricity and heat production must come from only
renewable energy sources in 2035. These are all
milestones toward the end goal in 2050, where all
energy is provided by renewable energy sources.
Traditionally, fossil-fuelled centralized and
decentralized power plants covered the electricity
production. The electricity production from fossil-
fuelled power plants is easy to regulate compared to
the consumption. The production and consumption
must always be in balance to ensure a stable and
functioning grid. However, when large amounts of
renewable energy sources (wind and solar) are
integrated into the electricity system, irregular
production fluctuations will emerge. With
fluctuations for both the production and consumption,
challenges arise since electricity is usually produced
according to the consumption demand. Hence, with
the increase in renewable energy sources, it will be
increasingly difficult to maintain and control the
balance between electricity production and
consumption.
There are different ways to deal with the above-
mentioned problem. However, the transition of the
electricity system requires large investments. One
approach is to expand the capacity of traditional
power plants to ensure balance in the electricity
system by having the necessary reserve capacity
disposable. According to the report ‘Smart Grid in
Denmark’ (Energinet and Danish Energy
Association, 2014), this approach requires a
socioeconomic investment of approximately 7.7
billion DKK, without yielding any additional benefits
for Denmark.
Another approach is to implement an intelligent
and flexible electricity system, a so-called Smart
Grid, which enables flexible consumption.
Establishing the Smart Grid requires a socioeconomic
investment of approximately 9.8 billion, according to
the report. The investment includes distribution grid
upgrading, equipment for metering, and control and
automation of consumptions. However, the
investment in a Smart Grid yields a benefit for
Ma, Z., Friis, H., Mostrup, C. and Jørgensen, B.
Energy Flexibility Potential of Industrial Processes in the Regulating Power Market.
DOI: 10.5220/0006380201090115
In Proceedings of the 6th International Conference on Smart Cities and Green ICT Systems (SMARTGREENS 2017), pages 109-115
ISBN: 978-989-758-241-7
Copyright © 2017 by SCITEPRESS – Science and Technology Publications, Lda. All rights reserved
109
Denmark of approximately 8.2 billion DKK, hence
the total net cost will be around 1.6 billion DKK.
The socioeconomic benefits are divided into
different categories. The first benefit is that
consumers shift their electricity consumptions
according to the electricity price. Thereby it can
reduce the socioeconomic cost of electricity
generation. The second benefit is that the electricity
consumption of consumers will be more easily
manageable, which makes it possible to implement
energy saving and demand response solutions. This
saves society the alternate capital cost that would
otherwise be required if these solutions were not
implemented. The third benefit is that the cost of
ancillary services can be reduced by allowing more
providers with lower costs access to the regulating
power market. The last benefit is especially
interesting in regards to demand-side flexibility.
The electricity price will to a greater extend
depend on the supply, thus a behavioural change in
the consumption patterns is expected to happen.
However, according to the current market rules, only
electricity consumers with large consumption can
participate in the market for ancillary services.
Therefore, a new market player is needed. This new
market player, the energy service aggregator, bundles
small and medium sized consumers to represent one
large consumption unit in the market. This allows
more demand-side flexibility to participate in the
regulating power market.
This paper aims to investigate the energy
flexibility potential of industrial processes available
to energy service aggregators for providing demand
response services and its impact on market
exploitation. A comprehensive review of applications
of demand response in the industrial sector is
provided in (Shoreha et al., 2016). The dominant
electricity consuming processes and equipment in the
industrial sector include machine drives, electrical
heating, and electro-chemical processes (Samad and
Kiliccote, 2012). The example that we consider in this
paper belongs to the category of machine drives. The
Danish DK-West regulating power market is selected
for simulating the energy flexibility of an ideal
process exemplified by an industrial roller press.
2 BACKGROUND
The Danish electricity grid is divided in two areas,
DK-West (Jutland and Funen) and DK-East
(Zealand). Additionally, the electricity grid is divided
into production, transmission, distribution, and
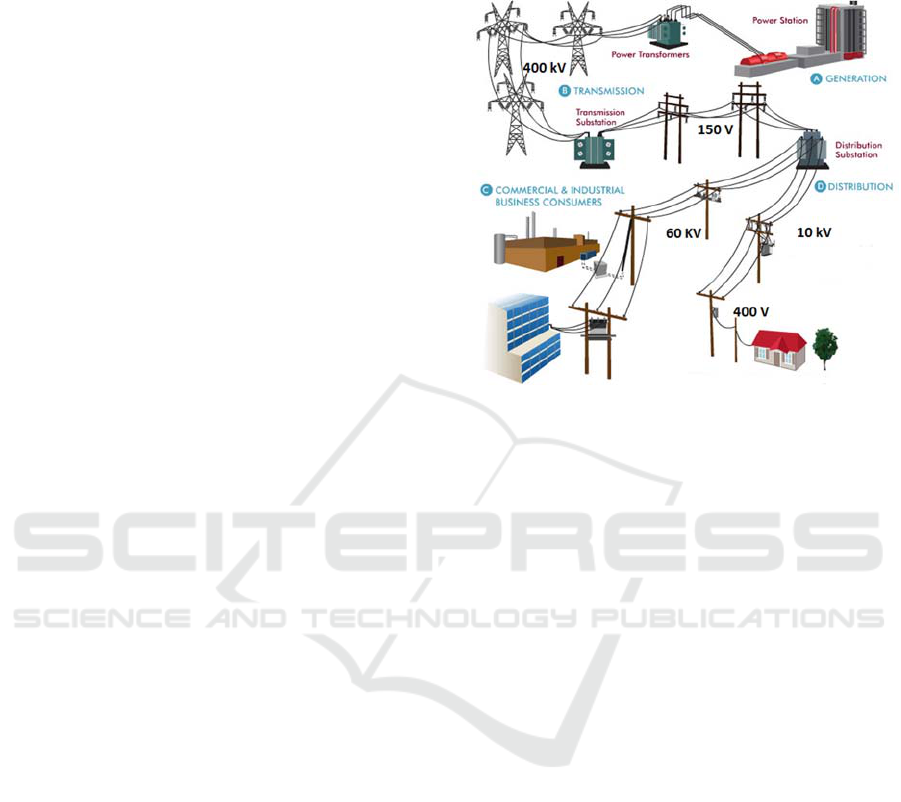
consumption (shown in figure 1).
The overall electricity market consists of a wholesale
market, retail market, and a regulating power market
for ancillary services.
Figure 1: Overview of the Danish transmission and
distribution grid (Clear Creek Networks, 2016).
2.1 The Wholesale Market
Wholesale trade of electricity in Denmark occurs
primarily as either bilateral trade directly between
buyer and seller or through the common Nordic
electricity market - Nord Pool. In the day-ahead
market (Elspot market), the electricity is traded the
day before the hour of operation. A smaller part of the
wholesale trade occur in the intraday market (Elbas
market), with trade up to one hour before the
operation hour. The day-ahead market is the major
electricity market, where 70 % of the total electricity
consumption in the Nordic countries is traded
(Energinet, 2013). The day-ahead market is the most
dominant factor for the electricity price formation of
public available prices in the wholesale market.
The volume traded in the intraday market is
significantly smaller compared to the day-ahead
market. In 2015, the total volume traded in the
intraday market in Denmark was 1.97 TWh,
compared to 56.25 TWh in the day-ahead market.
However, the standard deviation of the average
electricity prices in the intraday market in 2015 was
105.79 DKK/MWh with a mean value of 141.06
DKK/MWh, compared with a standard deviation of
84.21 DKK/MWh in the day-ahead market
(Energinet, 2016a). The high standard deviation in the
intraday market indicates a potential for trading of
energy flexibility in the intraday market. However,
the profit that can be made here is smaller than in the
SMARTGREENS 2017 - 6th International Conference on Smart Cities and Green ICT Systems
110

regulating power market.
2.2 The Regulating Power Market
After the intraday market has close, the Transmission
Service Operator (TSO) will account for all
imbalances in the grid. The TSO buys regulating
power from balance responsible parties, who have
registered offers for up and down regulation with a
given capacity (MW) and price (DKK/MW).
Regulation is considered from the perspective of the
production, meaning up regulation will increase the
supply, whereas down regulation will decrease the
supply. Manual reserves are traded in the Nordic
regulating power market - the Nordic Operational
Information System (NOIS).
The volume that is traded in the regulating power
market is lower than the amount in the intraday
market. The total amount of traded up and down
regulation in Denmark in 2015 was 0.44 TWh. By
comparing up and down regulation with the total
electricity consumption in Denmark, there are no
unambiguous tendencies during the past five years
(Energinet, 2016a). A detailed description of
ancillary services is provided in (Biegela et al., 2014;
Lund et al., 2015).
3 FLEXIBILITY POTENTIAL
With the increased capacity of renewable energy
sources in the future, the electricity grid must undergo
modifications for a continuous effective use of these
resources. One very important modification is support
for demand response in the demand side. In this
section, the estimation of the flexibility potential is
simulated using several scenarios. The potential of
increasing and decreasing the consumption, as result
of changing the production in certain periods, is
referred to as flexibility potential.
3.1 Case Selection
One of the leading supplier companies within the
cement industry, KHD Humboldt Wedag, is selected
for the flexibility potential simulation. In order for a
process to deliver all flexibility demands, it must
fulfil the two following requirements:
Turn on and off instantaneously or within very
short notice.
The discontinuous operation must not affect the
quality of the product from the process.
The roller presses of KHD Humboldt Wedag
seem suitable for the simulation. According to the
datasheet (KHD Humboldt Wedag, 2016), they have
a variety of roller presses with different pressing
forces and power consumptions. Since the pressing
forces are not important for the simulation, the roller
press with the highest power consumption (6000 kW)
is chosen.
3.2 Simulation Initialisation
The market data from 2015 is selected in this study
for the simulations. The regulating power market
volumes and prices (DK-West), as well as intraday
prices, are obtained from Energinet.dk (Energinet,
2016b), whereas Nord Pool Spot (Nord Pool Spot,
2016) is used for the intraday volumes.
Firstly, the required capacity is found that meets
all up and down regulations in the different markets
and areas. To find this, the maximum value of the up
regulation and the minimum value of the down
regulation (it is negative in the statistics) necessary at
any given hour during the simulation year (2015)
must be located.
The maximum amount of up regulation at any
given time during 2015 was 638.9 MW, whereas it
was -572.0 MW for down regulation. Since the
required up regulation is larger than the required
down regulation, the process capacity in the
simulation is chosen as 638.9 MW. Since each roller
press has a power consumption of 6 MW, a capacity
of 642 MW (107 units) must be installed to cover all
regulation requirements at all times in this simulation.
This is not a realistic number of units in a real life
scenario; however, it is used here as it suffices to
demonstrate the concept.
It is assumed that the roller press adds value to the
materials by pulverising it, which will further on be
referred to as ‘Process Income’ DKK/MW. Since this
value is not known, different scenarios for ‘Process
Incomes’ will be simulated. It is not given that the
process can deliver regulation whenever it is required.
If the process is running in the given hour, it will only
be able to deliver up regulation within that hour and
not down regulation. On the other hand, if the process
is turned off within that hour, it can only provide
down regulation.
To determine whether the process is turned on or
off, an evaluation of the ‘Process Income’, the hourly
spot price, and the electricity taxes must be done.
Figure 2 shows the spot price (incl. electricity
taxes) for an arbitrary selected day, January1
st
, 2015
and a ‘Process Income’ of 150 DKK/MW. The spot
price itself fluctuates throughout the day, whereas the
‘Process Income’ is constant. The electricity taxes in
the considered market, i.e., Denmark, relates directly
Energy Flexibility Potential of Industrial Processes in the Regulating Power Market
111
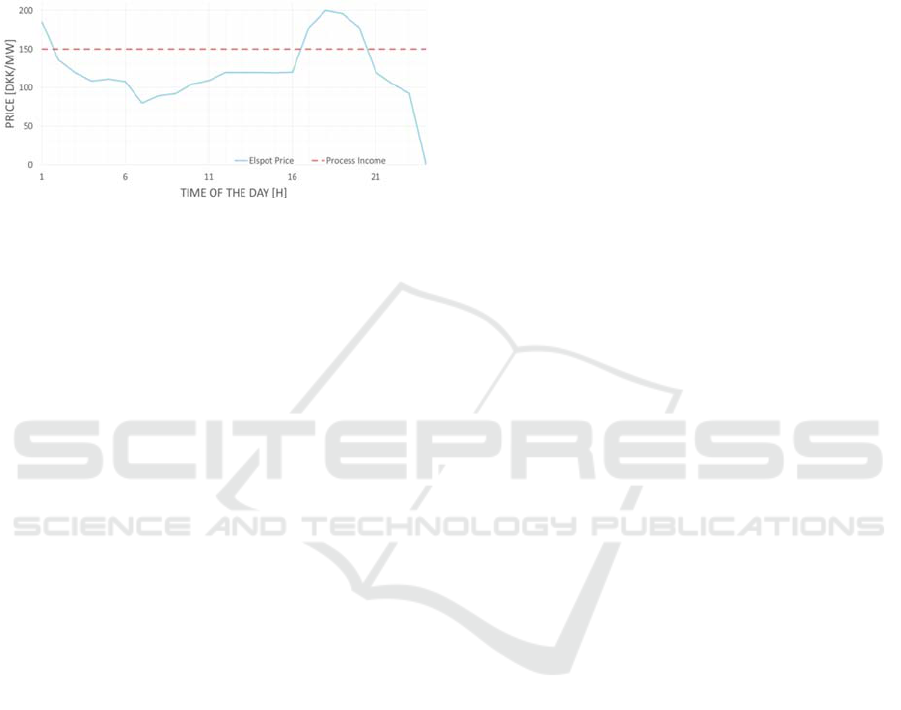
to the consumed amount of electricity. In the period
where the spot price with taxes is below the ‘Process
Income’, it is profitable to have the roller presses
running. However, when the spot price with taxes
exceeds the ‘Process Income’, it is no longer
profitable to have the roller presses turned on, and
they will therefore be turned off.
Figure 2: Example of the ON / OFF for the ideal process.
The process is ON below the constant line.
3.3 Down Regulation
An IF (condition) function is designed in this study to
determine whether alterations should be made to the
‘Initial Running Schedule’. The IF function is
described below, where, if all the following
conditions are met, the process will be turned on:
Down regulation is needed.
The process is turned off in the ‘Initial Running
Schedule’.
The income for providing down regulation and
‘Process Income’ exceeds the electricity taxes.
The income for providing down regulation
(referred to as ‘Income Down Regulation’) is
calculated as the product of the amount of units
activated to provide the down regulation, the
balancing power price for down regulation, and the
power consumption of each unit (e.g. 6 MW for the
roller press).
There is an electricity cost associated with
providing down regulation (consisting of taxes only).
However, the electricity taxes always exceed the
‘Income Down Regulation’, resulting in an economic
loss for providing down regulation if it is not for the
‘Process Income’. From the companies’ point of view
(the companies owning the roller presses), they can
receive cheap electricity for running their processes
when providing down regulation. Hence, instead of
keeping the roller presses turned off, it can become
profitable to turn them on.
If the ‘Income Down Regulation’ is calculated as
the difference between the payment for providing
down regulation and the electricity taxes, the profit of
the down regulation in all markets would be zero or
negative. This would provide an inaccurate picture of
the value of providing down regulation in each
market, as cheaper electricity from providing down
regulation does hold a significant production value,
especially if the ‘Process Income’ is high. For this
reason, the ‘Income Down Regulation’ is calculated
including the ‘Process Income’, but without taking
any additional expenses for providing down
regulation into consideration. The purpose of the
simulations are to estimate the value of flexible
consumption, and not including both the electricity
taxes and ‘Process Income’ into the calculations for
‘Income Down Regulation’ would give a wrong
picture of the real value in the electricity markets.
However, not all units will be activated when
supplying down regulation. If there is a need for e.g.
88.3 MW of down regulation in a certain hour, only
14 units will turn on. This provides 84.0 MW of down
regulation, whereas the last 4.3 MW should be
supplied from elsewhere. It is obvious that, more
down regulation can be supplied by the processes
with smaller units (e.g. 1 MW instead of 6 MW).
There are occasions where there is a need for
down regulation in a market, but it is not supplied by
the processes. This is due to that conditions are not
met. This lost potential for down regulation (referred
to as ‘Lost Regulation Income’) is heavily influenced
by the ‘Process Income’, which is why the
simulations are made for different values of ‘Process
Income’. The evaluation of different ‘Process
Incomes’ shows a big flexibility potential in the
market.
3.4 Up Regulation
For the up regulation market, the same procedure
applies in this study. A similar IF (condition) function
is made. The processes are turned off if the following
conditions are met:
Up regulation is needed.
The process is turned on in the ‘Initial Running
Schedule’.
The income for providing up regulation exceeds
the ‘Process Profit’ (which is the difference
between ‘Process Income’ and electricity costs,
i.e., spot price and taxes).
If the conditions are met, only the amount of units
required to cover the up regulation are turned off. The
remaining units continue to run. As in the simulation
for down regulation, there also remains a rest for up
regulating power, which cannot be covered by the
processes. This is either because the unit is turned off
in the ‘Initial Running Schedule’, it is more profitable
to keep the processes running and not provide up
regulation, or because the required up regulation is
SMARTGREENS 2017 - 6th International Conference on Smart Cities and Green ICT Systems
112
not divisible by 6 MW.
3.5 Simulation Results
The results for the DK-West regulating power market
can be seen in Figure 3. Figure 3 shows that the
maximum up regulation can be delivered at a Process
Income of 350 DKK/MW. As for down regulation,
the maximum amount is delivered at 375 DKK/MW.
Furthermore, the total amount of regulating power
(both up and down) that can be delivered is 154.1
GW, out of 359.6 GW, at ‘Process Income’ 350 and
375 DKK/MW.
Figure 3: The flexibility potential of the 6 MW ideal process
simulations for data from the DK-West Regulating Power
Market.
This means that around 43 % of the total regulating
power needed throughout the year can be delivered,
when using roller presses of 6 MW. However, this is
an ideal scenario and illustrates the total potential of
flexible consumption within the current regulating
power market. The remaining 57 % must come from
other sources, such as power generation or other types
of demand response.
The figure also shows that it is not profitable to
provide either up or down regulating power for low
value of ‘Process Income’ (e.g. 0-150 DKK/MW).
The electricity taxes were 498 DKK/MW, which
means that the balancing power price needs to be high
for it to be profitable to provide down regulating
power. The graph for ‘Down Regulation Delivered’
shows that the balancing power price does not
compensate for the high electricity taxes. Only a
small amount of down regulating power was
delivered until the ‘Process Income’ reached 350
DKK/MW. From this point, the down regulation
delivered was almost constant until the ‘Process
Income’ reached 675 DKK/MW afterwards it slowly
decreased. The reason for this plateau of constant
‘Down Regulation Delivered’ between 375-675
DKK/MW is due to the electricity taxes. The
electricity taxes make a restriction to the amount of
down regulating power that can be delivered by the
ideal process.
The reason why ‘Up Regulation Delivered’ is also
small at low values of ‘Process Income’ is indirectly
caused by the electricity taxes. The electricity taxes
have huge impact on the ‘Initial Running Schedule’
resulting in the processes being turned off at most
occasions. However, as the ‘Process Income’
increases, the processes are turned on more often in
the ‘Initial Running Schedule’. Since it is only
possible to provide up regulation when the processes
are already on, this can cause the increasing amount
of ‘Up Regulation Delivered’. At ‘Process Income’
375 DKK/MW, the ‘Up Regulation Delivered’ starts
to decline, because the income for providing up
regulation (referred to ‘Income Up Regulation’) no
longer exceeds the ‘Process Income’, and it is more
profitable to keep the processes running instead of
turning them off to provide the up regulation. The ‘Up
Regulation Delivered’ remains almost constant until
the ‘Process Income’ is as high as 675 DKK/MW.
The ‘Process Income’ is so high that the processes
keep on almost all the time in the ‘Initial Running
Schedule’. It allows much more up regulating power
and much less down regulating power to be delivered.
Figure 4: The total regulation income of the 6 MW ideal
process simulations for data from the DK-West Regulating
Power Market.
Figure 5: The lost regulation income of the 6 MW ideal
process simulations for data from the DK-West Regulating
Power Market.
Energy Flexibility Potential of Industrial Processes in the Regulating Power Market
113
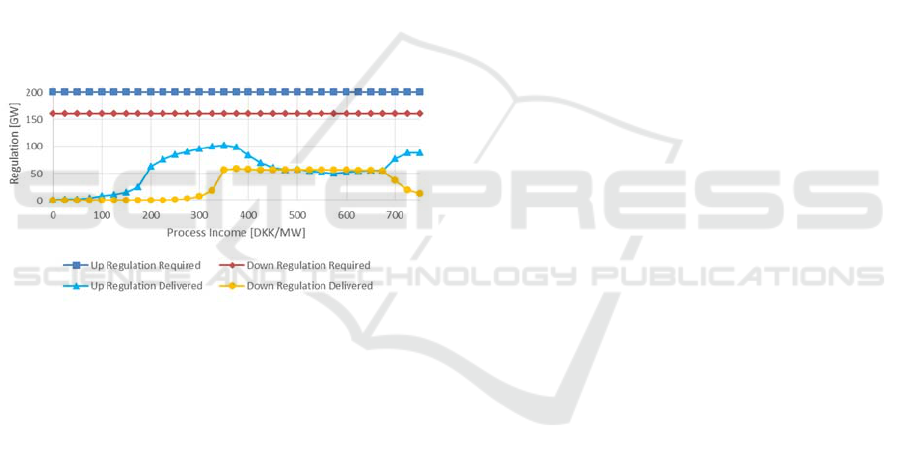
Figure 4 shows the total income for both up and down
regulation is highest (50.6 million DKK), when the
regulation potential is at its maximum, at a ‘Process
Income’ of 375 DKK/MW.
Unsurprisingly, as figure 5 shows the ‘Lost
Income Up and Down Regulation’ (defined as the
‘The Lost Regulation Income’) is at its lowest when
the ‘Process Income’ is 375 DKK/MW. It is because
the total regulating power and the income are at the
peak point.
In this study, a roller press of 6 MW has been used
in the simulation. In theory, it should be possible to
increase the amount of regulation capacity delivered
by using more but smaller processes. The smallest
roller press in the datasheet (KHD Humboldt Wedag,
2016) is 280 kW. It is possible to alter the power
consumption of the ideal process to study how it can
affect the amount of regulation provided. Replacing
the 6 MW roller press with a 280 kW roller press in
the simulation looks almost identical to the 6 MW
process, as shown in figure 6.
Figure 6: The flexibility potential of the 280 kW ideal
process simulations for data from the DK-West Regulating
Power Market.
The total amount of regulation delivered is 158.3
GW, instead of 154.1 GW, which constitutes 44 % of
the regulation required in 2015. It is only an increase
of 4.2 GW of regulation delivered, but it illustrates
the principle that more regulation can be delivered
with more but smaller processes. The optimal values
for the ’Process Income’ are the same as with the 6
MW process, but the ’Regulation Income’ has
increased from 50.6 to 51.7 million DKK. However,
it is questionable if this relatively small increase in
profit is enough to justify the additional cost and
effort of aggregating and administrating smaller
loads.
4 DISCUSSION
The simulation in this study is based on an ideal
process of the roller press of 6 MW, which is able to
deliver both up and down regulation instantaneously
without affecting the quality of the product from the
process. In the simulation, the ideal process can
deliver all required regulating power and the results
are the ’best-case scenario’. The ideal process is
associated with a ‘Process Income’. Different values
of ‘Process Income’ were simulated, to compensate
for the fact that the ‘Process Income’ for the roller
press process is unknown. By changing the ‘Process
Income’ in the simulation makes it possible to
evaluate, if an industrial process is likely to be
profitable for providing demand response in the
regulating power market.
This study takes the DK-West regulating power
market as example, because the balance responsible
parties are charged for their imbalance, and this is the
business potential for aggregators to enter the market
for regulating power. Meanwhile, more regulating
power is traded in the DK-West, due to the fluctuating
production from a large installed capacity of wind
turbines.
The roller press has functioned as the ideal
process for the simulation in the study. However, it is
an ideal scenario and the results would be naturally
difficult to achieve in practice, because the majority
of industrial processes link to certain operation hours
during a working day. In addition, some industrial
processes like the use of artificial lighting in
commercial greenhouses depend on external factors
like the weather forecast, and the decision to turn the
processes on or off requires more consideration than
just the ‘Process Income’ (Zheng and Jørgensen,
2016). Other examples of flexible consumption are
given in (Biegela et al., 2014). Here the examples of
households, supermarket refrigeration systems, and
Battery storage are used. The first two examples
address intrinsic flexibility in thermal capacity, and
the second electrical storage. Other examples on
energy storage technologies, including services
provide by electrical vehicles, are given in (Lund et
al., 2015). The case of compressed air for
manufacturing processes is considered in (Beier et al.,
2015). Our example differs from this previous work
in the field by focusing on flexibility provided by a
mechanical production process based on machine
drives.
5 CONCLUSIONS
To leverage the imbalance between supply and
demand in an electrical grid with a large penetration
of fluctuating renewable energy sources, there is a
SMARTGREENS 2017 - 6th International Conference on Smart Cities and Green ICT Systems
114

need for marketization of energy flexibility in the
demand side. Due to a larger amount of power being
traded in the intraday market, the total value of energy
flexibility in the intraday market is much higher
compared to the regulating power market. However,
due to market regulations the value of trading energy
flexibility is higher per unit in the regulating power
market compared to the intraday market. It means that
consumers can gain more income by delivering
energy flexibility into the regulating power market.
It is demonstrated that the ideal process is able to
deliver both up and down regulation, depending on
whether it is initially turned on or off and according
to the expenses of electricity taxes. An economic
statement of an aggregation company is not assessed
in this study, and it would be too complex to specify
actual expenses and determine how an aggregator can
regulate its income. An economic statement of
individual consumers is also out of the scope for this
study.
This study only addresses industries with a high
potential for delivering energy flexibility through
simple processes based on machine drives. To limit
the scope, small electricity loads related to industrial
site personnel, such as lighting, cooling, heating,
ventilation, and office equipment, are not considered
in this study, since the incentive of aggregating small
loads to perform demand response appears to be too
small compared to the impact on user inconvenience.
REFERENCES
Biegela, B., Westenholzb, M., Hansenc, L.H., Stoustrupa,
J., Andersena, P., Harbod S. 2014. Integration of
flexible consumers in the ancillary service markets. In
Energy, Volume 67, 479–489.
Beier, J., Thiede, S., Herrmann, C. 2015. Increasing Energy
Flexibility of Manufacturing Systems through Flexible
Compressed Air Generation. In Procedia CIRP,
Volume 37, 18-23.
Clear Creek Networks. 2016. Back to the Basics: The
Electrical Grid and The Substation. http://
www.clearcreeknetworks.com/2014/05/02/electricalgri
ds-101-an-introduction-to-utilities/
Danish Government. 2011. Energy Strategy 2050 – from
coal, oil and gas to green energy.
DK Energy Agreement. 2012.
Energinet.dk. 2017. http://energinet.dk/DA/El/Nyheder/
Sider/ Dansk-vind stroem-slaar-igen-rekord-42-
procent.aspx.
Energinet.dk & Danish Energy Association. 2014. Smart
grid in Denmark. Technical report.
Energinet.dk. 2013. Elmarkedet i danmark. Technical
report.
Energinet.dk. 2016a. Virksomheden. http://energinet.dk/
DA/OM-S/Omvirksomheden/Sider/ default.aspx.
Energinet.dk. 2016b. Udtræk af markedsdata. http://
energinet.dk/DA/El/Engrosmarked/Udtraek-af-
markedsdata/Sider/default.aspx.
KHD Humboldt Wedag. 2016. High Pressure Grinding
Roller Presses. Technical report.
Lund, P.D., Lindgren, J., Mikkola, J., Salpakari J. 2015.
Review of energy system flexibility measures to enable
high levels of variable renewable electricity. In
Renewable and Sustainable Energy Reviews, Volume
45, 785–807.
Nord Pool Spot. 2016. Historical Market Data.
http://nordpoolspot.com/historical-market-data.
Samad, T., Kiliccote, S. Smart grid technologies and
applications for the industrial sector. 2012. In Comput.
Chem. Eng. 47, 76–84.
Shoreha, M.H., Sianoa, P., Shafie-khaha, M., Loiab, V.,
Catalãoc, J.P.S. 2016. A survey of industrial
applications of Demand Response. In Electric Power
Systems Research, Volume 141, 31–49.
Zheng M., Jørgensen, B.N. 2016. Energy Flexibility of the
Commercial Greenhouse Growers: The Potential and
Benefits of Participating in the Electricity Market, In
proceedings of IEEE International Conference on
Sustainable Energy Technologies.
Energy Flexibility Potential of Industrial Processes in the Regulating Power Market
115
