
Graphicuss
Proposing a Graphical Discussion System
Tenshi Hara
1
, Kaijun Chen
2
, Iris Braun
1
and Felix Kapp
3
1
Chair of Computer Networks, School of Engineering Sciences, Technische Universit
¨
at Dresden, Dresden, Germany
2
Google Inc., 1600 Amphitheatre Parkway, Mountain View, CA 94043, U.S.A.
3
Chair of Learning and Instruction, School of Science, Technische Universit
¨
at Dresden, Dresden, Germany
Keywords:
Graphical Discussion, Guided Discussion, Graphicuss, Auditorium Mobile Classroom Service.
Abstract:
In this position paper, we present an approach to a graphical discussion tool, namely Graphicuss. It com-
bines known concepts of textual discussion systems (such as forums) and graphical feedback systems (such as
virtual interactive whiteboards) into a single canvas-based application. Graphicuss aims at graphics-based or
-enhanced discussions within a classroom setting. The goal is to allow all students to participate in such dis-
cussions, rather than only a selected few students at a physical blackboard/whiteboard presenting their work as
a discussion base. The combination of text and graphics allows for better discussion of concepts through tem-
poral correlation of text and graphics. Thus, Graphicuss applies known text-based discussion features (such
as quoting) to the graphical level while adding temporal context. Rather than quoting/forwarding an invariable
or only amendable image, Graphicuss enables quoting up until any point in time with changes/amendments
thereafter. After presenting the conceptual ideas and a few comments on our prototype, we discuss a some
preliminary findings with respect to interface design as well as storage requirements.
1 INTRODUCTION
In recent years more and more IT-based educa-
tional tools (IET) have been introduced into teach-
ing. This is a positive development with respect
to self-regulated learning which requires interaction
in the classroom as well as reliable feedback for
the learners (Winne and Hadwin, 1998; Zimmerman
et al., 2000). Graphical feedback systems (or vir-
tual interactive whiteboard systems) allow all students
to hand in graphical solutions to tasks during class,
which in return can be shared with all students attend-
ing, allowing for constructive discussions on all sub-
missions. This is favourable over the classic approach
of having a few students present their solutions on the
blackboard. Similarly, discussion systems have also
found their way into classes. Be it as a blackboard
discussion system where a Twitter live-stream is pro-
jected next to the blackboard or seminar presentation,
or as a second screen application, the intention is the
same: allow all attendees to discuss on the class’ top-
ics either anonymously or attributed.
In this paper we present a position of combin-
ing the before-mentioned approaches into a single
tool, namely a graphical discussion tool (Graphicuss).
Such a tool allows students to discuss topics and sub-
mit graphical drafts or solutions at the same time.
Our investigations took place in context of our
Auditorium Mobile Classroom Service (AMCS) gen-
eral research (Kapp et al., 2014; Hara et al., 2015;
Kapp et al., 2016). AMCS aims at fostering inter-
action in the classroom and thereby supporting stu-
dents to successfully regulate their learning process.
However, neither has the prototype been implemented
within the AMCS platform, nor have the results dir-
ectly contributed to AMCS. We wish to include our
findings in one of the upcoming updates to AMCS.
Such graphical tools may also benefit didactics ap-
proaches like Peer Instruction (Mazur, 1997), Col-
laborative Problem Solving (Roschelle and Teasley,
1995; Stahl, 2006), Shared Regulation (Malmberg
et al., 2015), Peer Assessment (Sadler and Good,
2006), et cetera. While more complex task types are
available for the Peer Instruction’s ConcepTest or typ-
ical Peer Assessment, the actual discussion aspects of
student interaction can be elevated to a ‘Peer Interac-
tion’. Such Peer Interaction can even be asynchron-
ous as stipulated by (Schellens and Valcke, 2005). For
example, students can be tasked to explain the Py-
thagorean theorem. While using the graphical discus-
Hara, T., Chen, K., Braun, I. and Kapp, F.
Graphicuss - Proposing a Graphical Discussion System.
DOI: 10.5220/0006368105190524
In Proceedings of the 9th International Conference on Computer Suppor ted Education (CSEDU 2017) - Volume 1, pages 519-524
ISBN: 978-989-758-239-4
Copyright © 2017 by SCITEPRESS – Science and Technology Publications, Lda. All rights reserved
519

sion system to draw out an explanation, discussions
on the presented can be immediately fostered. Shared
editing and/or quoting of drawings including tem-
poral information (when what was drawn how) en-
ables alternative suggestions and/or corrections based
on a certain correct partial solution, in particular be-
fore a mistake was made.
2 RELATED WORK
The prototypical approach we wish to position with
this paper is a combination of traditional text-based
discussion systems, such as forums, with canvas-
based graphical feedback systems, such as virtual in-
teractive whiteboards. There exists a variety of con-
cepts and products, so we wish to briefly discuss the
technical basic concepts of both.
2.1 Discussion and Forum Systems
There are many representatives of discussion and
forum systems, including ones with community votes
(and potentially with pseudo anonymity), for ex-
ample StackExchange
1
, Reddit
2
, or Amazon An-
swers
3
. Due to its nature as a knowledge exchange
hub for technical experts, especially computer engin-
eers, the StackExchange derivative StackOverflow
4
shall be considered closer here.
Any question can be asked within the platform,
and – as the community is self-moderated – be up- and
down-voted by all registered users. At some point,
given sufficiently negative score, questions and com-
ments are removed. In addition, contributions can be
reported to a moderation team and thus be removed
faster. It should be noted that users who have received
a significant amount of positive feedback are granted
moderation right automatically, which fosters the idea
of the community-driven self-moderation as anybody
can become a moderator.
The mentioned votes represent each individual’s
attitude toward the contributions. For example, users
having the same question may up-vote a question, or
incorrect answers can be down-voted. The sets of as-
sociated contributions – questions, answers and com-
ments belonging together – form discussions.
The initiator of a discussion can mark answers to
their question as ‘helpful’, allowing others easier and
quicker access to solutions. Up- and down-votes are
1
https://stackexchange.com
2
https://www.reddit.com
3
integrated in Amazon’s services
4
https://stackoverflow.com
accumulated in a score displayed next to the contribu-
tions (Bosu et al., 2013).
Users are able to favourite any question by click-
ing on a star next to it. Favoured questions are stored
and displayed within a list in the user profile. This
allows users platform-internal referencing of contri-
butions without having to rely on browser storage
such as bookmarks. This means that favoured con-
tributions are available on any client the user decides
to use. Contributions favoured by many are also fa-
voured in search results displayed to other users.
The scores of questions in combination with the
amount of answers and page views are utilised in or-
der to determine topical discussions. This is helpful
for topics that are in high demand at a given time
as they are aggregated and prominently displayed on
StackOverflow’s landing page.
The general concept of StackOverflow and all
other discussion systems is to allow (expert) discus-
sions on questions, provide a means to collaboratively
discuss, allow determination of solutions to prob-
lems, and finally to preserve knowledge generated
and/or exchanged in the discussions. This final as-
pect, namely preservation, can be considered imper-
ative as the same or similar discussions often recur
time and again.
It should be noted that StackOverflow allows an-
onymous usage, making it very attractive. On one
hand, this allows individuals to openly express their
lack of knowledge without having to fear disadvant-
ages, for example at work due to exposition to their
superior. On the other hand, the possibility to cre-
ate an identifiable account (associated with one’s
Google+ or Facebook account, or OpenID) allows
helpful individuals to shine with their willingness to
help as well as their expertise.
Similar considerations can be applied to discus-
sion systems utilised in classroom settings. For
example, the Canvas
5
learning management system
(LMS) includes a discussion system targeted at higher
education as well as K-12 settings. Besides the ex-
tensive capabilities as an LMS (for example in (Pen-
dergast, 2015)), the concepts introduced earlier by
means of StackOverflow can be applied to Canvas on
a class activity and assignment level, including scrip-
ted and guided discussions. However, the above men-
tioned anonymous usage is not possible, even though
anonymity can be a powerful tool in allowing all stu-
dents to participate in discussions (Hara, 2016).
5
https://canvaslms.com
CSEDU 2017 - 9th International Conference on Computer Supported Education
520

2.2 Graphical Feedback Systems
An interactive whiteboard utilising a virtual display
area (website frame, second screen, . . .) instead of a
physical display can generally be defined as a graph-
ical feedback system (GFS). They are discriminable
into different types by their collaborative capabilities:
• Personal Notebooks with a single content creator
not sharing their created content,
• Personal Bulletins with a single content creator
sharing their created content with at least one
other person,
• Shared Notebooks with multiple collaborative-
parallel or collaborative-serial acting content cre-
ators not sharing their created content, and
• Shared Bulletins with multiple collaborative-
parallel or collaborative-serial acting content cre-
ators sharing their created content with at least
one other person.
For obvious reasons all types of GFS are suitable
for learning platforms as they help students organ-
ise their (virtual) graphical work space. However,
the bulletin and especially the shared types encour-
age group activities, which are important for self-
regulated learning regarding performance in compar-
ison to peers. By presenting the own graphical solu-
tion or commenting on the latest version of a peer
students get information about their own knowledge
and skills. The exchange with others serves as a form
of external evaluation according to models of self-
regulated learning (Winne and Hadwin, 1998).
As GFS do not require a physical whiteboard with
limited space for students, utilisation is not limited
to a few representative students, but open to all at-
tendees. Furthermore, students not attending on-site
activities are able to partake in whiteboard activities
remotely. GFS require real-time capable infrastruc-
ture, especially devices providing own or shared ac-
cess to the system. These devices can either be loan-
ers or the students’ own.
Popular examples of GFS include, but are not
limited to AwwApp
6
, GroupBoard
7
, Scribblar
8
, and
Twiddla
9
. The latter three partially rely on propriet-
ary software (such as Adobe Flash) and are thus not as
widely accessible as AwwApp, but support inclusion
of documents such as presentation slides.
6
https://awwapp.com
7
https://groupboard.com
8
https://scribblar.com
9
https://twiddla.com
3 CONCEPT
We developed a concept combining aspects both,
from discussion systems as well as graphical feed-
back systems. Typical functions of classic text-based
discussion systems (for example forum systems) such
as answering and quoting are taken to the graphical
level. The temporal history of how a canvas was
drawn is reproducible, and quotes are made possible
by changing the canvas or the temporal history of the
canvas directly. That way, submissions can be dis-
cussed and even corrected in a natural flow of dis-
cussion. For example, an incorrect graphical solution
can be quoted up until the precise moment a mistake
was made, and then be corrected from there. This
enhances the learning effect in comparison to simply
taking the incorrect overall solution and annotating
corrections therein, without providing temporal con-
text to the students. In terms of feedback research
the tool offers not only ‘knowledge of result’ but
provides information that allow to deliver elaborate
and informative feedback (Narciss, 2013). Students
can review and reflect their performance and improve
thereby. The ideas are depicted in Figures 1 and 2.
In order to achieve our goal, we investigated dif-
ferent data-structure approaches allowing persisting
of temporal information on graphics creation. We fi-
nally concluded that scalable vector graphics (SVG)
as well as HTML5 canvas are capable of achiev-
ing this goal. It should be noted that SVG require
omission of optimisations, hence actually coding each
graphics object in order within the SVG.
The prototypical system resulting from our initial
investigations and conception phase can best be de-
scribed as a forum with personal bulletin. However,
as soon as replies and quotes are created for contri-
butions, the graphical portion behaves more like a
shared bulletin. For clarity, it should be noted that
the prototype was not designed to serve both extreme
ends, namely forums and graphical feedback. On
one hand, while technically possible to serve as a
pure forum, the utilisation of the graphical features
Figure 1: Concept of drawing history.
Graphicuss - Proposing a Graphical Discussion System
521

Figure 2: Concept of replying to existing contributions with
possibility to quote, and add text as well as new drawings.
is strongly encouraged in class. On the other hand,
the graphical features cannot be utilised as notebooks,
neither personal nor shared. The forum-like organisa-
tion of contributions does not allow ‘hidden’ content
required notebooks. Currently, we have no plans to
implement such functionality.
Taking the findings of (Smus, 2009) as a start-
ing point, we then investigated the performance of
SVG and canvas drawings within our desired discus-
sion context. Smus concluded that SVG scales badly
with object count, whereas canvas scales badly with
drawing area size. Considering the expectable ob-
ject count of a submission within a classroom setting,
we chose a canvas-based drawing approach after fur-
Figure 3: Mapping of canvas elements: JSON on the client-
side; objects on the server-side.
ther testing, including drawing coverage test with dif-
ferent drawing area sizes. Finally, we developed an
import/export-based client-server data-structure with
serialised data-structure representing the canvas in-
structions within the HTML5 context of the client,
and an object-based data-structure within the server
engine (refer to Figure 3). This allows us to accurately
represent not only the order of object creation, but
the exact time-stamp and stroke speeds (Chen, 2016),
while reducing the overall required storage space.
4 FIRST RESULTS
We implemented a basic prototype corresponding to
the basic points of our concept, named Graphicuss.
Therefore, we are able to present preliminary results
based on a conceptual evaluation of the technical as-
pects of the implementation. We plan to re-test with a
modified prototype in the summer of 2017. Based on
the results of the new tests, a version of Graphicuss
with further modified code-base will be embedded in
the AMCS platform
10
.
First of all, we conducted five short interviews in
order to prepare a first prototype based on a System
Usability Score (SUS). As a result of an achieved 73.5
SUS, even though in the ‘good to excellent’ range, a
few modifications to the concept were required. Es-
pecially as certain SUS items corresponding to easy
understanding and intuitive usage of the graphics his-
tory were scored low. Thus, the drawing history
was replaced with a textual representation in favour
of time-stamped information as depicted in Figure 4.
By moving the mouse courser (mouse-based interac-
tion) or the finger (touch-screen interaction) over the
timestamps, the graphic on the left changes to the cor-
responding time-stamp.
We still need to determine whether a different
type of history representation is favourable. Based
on the current information, our main concern is that
the history pane becomes confusing with large counts
of timestamps. Our hope is, an approach based on
known elements of video controls (buttons for for-
ward, rewind, play, and pause, as well as a seek bar)
might be a more favourable solution.
Secondly, we have determined a potential bottle-
neck in our object-based storage of canvas elements
and their history on the server side. The storage re-
quired has linear growth with each element added to
the canvas, independent of the canvas size and fill.
In contrast to that, native storing of individual pixels
within the canvas (for example as a bitmap) saturates
10
https://mobileclassroom.inf.tu-dresden.de
CSEDU 2017 - 9th International Conference on Computer Supported Education
522
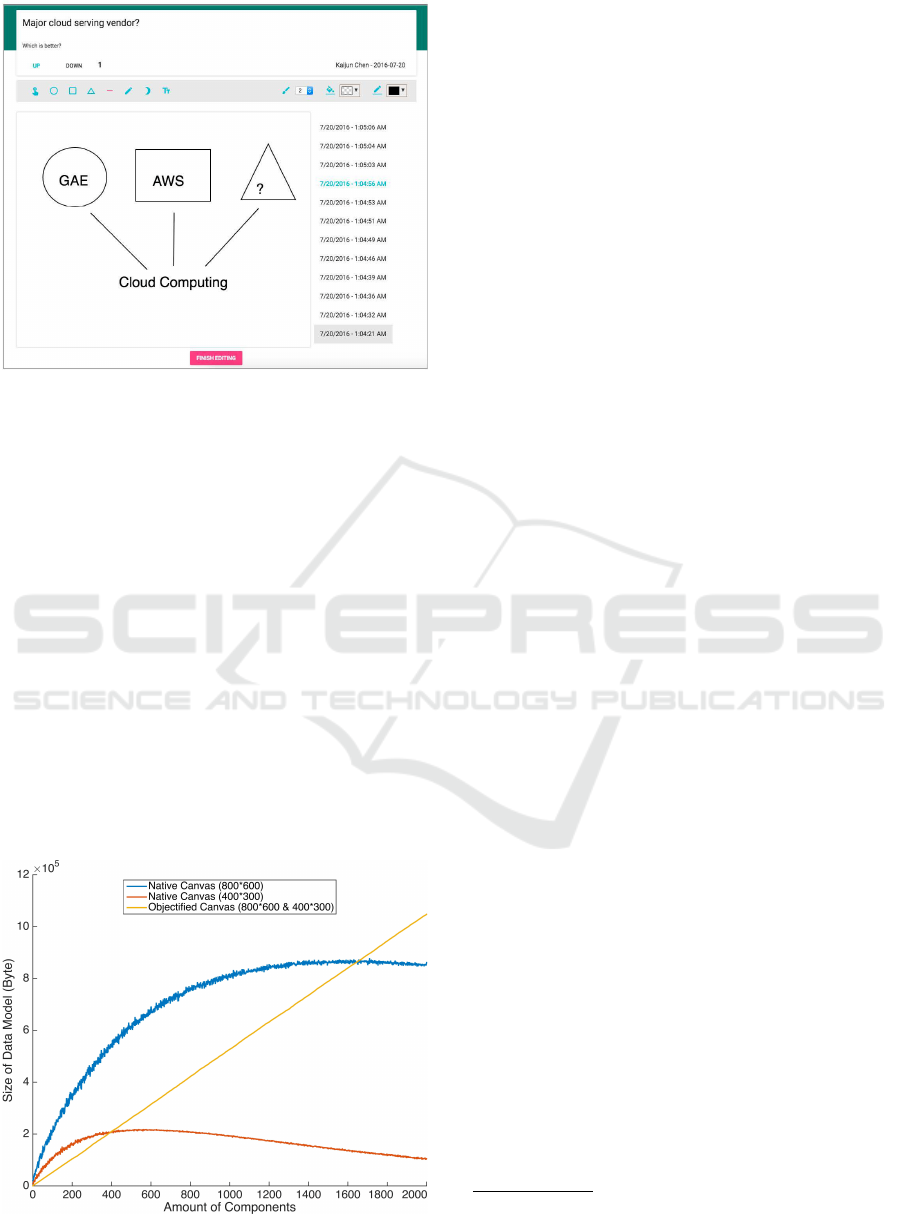
Figure 4: Prototype with modified history pane.
with growing element count. Namely, as no new in-
formation is added, a pixel already drawn can be over-
drawn in the same colour multiple times without any
addition to the storage space required. On the con-
trary, the storage space required decreases as native
storage can compress the data required for the same
information for unobstructed areas of the same col-
our. The preliminary results of our tests with black-
and-white drawings are depicted in Figure 5.
For expectable component counts within typical
classroom settings, the object-based storage is obvi-
ously favourable over the native storage. Even for
a rather small canvas of 400 × 300 px, roughly 400
components must be drawn before native storage un-
dercuts the object-based storage’s requirements. This
correlation holds true for larger canvases and is lin-
early correlated to the canvas size. For example
roughly 1, 600 components before native storage un-
Figure 5: Comparison of required storage space for object-
based and native storage.
dercuts object-based storage in a 800×600 px canvas.
The components measured in Figure 5 were ran-
domly created and placed by an automated script. In
tests with actual test persons, we never exceeded 30
components for the visualisation, for example the Py-
thagorean theorem, cloud computing basics (Figure
4
11
), or TCP connection establishment.
5 CONCLUSION AND
FUTURE WORK
The solution we presented in this paper called Graph-
icuss is a combination of text-based discussion sys-
tems and graphical feedback systems. In order to
support students in self-regulated learning processes,
this tool can be used in lectures and exercises to dis-
cuss tasks and related solutions step-by-step. It sup-
ports the group discussion phase of Peer Instruction,
as well as Peer Assessment and Collaborative Prob-
lem Solving. So students will get some feedback of
their reached knowledge and expertise and can reg-
ulate their learning strategy. Using features of dis-
cussion boards like voting and commenting the best
solutions can be found easily.
Our approach allows a step-by-step replay of
the drawing process by storing all drawing actions.
Therefore, it supports a fine-grained discussion of
mistakes or particularly good points made by the con-
tributors. From a didactics point of view, the recon-
struction of a solution’s path forces the students to
take a deeper look into the subject compared to the
case in which only the right answer is presented by
the lecturer.
With respect to the identified potential storage
bottle-neck, we will investigate further into colour
drawings of different colour depth (8 and 16 Bit).
Currently, we think a limitation of element count and
colour depth will be required in order to keep storage
requirements small. A limitation to black-and-white
drawings as in the current prototype may impede the
usability too much. Often drawn combinations of ele-
ments (such as an objects with its lifelines in UML
diagrams) could be made available as templates in
order to further reduce storage requirements as these
could be handled as a new type of object rather than a
set of objects.
Next step in development will be the integration
in our Audience Response System – AMCS – to use
Graphicuss in lectures and exercises. Afterwards, we
11
Text is treated as an individual object similar to the be-
haviour of common drawing programmes. Each text has a
per-object history (indiscernible in the screen shot).
Graphicuss - Proposing a Graphical Discussion System
523

want to investigate user experiences in more experi-
ments in real university settings to evaluate usability
and user acceptance of our tool.
REFERENCES
Bosu, A., Corley, C. S., Heaton, D., Chatterji, D., Carver,
J. C., and Kraft, N. A. (2013). Building reputation
in StackOverflow: an empirical investigation. In Pro-
ceedings of the 10th Working Conference on Mining
Software Repositories, pages 89–92. IEEE Press.
Chen, K. (2016). Graphical Discussion System. Master’s
thesis, Technische Universit
¨
at Dresden.
Hara, T. (2016). Analyses on tech-enhanced and an-
onymous Peer Discussion as well as anonymous Con-
trol Facilities for tech-enhanced Learning. PhD
thesis, Technische Universit
¨
at Dresden. http://nbn-
resolving.de/urn:nbn:de:bsz:14-qucosa-205517.
Hara, T., Kapp, F., Braun, I., and Schill, A. (2015). Com-
paring Tool-supported Lecture Readings and Exercise
Tutorials in Classic University Settings. In Proceed-
ings of the 7th International Conference on Computer
Supported Education (CSEdu 2015), pages 244–252.
Kapp, F., Braun, I., and Hara, T. (2016). Evaluating Lec-
tures Through the Use of Mobile Devices - Auditor-
ium Mobile Classroom Service (AMCS) as a Means
to Bring Evaluation to the Next Level. In Proceed-
ings of the 8th International Conference on Computer
Supported Education (CSEdu 2016), pages 251–257.
Kapp, F., Braun, I., K
¨
orndle, H., and Schill, A.
(2014). Metacognitive Support in University Lec-
tures Provided via Mobile Devices - How to Help
Students to Regulate Their Learning Process during
a 90-minute Class. In Proceedings of the 6th Interna-
tional Conference on Computer Supported Education
(CSEdu 2014), pages 194–199.
Malmberg, J., J
¨
arvel
¨
a, S., J
¨
arvenoja, H., and Panadero,
E. (2015). Promoting socially shared Regulation of
Learning in CSCL: Progress of socially shared Regu-
lation among high-and low-performing groups. Com-
puters in Human Behavior, 52:562–572.
Mazur, E. (1997). Peer Instruction: A User’s Manual. Pren-
tice Hall, Upper Saddle River, NJ, Series in Educa-
tional Innovation edition.
Narciss, S. (2013). Designing and Evaluating Tutoring
Feedback Strategies for Digital Learning Environ-
ments on the basis of the Interactive Tutoring Feed-
back Model. Digital Education Review, (23):7–26.
Pendergast, M. (2015). Leveraging Learning Management
System to Accommodate Students with Disabilities:
Issues and Experiences with the Canvas LMS. In Pro-
ceedings of the 18th Southern Association for Inform-
ation Systems Conference.
Roschelle, J. and Teasley, S. D. (1995). The Construction
of shared Knowledge in Collaborative Problem Solv-
ing. In Computer-supported Collaborative Learning,
pages 69–97. Springer.
Sadler, P. M. and Good, E. (2006). The Impact of Self-
and Peer-Grading on Student Learning. Educational
Assessment, 11(1):1–31.
Schellens, T. and Valcke, M. (2005). Collaborative Learn-
ing in asynchronous Discussion Groups: What about
the Impact on Cognitive Processing? Computers in
Human Behavior, 21(6):957–975.
Smus, B. (2009). Performance of Canvas versus SVG.
http://smus.com/canvas-vs-svg-performance/.
Stahl, G. (2006). Group Cognition: Computer Support
for Building Collaborative Knowledge (Acting with
Technology).
Winne, P. H. and Hadwin, A. F. (1998). Studying as self-
regulated learning. Metacognition in educational the-
ory and practice, 93:27–30.
Zimmerman, B. J., Boekarts, M., Pintrich, P. R., and
Zeidner, M. (2000). Attaining Self-Regulation: a
social cognitive perspective. Handbook of self-
regulation, 13:13–39.
All URLs were last successfully accessed on 01/24/2017.
CSEDU 2017 - 9th International Conference on Computer Supported Education
524
